

Product
August 16, 2013
HRC Imports by Port and Country
Written by Peter Wright
This is one of an expanded series of analyses, exclusive to the Steel Market Update that is designed to provide a much more comprehensive view of actual volume by product. This will enable a steel buyer or manager to see exactly what came into his immediate vicinity and where it came from. This series of reports includes hot rolled, cold rolled, HDG and other metallic coated, (mainly Galvalume). We will publish these in the same format in four consecutive issues of the Steel Market Update. All volumes are in short tons. In Tables 1 and 2 the smaller volume sources and ports of entry have been removed to make the tables more readable.
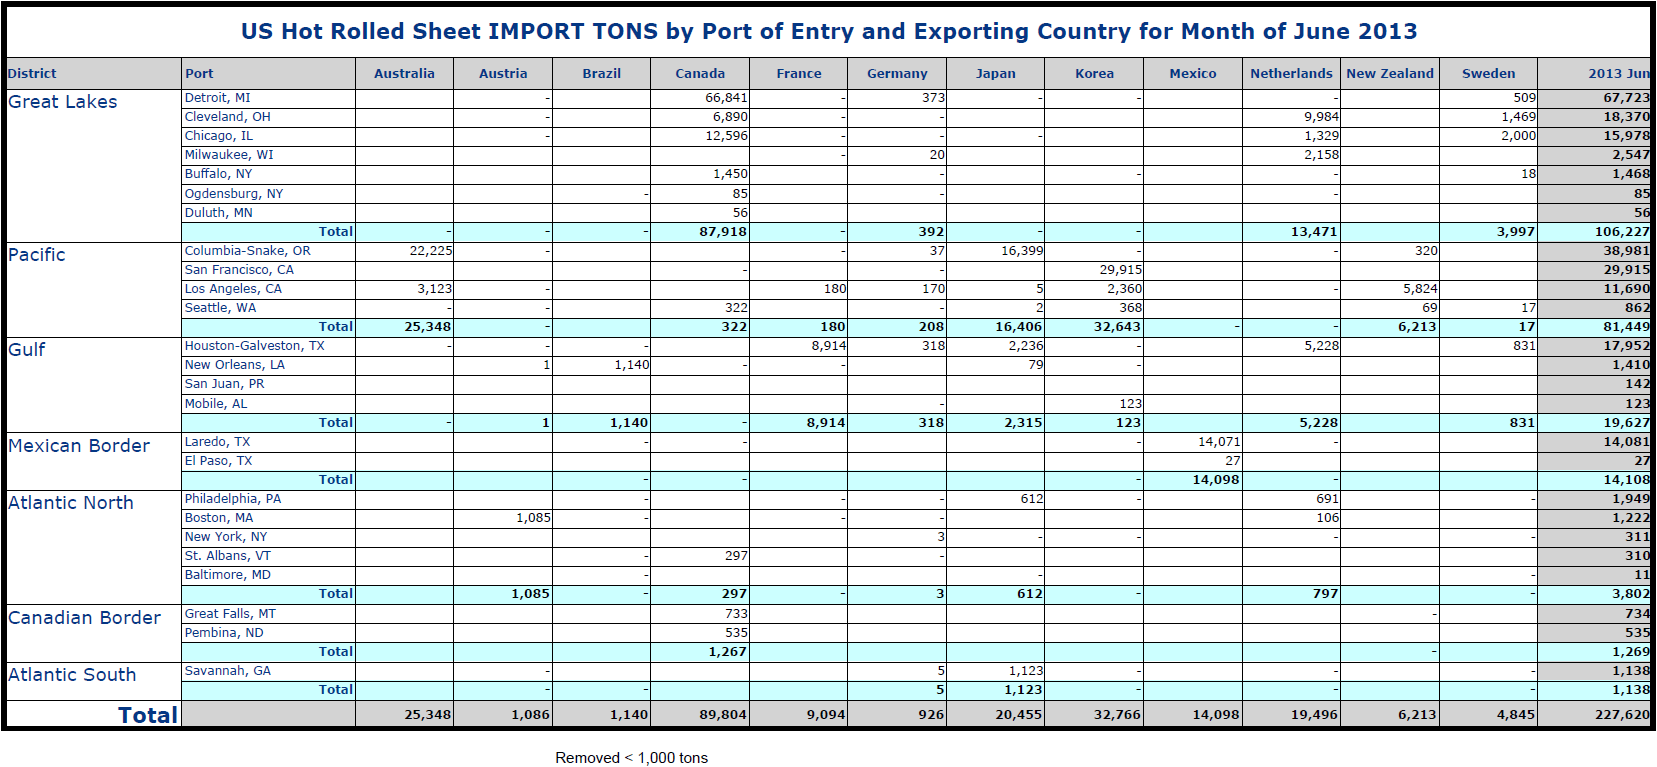
Total HR sheet tonnage in June was 227,620 tons, up 10.3 percent from May but down by 5.0 percent from June last year. Table 1 shows the detail by port of entry and country of origin. Canada as usual shipped in the most tonnage which mainly entered Detroit. Korea came in second with 32,766 tons of which 29,915 entered through the port of San Francisco. Tables 1 and 2 are much too comprehensive for a detailed description. The way to read them is as follows. If you are a buyer in Atlanta for example you would learn that very little tonnage came into your area in June, only 1,138 tons into Savannah, 123 tons into Mobile and 1,410 tons into New Orleans.
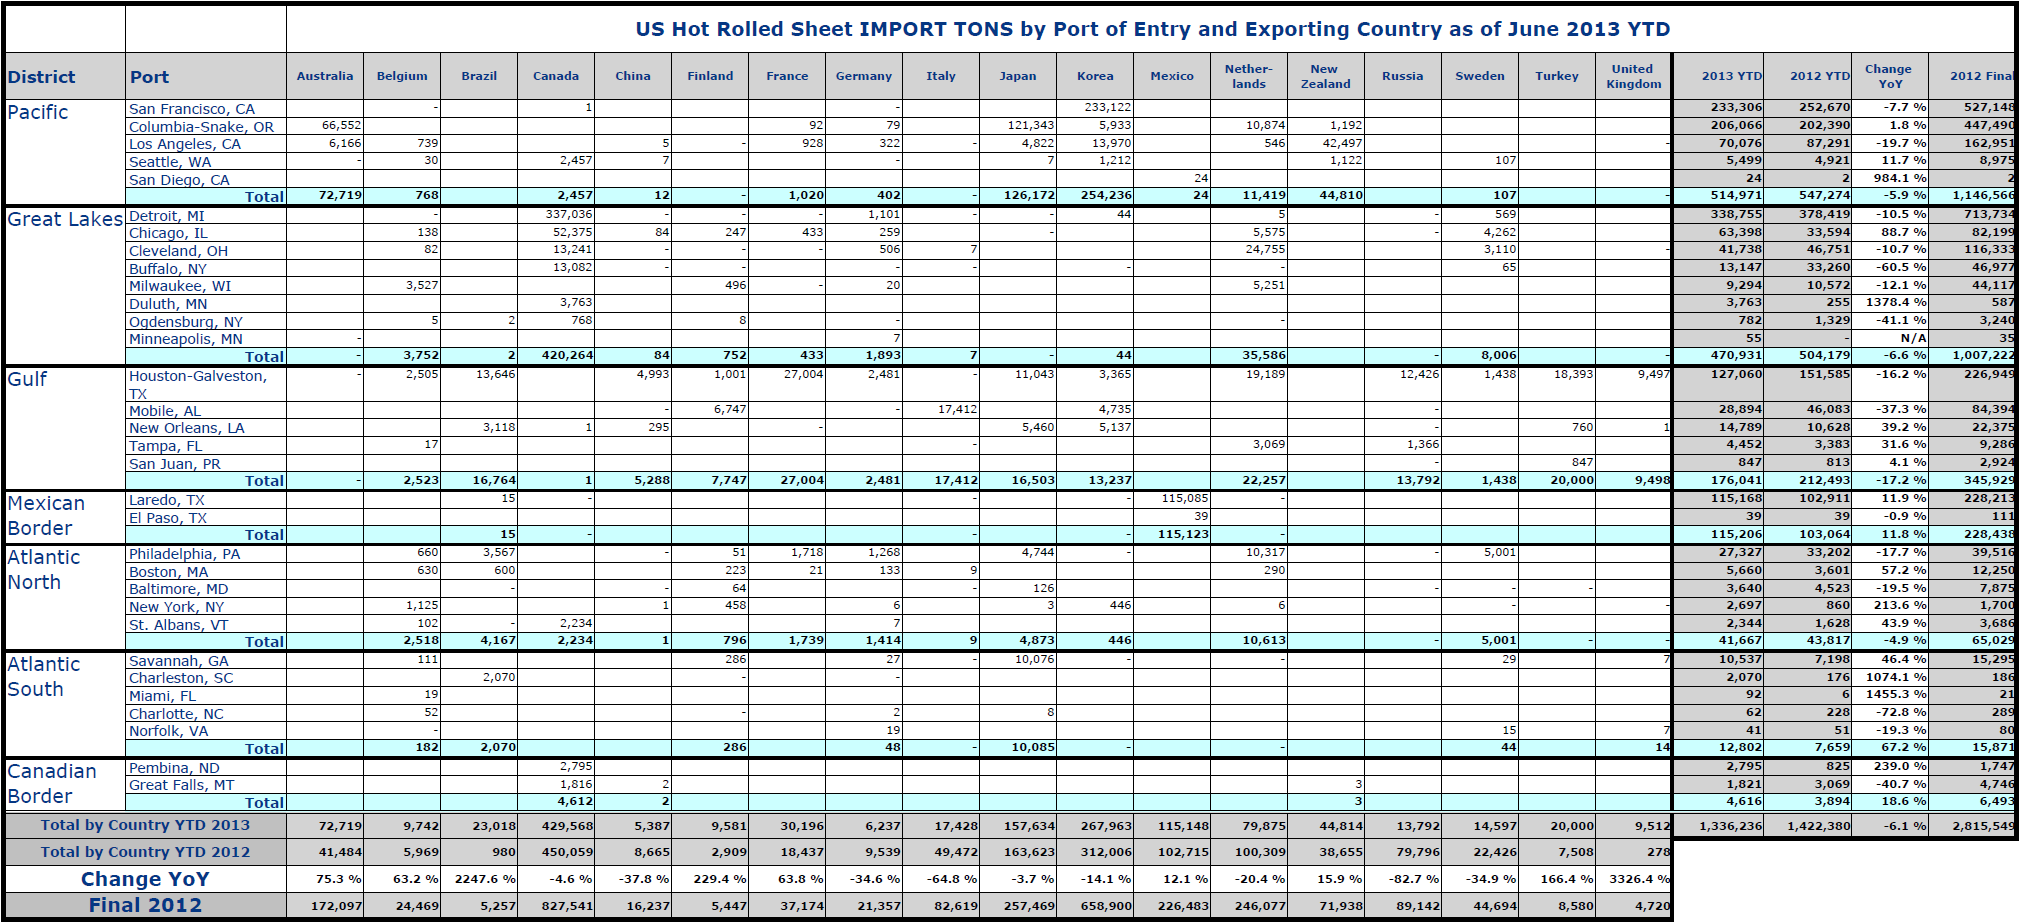
In 2013 YTD through June 1,336,236 tons entered the US, down by 6.1 percent from 2012 through June. Significant changes this year are that Australia is up by 75.3 percent and tonnage from Brazil has grown from 980 tons in 2012 to 23,918 tons in 2013. Major districts of entry are the Pacific and Great Lakes. YTD these regions are down by 5.9 percent and 6.6 percent respectively. The South Atlantic region is up by 67.2 percent this year but the tonnage is relatively small. Table 2 gives detail of tons by port of entry for 2013 through June.
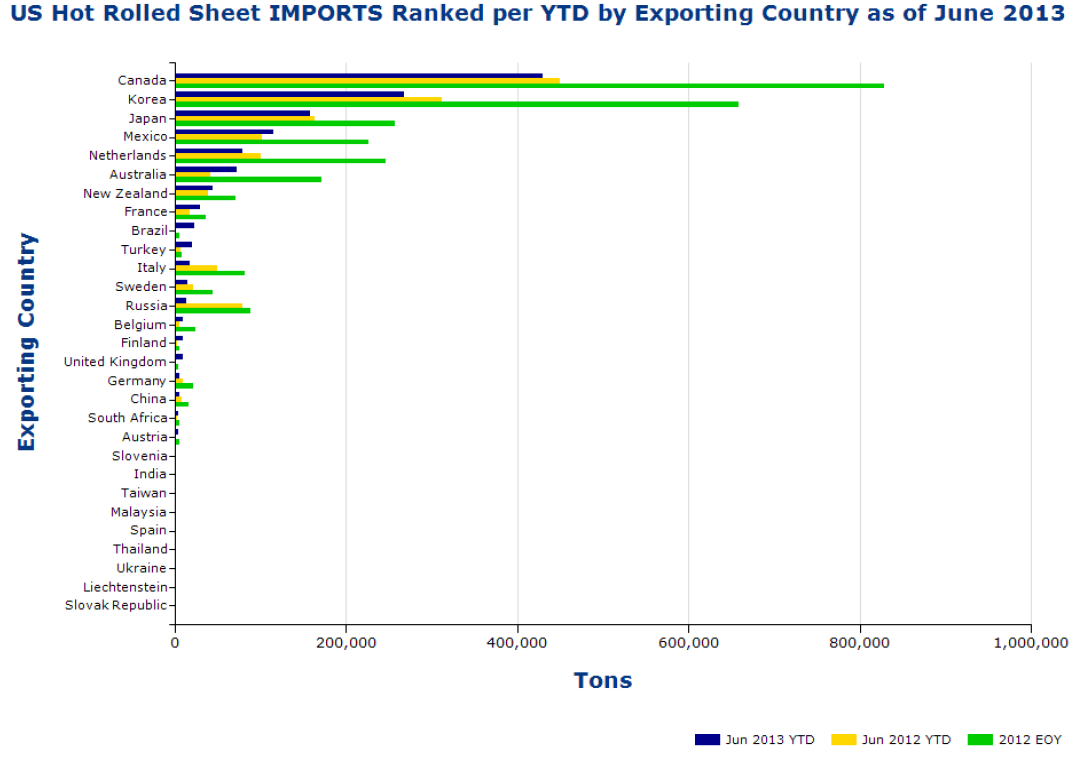
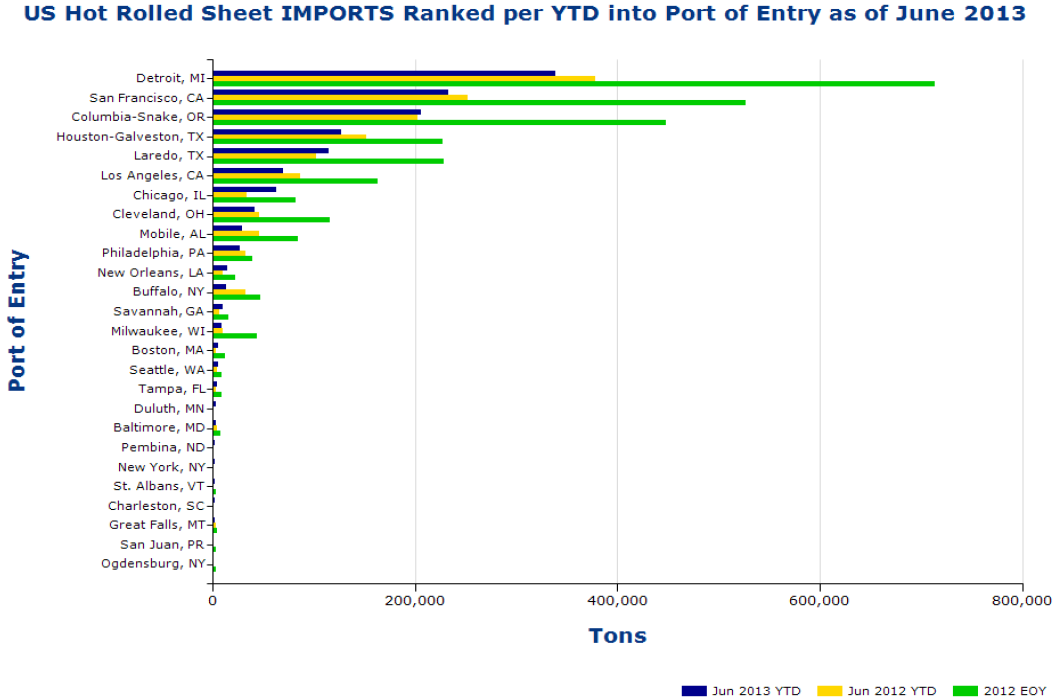
Volume YTD by source and by district of entry are shown graphically in Figures 1 and 2. The green bars indicate the final 2012 tonnage in each case. Countries and ports are ranked by the 2013 YTD tonnage. Figure 1 shows that tonnage from Canada, Korea and the Netherlands is down this year as tonnage from Mexico and Australia has increased. Figure 2 shows the tonnage by port. Detroit, San Francisco and Houston are down this year, the Columbia Snake is about even and tonnage into Laredo and Chicago has increased.


