

Prices

September 12, 2013
Cold Rolled Imports by Port & Country of Origin
Written by Peter Wright
This is one of an expanded series of analyses, exclusive to Steel Market Update that is designed to provide a much more comprehensive view of actual flat rolled steel imports by product, volume, port of arrival and country of origin. This series of reports includes hot rolled, cold rolled, hot dipped galvanized (HDG) and other metallic coated, (mainly Galvalume). We will publish these in the same format in four consecutive issues of the Steel Market Update. All volumes are in short tons. In Tables 1 and 2 the smaller volume sources have been removed to make the tables more readable however, the totals are correct.
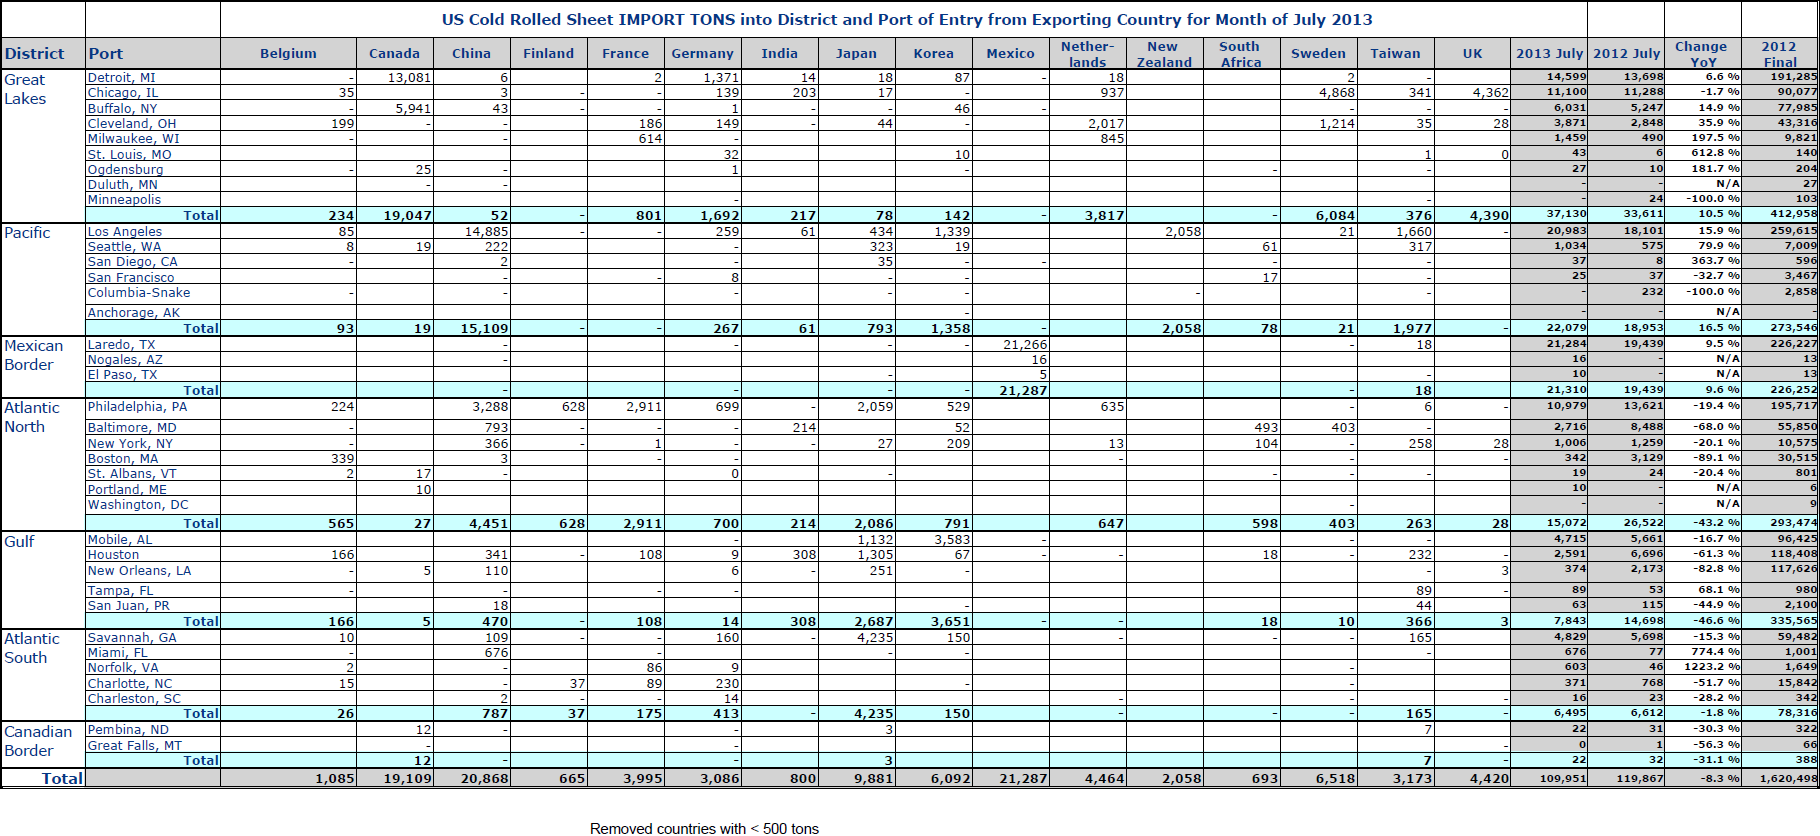
Total CR sheet tonnage in July was 109,951, down from 113,496 tons in June and, down 8.3 percent from July last year. Table 1 shows the detail by port of entry and country of origin for the July tonnage. The Great Lakes region received the most tonnage at, 37,130 with 14,599 tons into Detroit and 11,100 tons into Chicago. The Pacific Coast and Mexican border were a close 2nd and 3rd with 22,079 and 21,310 tons respectively.
Compared to July last year there were declines of 43.2 percent and 46.6 percent into the Atlantic North and Gulf Coast respectively. China and Canada were the 1st and 2nd sources with 20,868 and 19,109 tons respectively. Most of the Chinese tonnage, 14,885 entered through Los Angeles. Of the Canadian tonnage, 13,081 entered through Detroit and 5,941 through Buffalo.
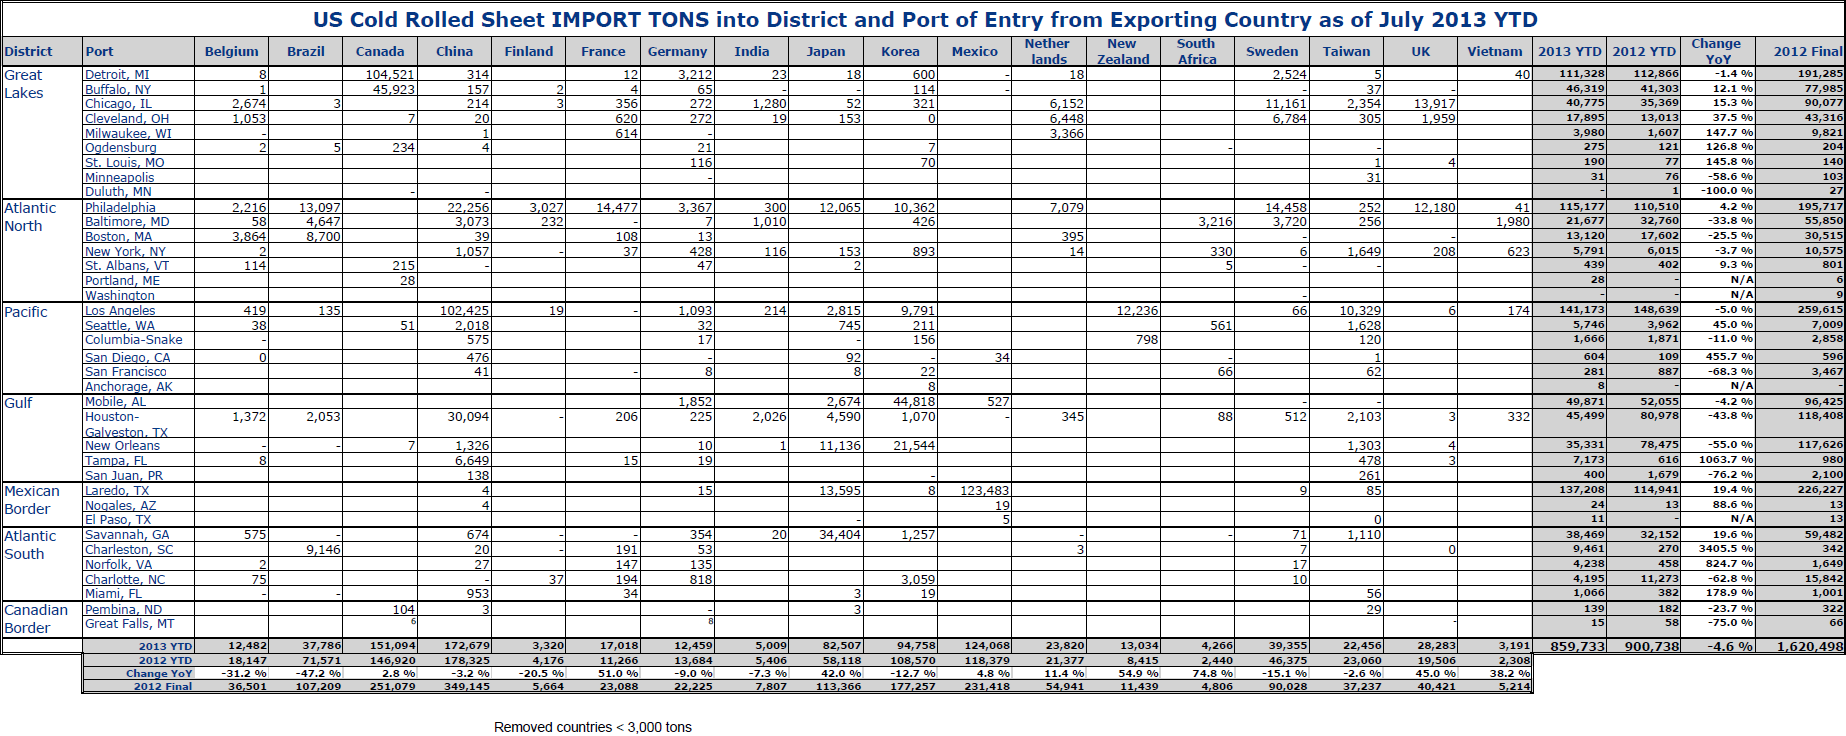
Tables 1 and 2 are much too comprehensive for a detailed description. If you are a buyer and want to know what came into the ports closest to you and what the sources were then this information can be read directly from the tables we have provided.
In 2013 YTD through July, 854,733 tons of cold rolled sheet has entered the US, down from 900,738 tons in the first seven months of 2012 or 4.6 percent. Four ports have been dominant in 2013; these are Detroit with 111,328 tons, Philadelphia with 115,177 tons, Los Angeles with 141,173 tons and Laredo with 137,208 tons. In the first seven months China was the largest source with 172,679 tons mostly into Los Angeles, followed by Canada with 151,094 mostly into Detroit and Buffalo and Mexico with 124,068 tons almost all through Laredo. Imports from Japan are up by 42 percent in 2013 to 82,507 tons backed by the depreciated Yen.
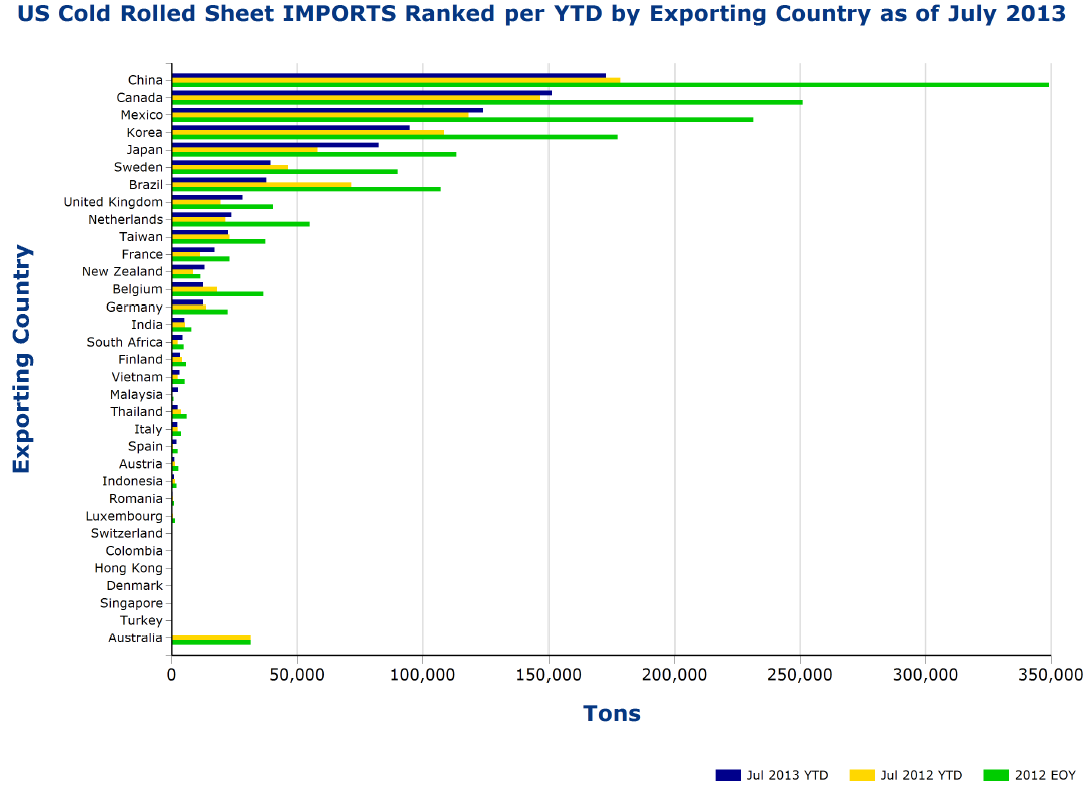
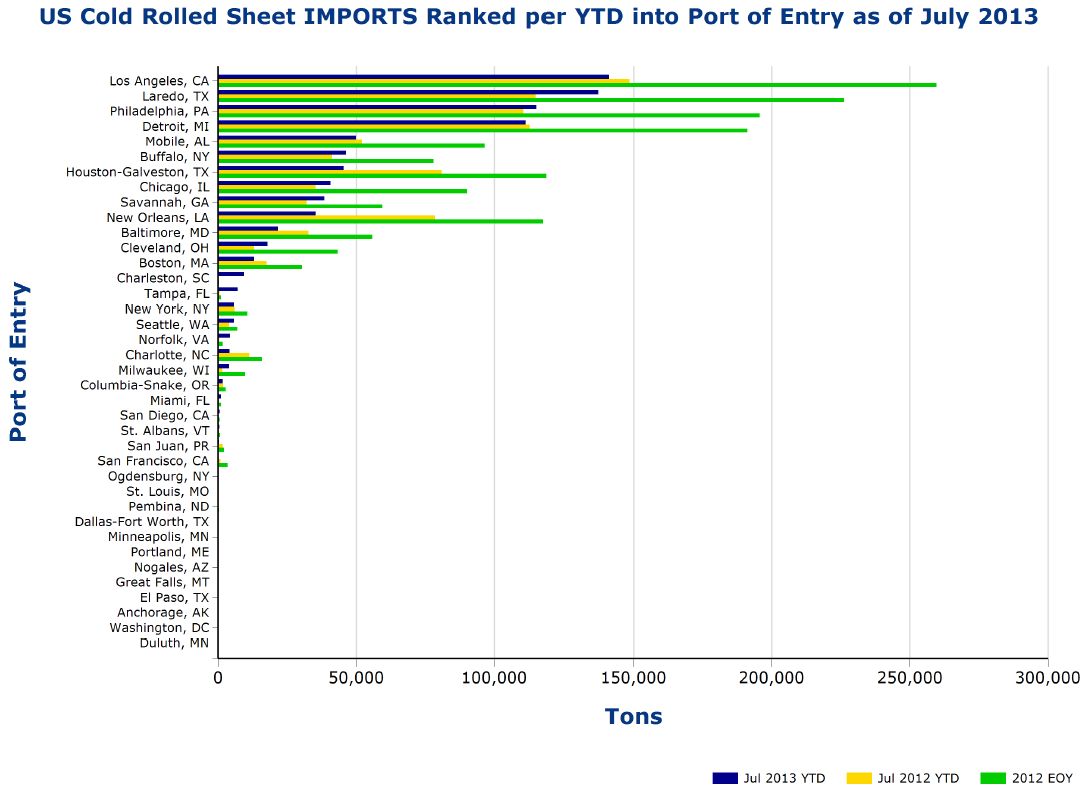
Volume YTD by source and by district of entry are shown graphically in Figures 1 and 2. The green bars indicate the final 2012 tonnage in each case. Countries and ports are ranked by the 2013 YTD tonnage. Figure 1 shows that significant source changes this year are that Korea and Brazil have declined as Japan and the UK have increased. Figure 2 shows that significant changes in port of entry this year are that Laredo has increased its volume as Houston, New Orleans and Baltimore have declined.


