

Prices

September 15, 2013
Galvanized Imports by Port & Country of Origin
Written by Peter Wright
Hot dipped galvanized imports July and YTD 2013 by source and port of entry: This is one of an expanded series of analyses, exclusive to the Steel Market Update that is designed to provide a much more comprehensive view of actual volume by product. This will enable a steel buyer or manager to see exactly what came into his immediate vicinity and where it came from. This series of reports includes hot rolled, cold rolled, HDG and other metallic coated, (mainly Galvalume). We will publish these in the same format in four consecutive issues of the Steel Market Update. All volumes are in short tons.
In tables 1 and 2 the smaller volume sources and ports of entry have been removed to make the tables more readable.
Total HDG import tonnage in July was 130,750 up by 9.4 percent from June’s volume of 119,475 tons but down by 24.5 percent from July last year. Table 1 shows the detail by port of entry and country of origin. Over half of the July HDG tonnage came in through the Great Lakes ports. The Gulf ports received 29,874 tons making them a distant second. Canada was by far the largest source with over half the total, China was second with 18,217 tons followed by Korea with 11,906 tons. The Chinese tonnage mainly entered through Los Angeles and Houston with most of the Korean tonnage entering through Mobile (SMU note: We assume the Mobile Korean tonnage is going to Kia/Hyundai). See Table 2 here.
Tables 1 and 2 are much too comprehensive for a detailed description but steel buyers can keep their suppliers honest by the judicious use of this data.
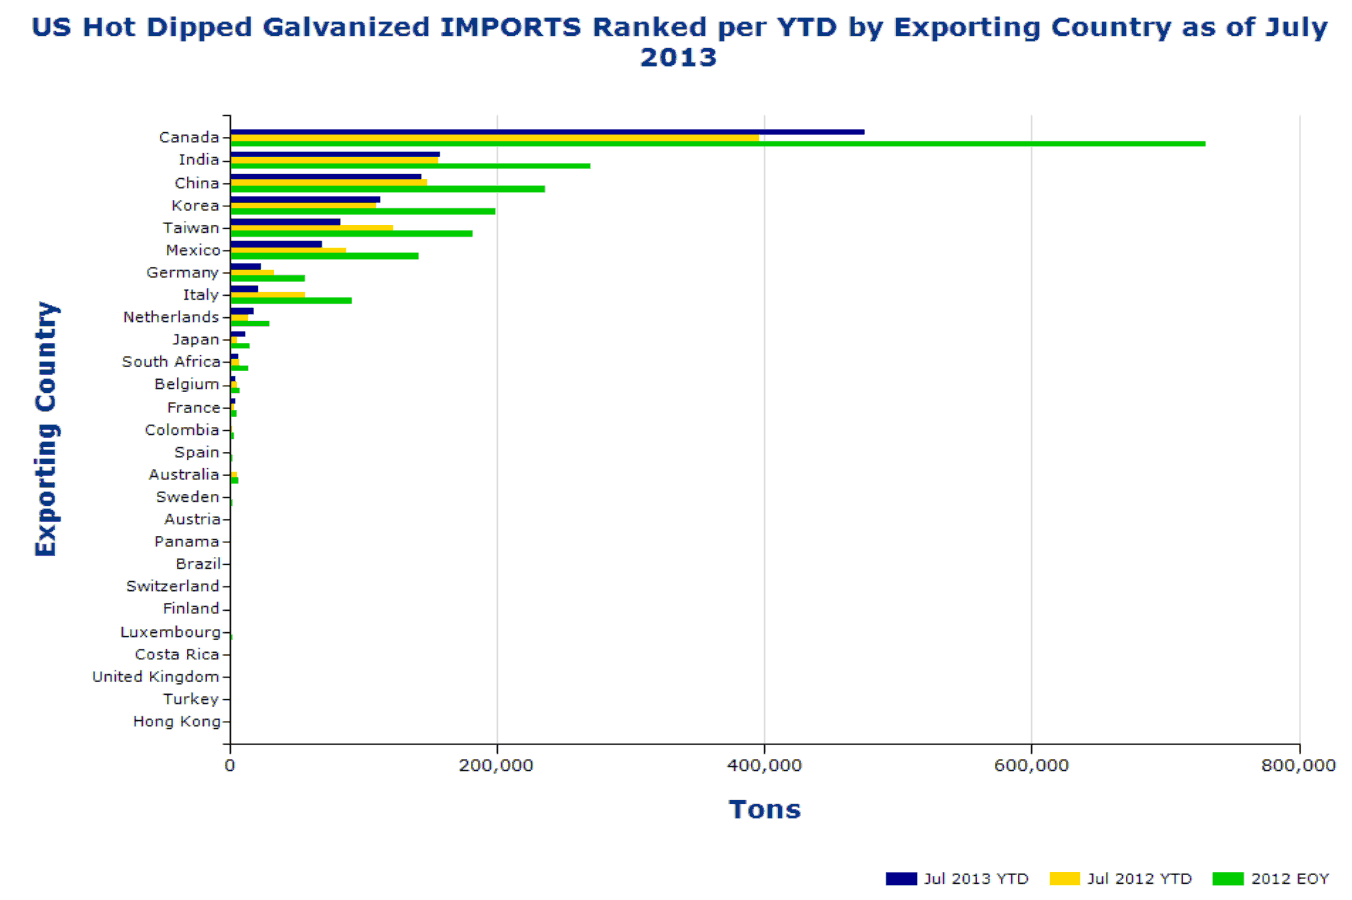
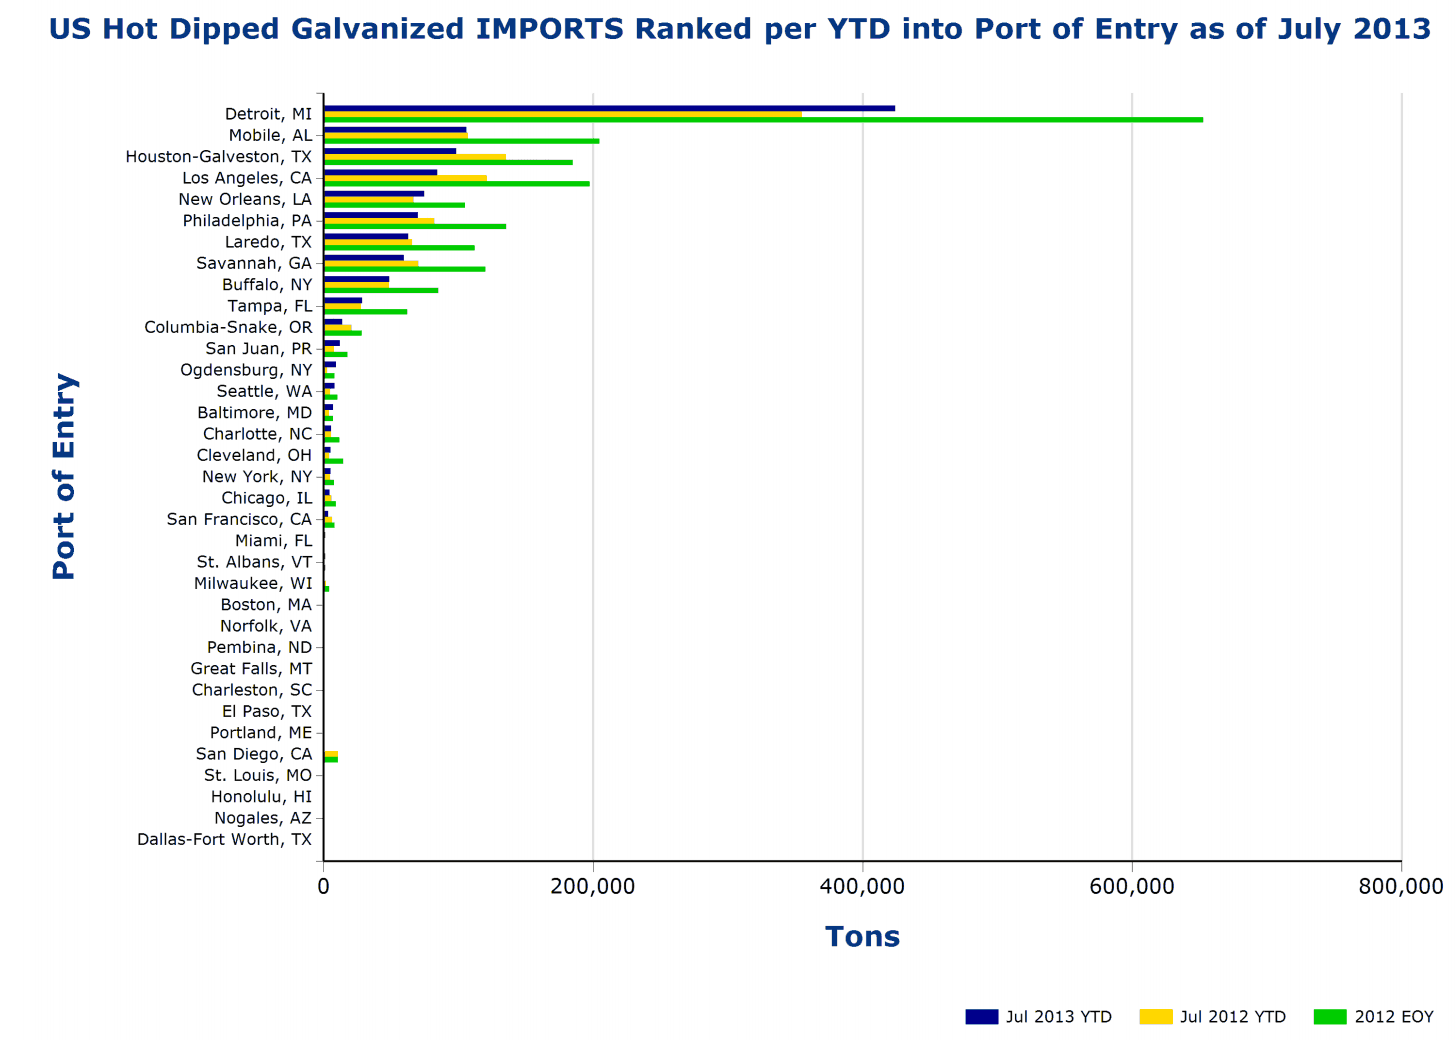
In 2013 YTD through July 1,139,024 tons entered the US, down by 1.9 percent from the same period in 2012. Detroit continues to be far the highest volume port and an increase of 19.6 percent from 2012 through July. Mobile has the second highest volume with 105,991 tons, down 1.2 percent from last year. Canada at 475,366 tons was up by 19.7 percent compared to 2012 through June. India was a distant second at 157,616 tons followed by China at 143,650 tons.
Most of the Canadian tonnage entered through Detroit, India had four main ports of entry, Houston, New Orleans, Philadelphia and Savannah. Most of China’s tons came in through Los Angeles and Houston. Table 2 gives detail of tons by port of entry for 2013 through July.
Volume YTD by source and by district of entry are shown graphically in Figures 1 and 2. The green bars indicate the final 2012 tonnage in each case. Countries and ports are ranked by the 2013 YTD tonnage. Figure 1 shows that tonnage from Canada is up compared to last year as Taiwan, Mexico, Germany and Italy are all down. Figure 2 shows the tonnage by port. Detroit and New Orleans are up this year as Houston, Los Angeles and Savannah have seen a decreased tonnage.


