

Market Data

October 11, 2013
Currency Update
Written by Peter Wright
The Federal Reserve publishes a trade weighted index of the value of the US$ (dollar) against a basket of the currencies of our major trading partners on a daily and monthly basis. As a result of the government shut-down we don’t have the very latest data for this index. The latest data we do have shows that the Broad index appreciated strongly in the 3rd Q of 2011 and since then have been more stable than at any time since 1993/1994.
However data is available for individual currencies from trading houses on a daily basis. The one we use is Oanda and Table 1 shows the change in value of 16 individual steel trading nation’s currencies over the last year, three months, and one month and seven days. Red numbers indicate that the currency is declining against the US dollar.
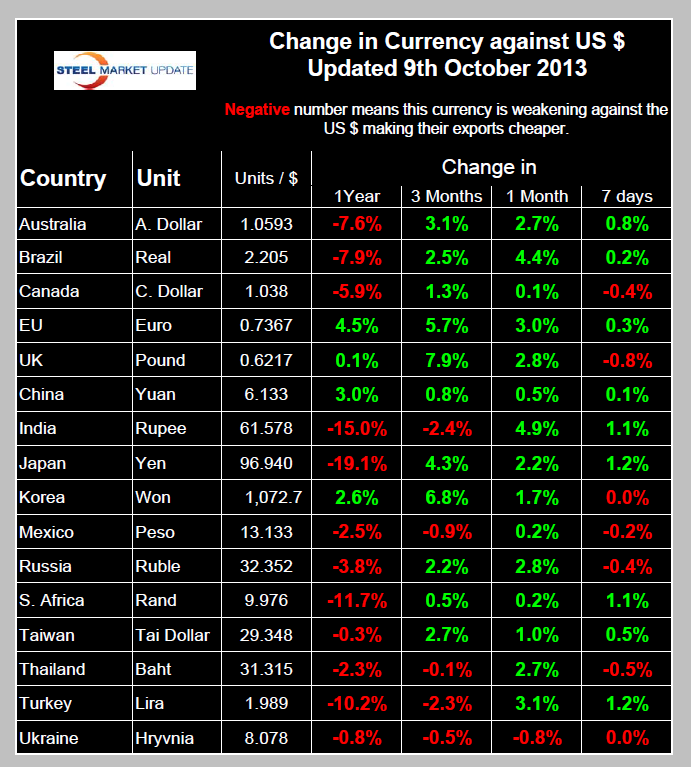
In the last year, the currencies of India, Japan, South Africa and Turkey have all declined by more than 10 percent against the US $ and in that time period 12 of the 16 steel trading currencies have declined against the US $.
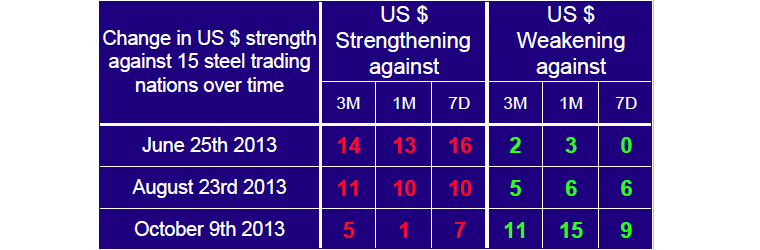
Steel Market Update first began our currency analysis in June and it became immediately apparent when we looked at October that there had been an enormous shift in these 16 currencies that was not being picked up by the broad index. In order to try to visualize this shift in a macro way we have developed Table 2 for the first time this month. Comparing the change in currency values in the one month before the June report with the one month before this October report shows that in June the US $ strengthened against 13 of the 16 currencies, in October it weakened against 15 of the 16. This means that the US is less desirable as an export destination and that this factor will tend to depress imports and support exports thus moving net steel trade in a positive direction.
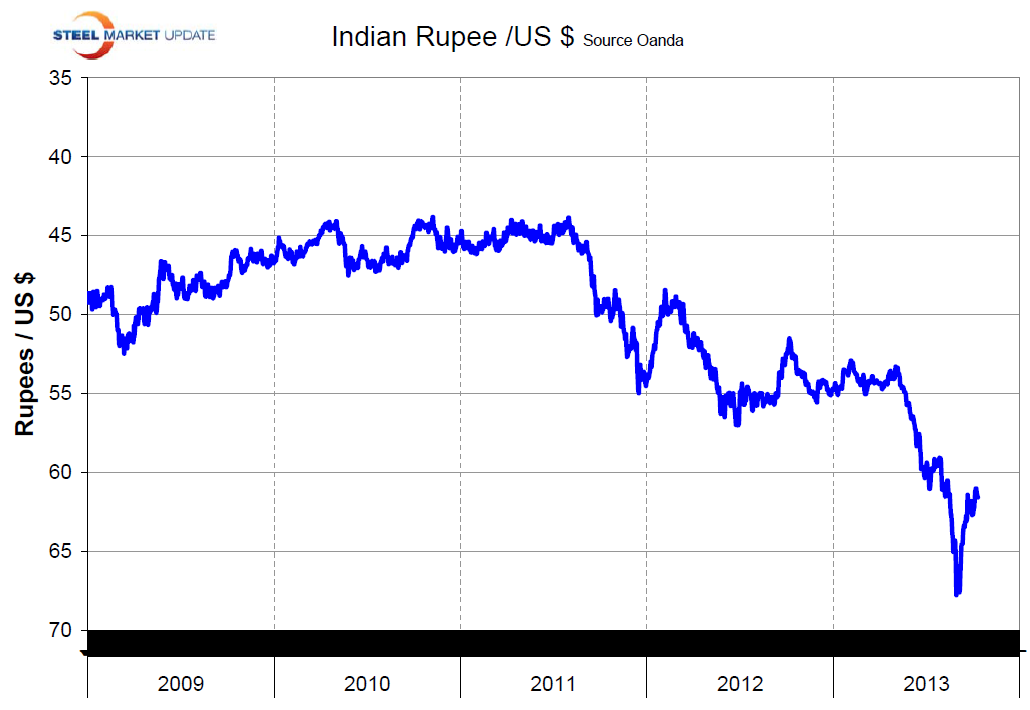
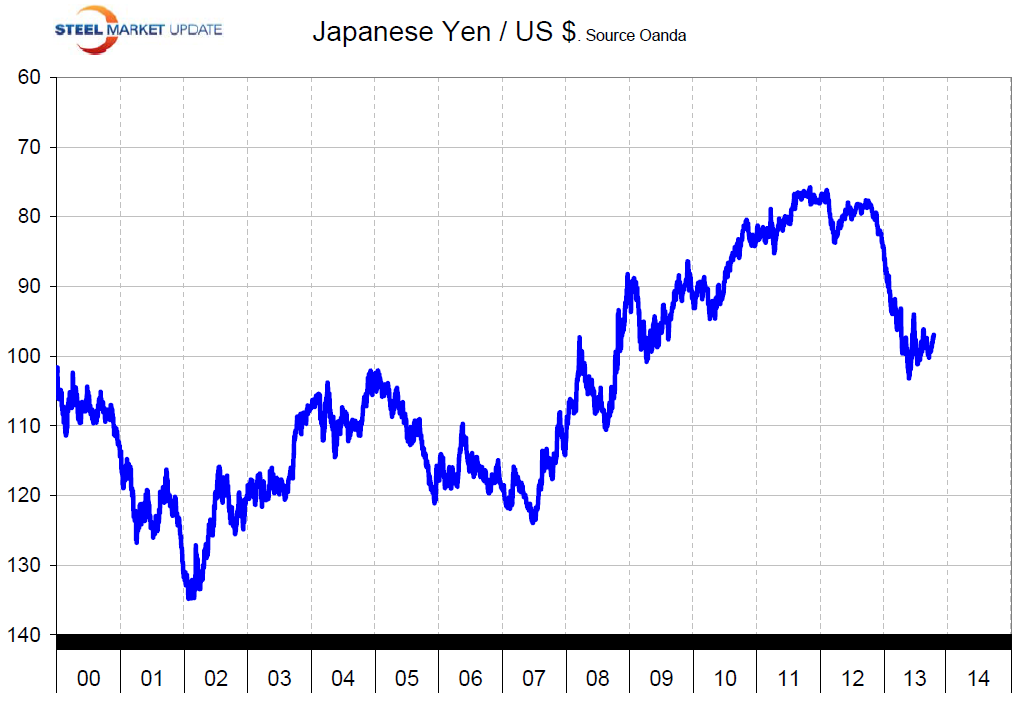
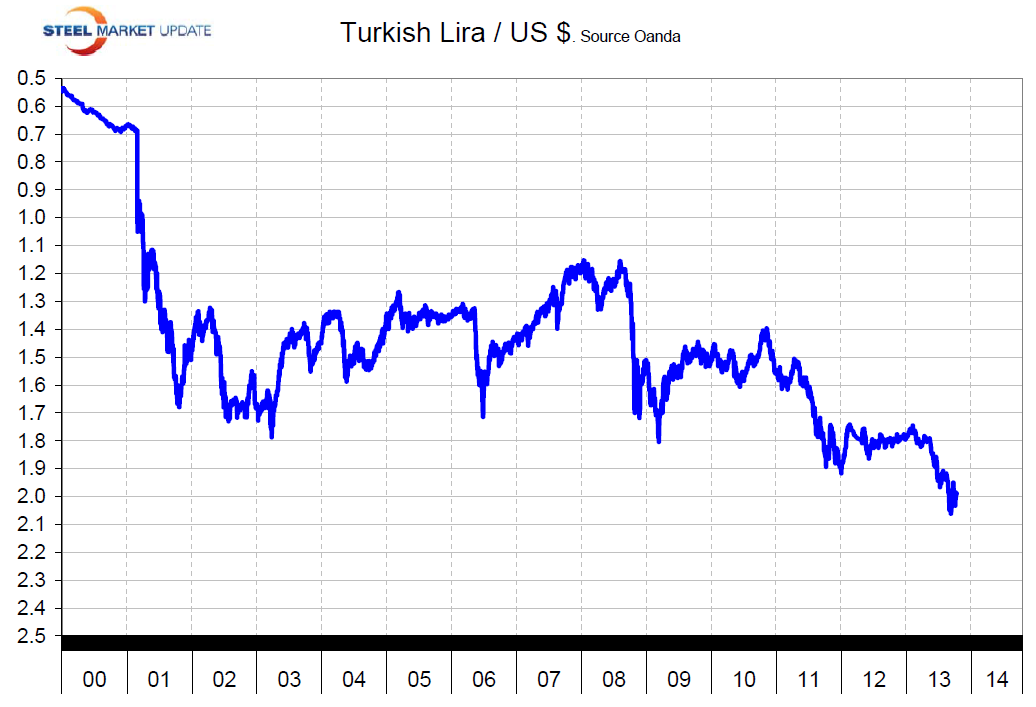
The most significant changes in recent months have been to the Indian Rupee, the Japanese Yen and the Turkish Lira. On May 6th this year the Rupee was 53.4 to the $, by September 4th it had fallen to 67.6 to the $ and it has now recovered to 61.6, Figure 1. On September 28th last year the yen was at 77.7 to the $, by May 20th it had fallen to 103.2 and it has now recovered to 96.9, Figure 2. The Turkish Lira was stable in 2012 with rate of 1.74 to the $ on February 4th this year. It has since fallen to 1.99 with no sign of a turnaround, Figure 3.
Most US steel exports are destined for our NAFTA partners, the US $ has strengthened against both the Canadian $ and the Mexican Peso this year. On January 1st the Canadian $ was at parity, today it takes 1.037 C$ to buy one US $. On April 13th the peso was at 12.057 to the $, today it is at 13.13.


