Market Data

May 14, 2015
Shipments and Supply of Sheet Products through March 2015
Written by Peter Wright
The piece below was published to our Premium level members earlier this week, but we would like to share it with our Executive level members as an example of what our Premium members have access to. This report goes into much more depth than our Apparent Steel Supply article published last Thursday. If you are interested in trialing our Premium product or upgrading your account, please contact us at info@SteelMarketUpdate.com or call 800-432-3475 and we will be happy to assist you.
This report compares domestic mill shipments and total supply to the market to enable a side by side comparison and the degree to which imports have absorbed demand. Sources are the American Iron and Steel Institute and the Department of Commerce with analysis by SMU. Table 1 shows both supply and mill shipments of sheet products (shipments includes exports) side by side as a three month average for the periods January through March for both 2014 and 2015. Comparing these two periods, total supply to the market was down by 1.0 percent but shipments were down by 6.4 percent. In other words, imports took share from the domestic mills.
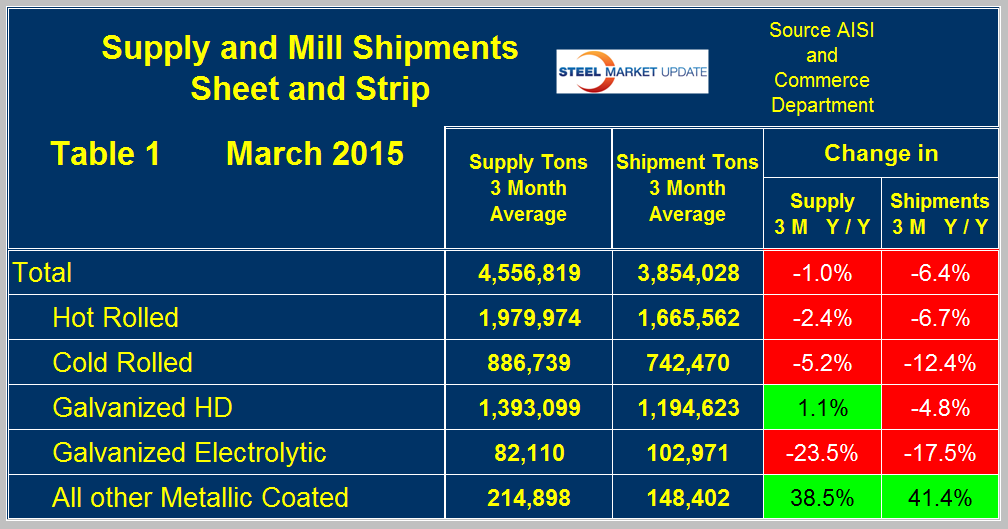
Table 1 breaks down the total into the individual sheet products. The very strong supply and shipment results for other metallic coated products (mainly Galvalume) was driven by an extremely strong January in which both imports and domestic mill shipments were double the volume of both December and February. Domestic cold rolled once again came under the most pressure in three months through March with negative 5.2 percent supply growth and negative 12.4 percent shipment growth, both year over year. At first glance the numbers for electro-galvanized look strange with supply being less than shipments. This is because EG still has a positive trade balance where exports exceed imports. Both supply and shipments of EG are down significantly from the same period a year ago. A review of supply and shipments separately for individual sheet products is given below.
Apparent Supply is a proxy for market demand and is defined as domestic mill shipments to domestic locations plus imports. In the three months January through March 2015 average monthly supply of sheet and strip was 4,556,819 tons, down by 8.5 percent from the previous three month period, October through December 2014 and down by 1.0 percent from the same period last year. Table 2 shows the change in supply by product on this basis plus YTD through March. The big 3, HR, CR and HDG, all declined in Q1 2015 compared to Q4 2014. Galvanized electrolytic and Galvalume both strengthened.
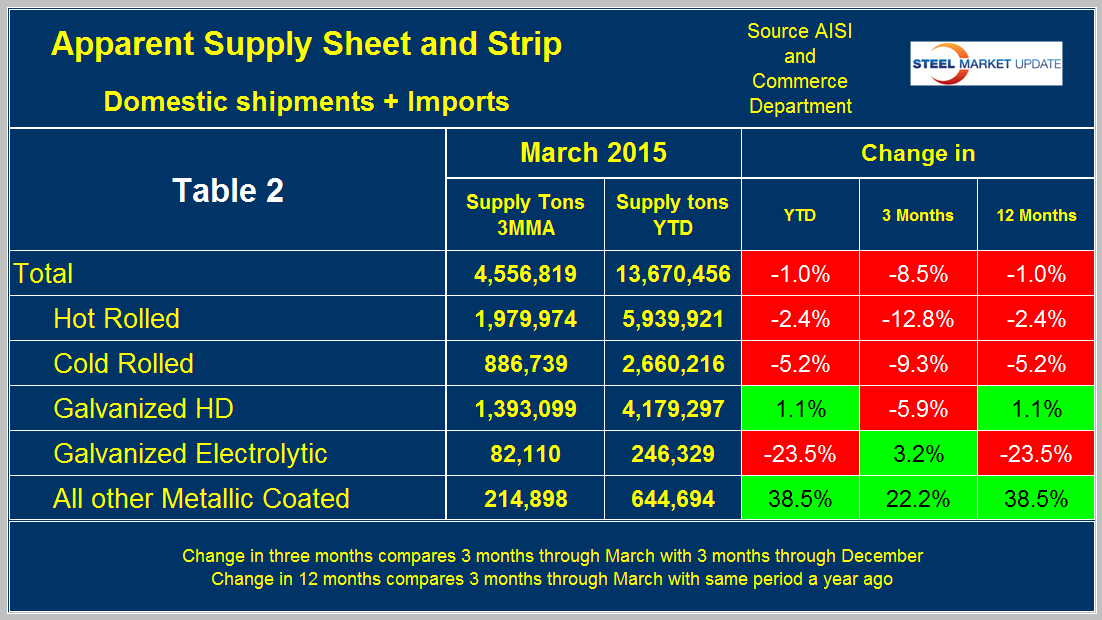
Figure 1 shows the long term supply picture for the three major sheet and strip products, HR, CR and HDG since January 2006.
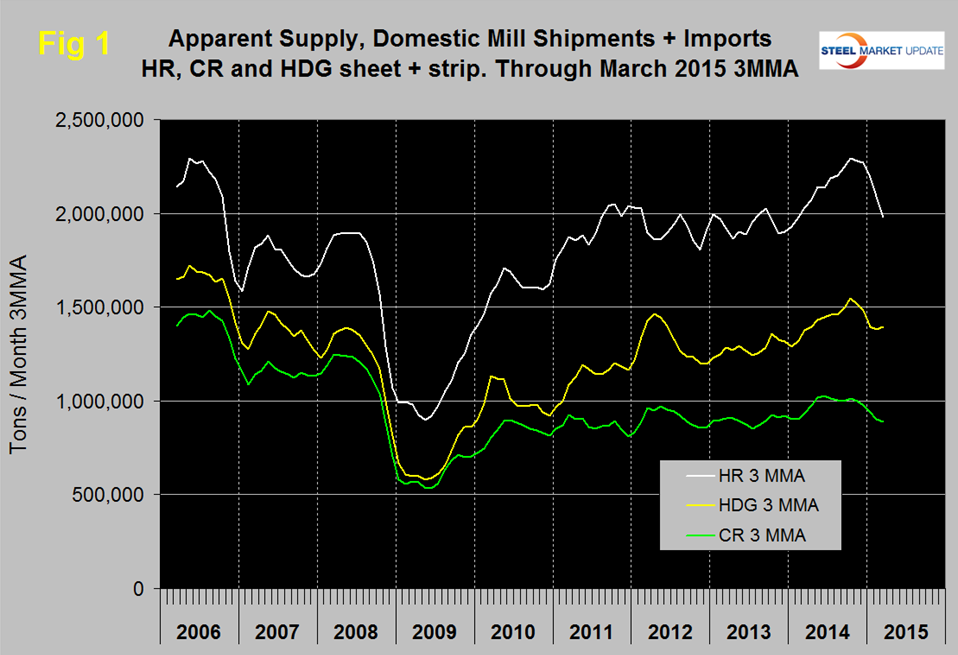
Hot rolled and cold rolled both declined each month in Q1 but hot dipped galvanized picked up slightly in March. In Q4 2014 all three were in higher demand than at any time since the recession, that is no longer the case. Hot band was range bound for 2.5 years until April 2014 when it broke out and advanced through October followed by a small decline in November and December and a more rapid decline this year. Cold rolled supply fell below a million tons to 977,452 tons in December (3MMA) after being above that threshold for six of the previous seven months and continued to decline in January through March. Prior to this recent past the last time cold rolled exceeded a million tons was in October 2008 as we prepared to go over the cliff. Hot dipped galvanized had a strong bump in H1 2012, declined in H2 2012 and steadily improved for 22 months with a small decline in November and December and a more rapid decline in January. The decline slowed in February and reversed slightly in March.
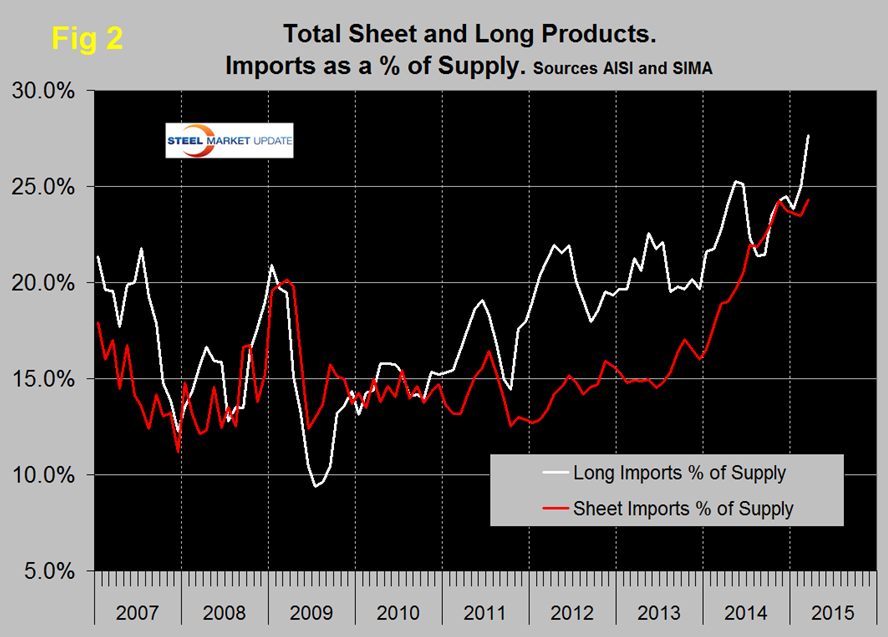
Figure 2 shows import market share of sheet products and includes long products for comparison. Based on a 3MMA the import market share of sheet products was 24.3 percent in March. This share was equal to last November and was the highest since the beginning of the recovery.
Mill Shipments: Table 3 shows that total shipments of sheet and strip products including hot rolled, cold rolled and all coated products were down by 6.4 percent year to date and down by 8.4 percent comparing Q1 2015 with Q4 2014.
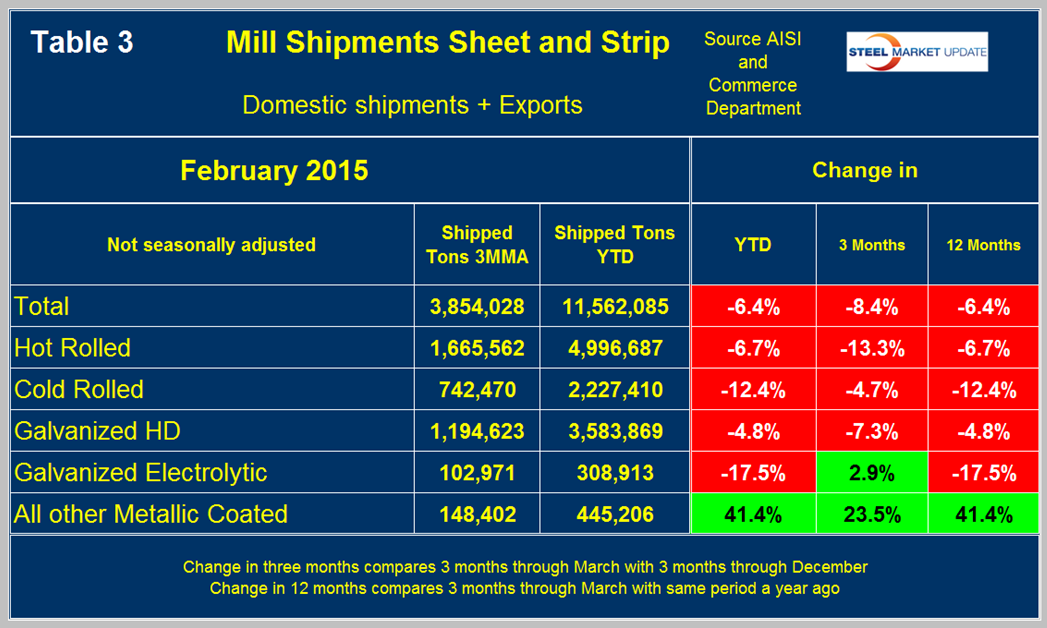
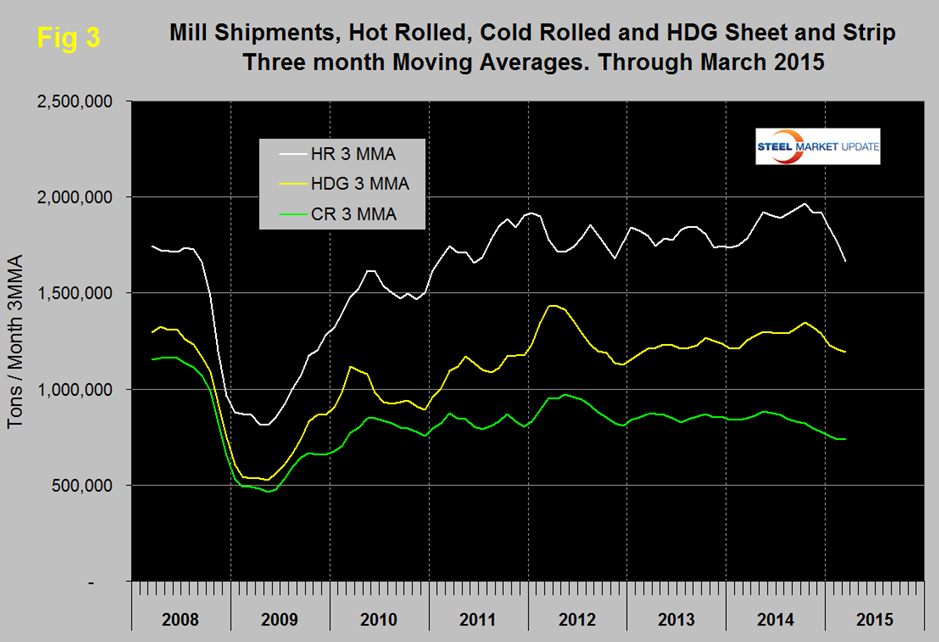
HR, CR and HDG were all down year over year and quarter over quarter. As mentioned above, mill shipments of other metallic coated products had a huge surge in the single month of January with a simultaneous surge in imports. Figure 3 shows the shipment situation by product since January 2008. All three of the major product groups have declined since December.