

Prices

August 12, 2016
SMU Analysis of Imports by Port, Product & Country
Written by Peter Wright
Steel Market Update is reintroducing our monthly analysis of foreign steel imports into the United States by product, port and country. This report will be available to our Premium level members shortly after the U.S. government releases the Final Census data for each month. The data was just released for the month of June. Since we were not able to produce this report for a period of time due to the loss of a data provider, we produced all six months of the new year for our Premium customers.
The SMU monthly import analysis describes the total tonnage by product. It is intended to be a big picture commentary that describes how import volumes are changing and by implication what effect they are having on the macro market. Our normal foreign steel import analysis for our Executive level newsletter does not provide any regional information nor does it tell us the country of origin.
![]() In the future we intend to publish data on our web site that breaks down the tonnage of the four major sheet products into the port of entry and country of origin. This data set is large, therefore we will make no attempt to provide a commentary. Each readers interest will be different and he/she simply needs to select the product they are interested in, find the nearest port or ports of entry to see how much came in each month and where from.
In the future we intend to publish data on our web site that breaks down the tonnage of the four major sheet products into the port of entry and country of origin. This data set is large, therefore we will make no attempt to provide a commentary. Each readers interest will be different and he/she simply needs to select the product they are interested in, find the nearest port or ports of entry to see how much came in each month and where from.
Figure 1 is a small extract from the hot rolled data sheet. It describes the tonnage that has come in through San Francisco each month this year, where it came from and the year-to date (YTD) tonnage. We chose the Port of San Francisco as it is the port receiving material for the USS/POSCO steel mill. As you can see just about all of the tons are coming from Korea (POSCO is a Korean mill and the 50 percent partner on the USS/POSCO steel mill in California).
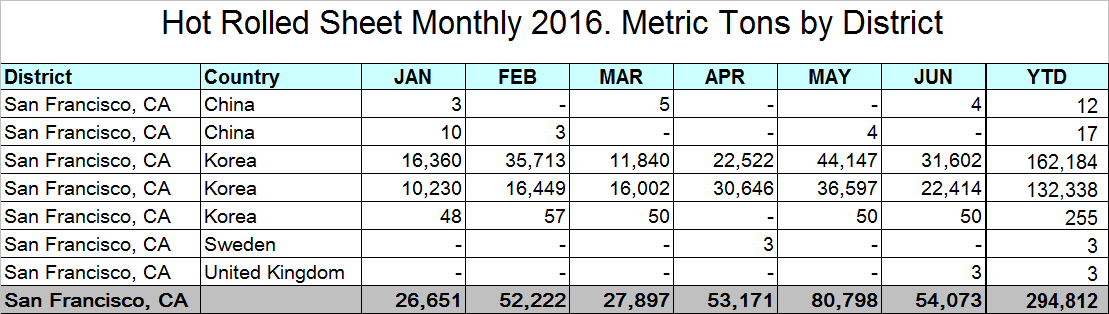
The total volume of hot rolled into San Francisco in the 6 months through June was 294,812 metric tons. Korea accounted for almost all of the tonnage. The data on our web site spells this out for every port of entry around the country for hot rolled, cold rolled, HDG and other metallic coated which is mainly Galvalume.
We believe that misinformation about regional import volumes is often used to influence purchase decisions. Our intent with this analysis is to describe in detail what is going on in a company’s immediate neighborhood and thus provide a negotiating advantage for our premium subscribers.
The data can be accessed here on the Steel Market Update Imports by Product/Port webpage.
If you would like more information about becoming a Premium level subscriber please contact us at 800-432-3475 or by email: info@SteelMarketUpdate.com.


