Prices

January 12, 2017
2016 Foreign Steel Imports Down 14.7% YOY
Written by John Packard
The U.S. Department of Commerce (DOC) has released Final Census numbers on foreign steel imported into the United States through November 2016 and has updated license data for the month of December 2016. This provides us with our first look at imports for the year so we can do a comparison against 2015 to see what trends have changes, especially considering the antidumping (AD) and countervailing duty (CVD) trade cases as well as the circumvention suit against China/Vietnam.
In 2015 total steel imports were 38,739,137 net tons (all products). This year, using license data numbers for December and Final Census numbers for the rest of the year, U.S. imports will be approximately 33,042,000 net tons. Imports are down by 5,696,621 net tons less or 14.7 percent lower in 2016 versus 2015.
We are going to look at the foreign steel import data in two pieces: January-November 2016 where we have the Final Census data (complete numbers) then we will look at December 2016 separately, as the numbers are not final and we can expect some modifications to the numbers when the Final Census numbers come out in a few weeks.
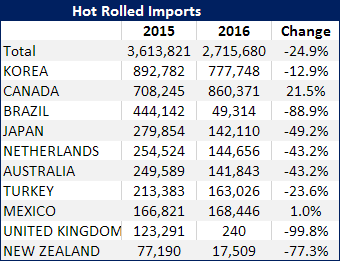
Hot Rolled
For the first 11 months 2016 hot rolled shipments were 24.85 percent below the same period in 2015. We have broken out the top ten HR importing countries and provided the change in percentages from one year to the next. The only countries in the top ten list showing an increase in shipments were Canada and Mexico (NAFTA).
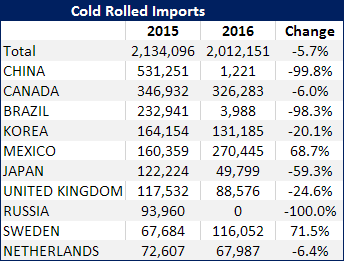
Cold Rolled
Total shipments of cold rolled for the first 11 months 2016 were 2,012,151 net tons down 5.71 percent from the same period in 2015. China (-99.77%), Brazil (-98.29%) and Russia (-100%) were the most impacted countries. The two countries showing growth over the full eleven-month period were Mexico (+68.65%) and Sweden (+71.46%).
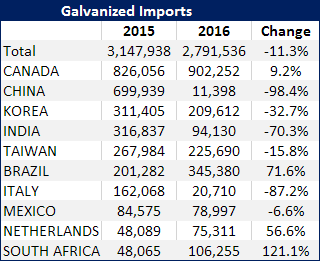
Galvanized
Galvanized shipments totaled 2,791,536 net tons in 2016 which was 11.32 percent below the same period one year earlier. There were four countries which grew GI exports to the U.S. during calendar year 2016: Canada (+9.22%), Brazil (+71.59%), The Netherlands (+56.61%) and South Africa (+121.06%).
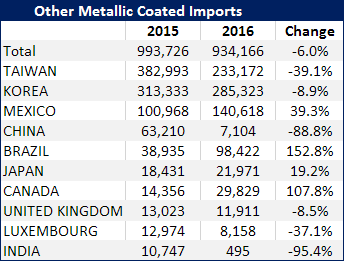
Galvalume (Other Metallic)
Total imports of “other Metallic” (most of which is Galvalume) dropped 5.99 percent during the first 11 months 2016. The biggest changes saw Taiwan (-39.12%), China (-88.76%) and India (-95.40%) losing tonnage with Mexico (+39.27%), Brazil (+152.79%) and Canada seeing the largest growth.
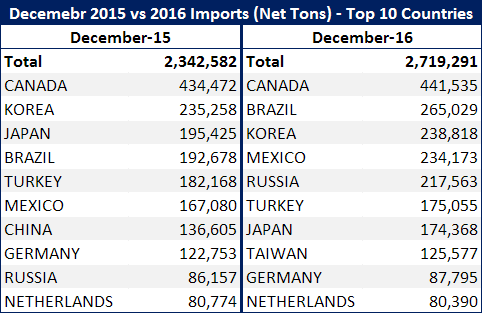
December Tonnage Trending Toward 2.7 Million tons
Based on license data December is trending toward a 2.7 million ton month which is in line with both our 12 month and 2 month moving averages.
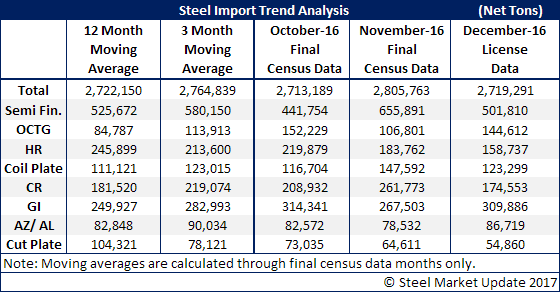
We did the analysis of the top 10 importing countries (all products) for December and to no surprise the NAFTA countries were some of our top suppliers during the month. However, when we looked at the numbers and the year over year change, the market winners are Russia (+152.52%), Brazil (+37.55%) and Mexico (+40.16%).