Market Data

April 19, 2017
SMU Service Center Apparent Inventories Deficit Balloons
Written by John Packard
The following service center inventories data is based on the assumption that the MSCI data as presented is accurate on carbon flat rolled.
From the MSCI data we apply a proprietary formula/model from which we can determine if flat rolled distributors are in an over-inventoried (excess) or under-inventories (deficit) situation. The importance of understanding the balance of inventories is important when looking at when distributors will need to begin buying heavily and what impact that could have on steel prices.
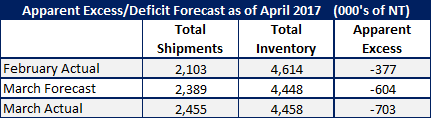
First, let’s take a look at what happened last month and how close our forecast was to what the MSCI says is reality.
For March 2017 we forecast shipments of 2,389,000 tons and actual shipments were 2,455,000 tons (66,000 ton difference).
We also forecast inventories to total 4,448,000 tons at the end of March. According to the MSCI we missed the number by 10,000 tons with the final tally being 4,458,000 tons.
The carbon sheet service centers expanded their “Apparent Inventories Deficit” by 99,000 tons more than our forecast. We forecast distributors would be short inventories by -604,000 tons and our model is showing the actual number as being -703,000 tons. The last time our model had the service center deficit for flat rolled over 700,000 tons was March 2006.
When looking at the recent past the biggest deficit we saw was -633,000 tons in May 2014.
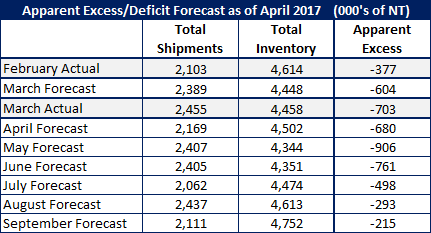
April 2017 Shipment, Inventories & Apparent Excess/Deficit Forecast
Steel Market Update (SMU) is going to continue using the four-year rate of change using the daily rates (as opposed to monthly averages) for each month.
For the month of April our forecast calls for U.S. carbon flat rolled service centers to ship 108,400 tons per day or a total of 2,168,900 tons of sheet products.
We are forecasting April inventories to end the month at 4,502,200 tons which is a slight increase over March.
Once again, assuming the MSCI numbers on carbon flat rolled to be accurate, our Service Center Apparent Inventories Deficit will be down slightly from the March levels. We are forecasting the deficit to be -680,000 tons.
April Through September 2017 Forecast
The following table shows our forecast for both shipments and inventories for the months of April through September 2017.