Prices

November 2, 2017
Hot Rolled Futures Trading Up: Is a Price Breakout Coming???
Written by David Feldstein
The following article on the hot rolled coil (HRC) futures markets was written by David Feldstein. As the Flack Global Metals Director of Risk Management, Dave is an active participant in the hot rolled futures market, and we believe he provides insightful commentary and trading ideas to our readers. Besides writing futures articles for Steel Market Update, Dave produces articles that our readers may find interesting under the heading “The Feldstein” on the Flack Global Metals website, www.FlackGlobalMetals.com. Note that Steel Market Update does not take any positions on HRC or scrap trading and any recommendations made by David Feldstein are his opinions and not those of SMU. We recommend that anyone interested in trading HRC or scrap futures enlist the help of a licensed broker or bank.
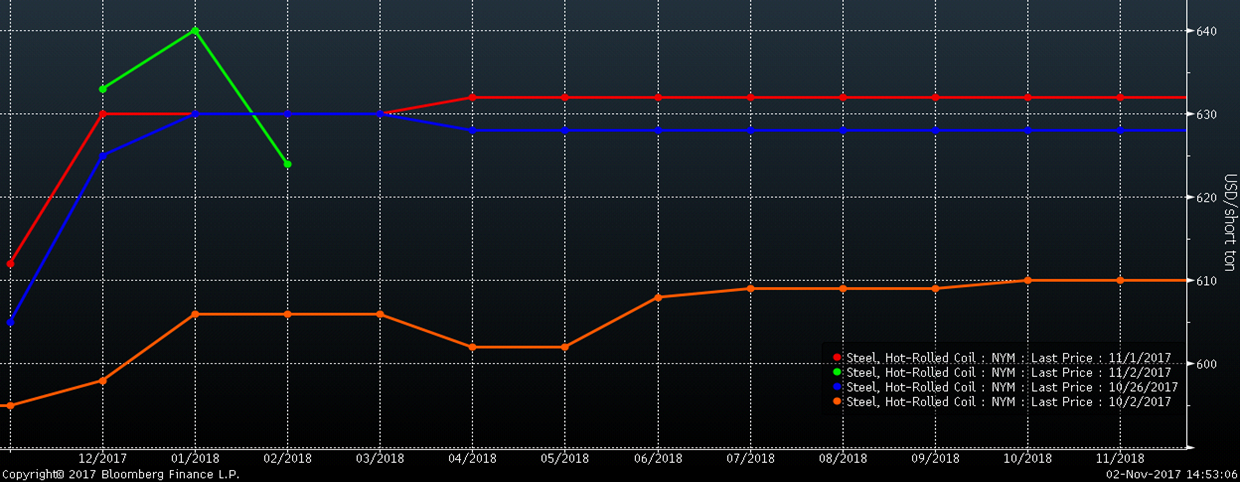
Today, the December CME Midwest HRC future traded 500 st at $630/st and the January future traded 100 st at $640. The futures curve has moved higher following the price increase announcements. Below is the curve through 2018. The back of the curve is up a couple of dollars since last week.
CME Midwest HRC Futures Curve
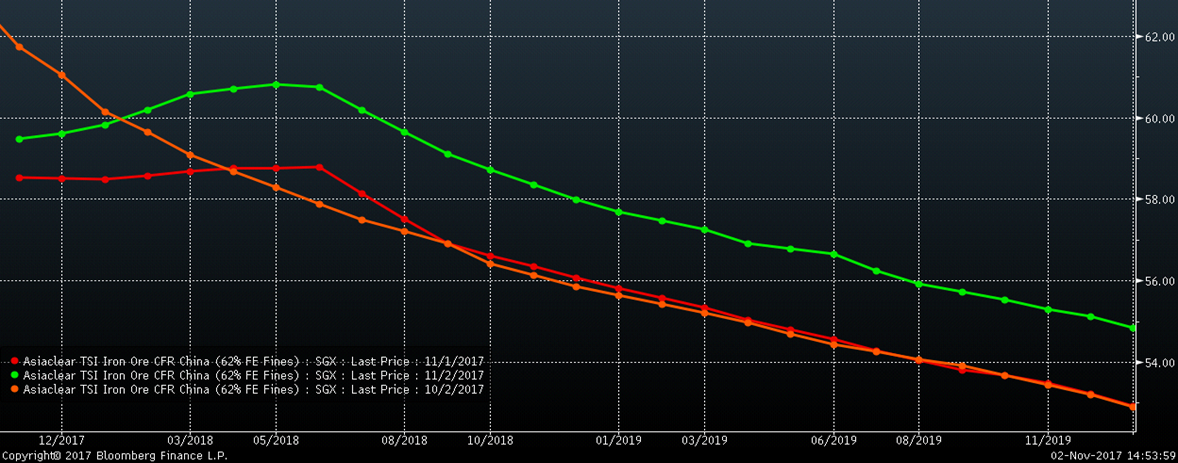
Iron ore futures have rallied about $3/t over the past month, but what is very interesting is that the shape of the curve has shifted from backwardation (downward sloping), to flat, to this weird bump in the front of the curve with the back of the curve still backwardated. Word on the street is buyers that would have normally rolled their positions into Q1 (that is they sell their front month futures and buy the next month out i.e. sell December and buy January) chose to roll those positions further up the curve into Q2 foregoing Q1 purchases, most likely in response to China’s winter production curtailment policy.
SGX Iron Ore Futures Curve
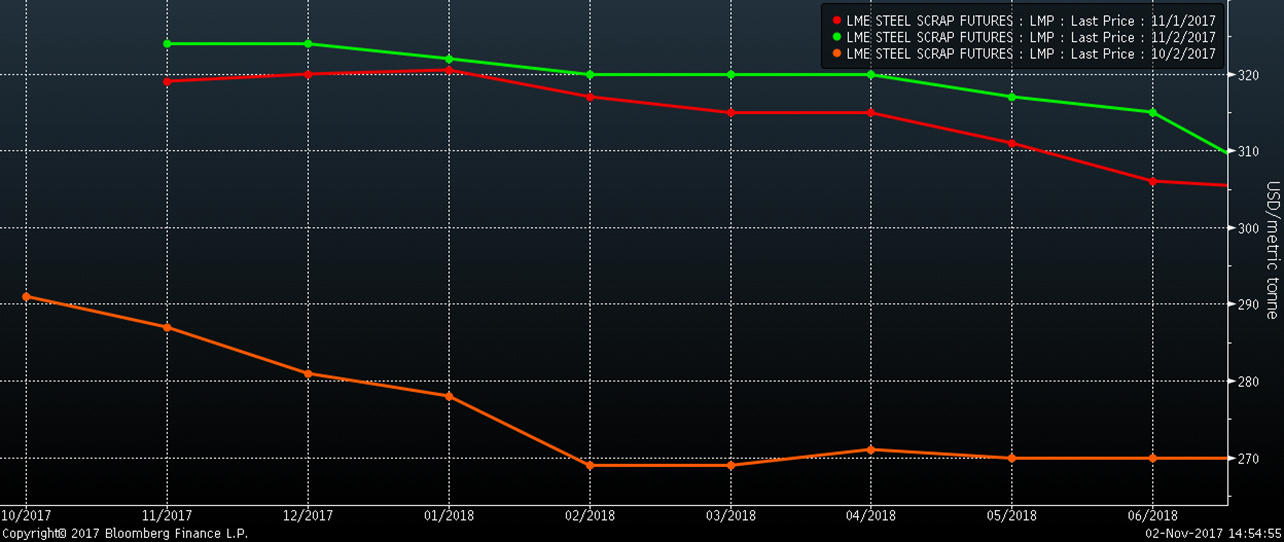
LME Turkish scrap futures have jumped nicely in a month with the December future trading up to $325/t today.
LME Turkish Scrap Futures Curve

In the last couple articles, we’ve been monitoring the development of an “inverse head and shoulders” pattern in the chart of the rolling second month HRC futures. An “inverse head and shoulders” pattern is a bullish breakout pattern. If it develops and then the price breaks through the neck line, it could indicate a big rally to follow.
Here is an example:
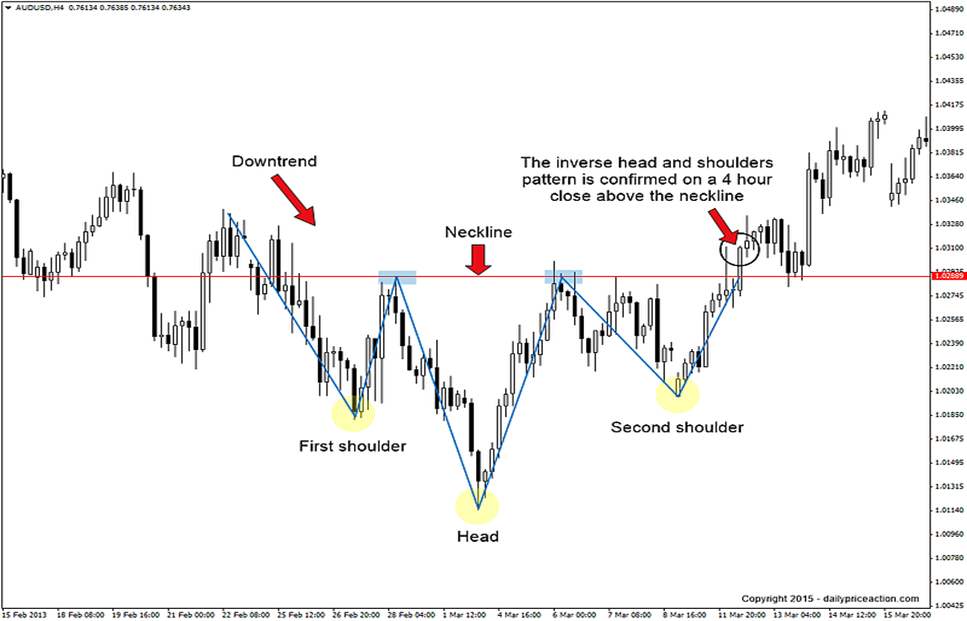
For more info about the pattern, click here.
The pattern in the rolling 2nd month HRC future isn’t the prettiest on record, but then again nobody wants to be home alone on date night.
Here is the chart from last week’s article:
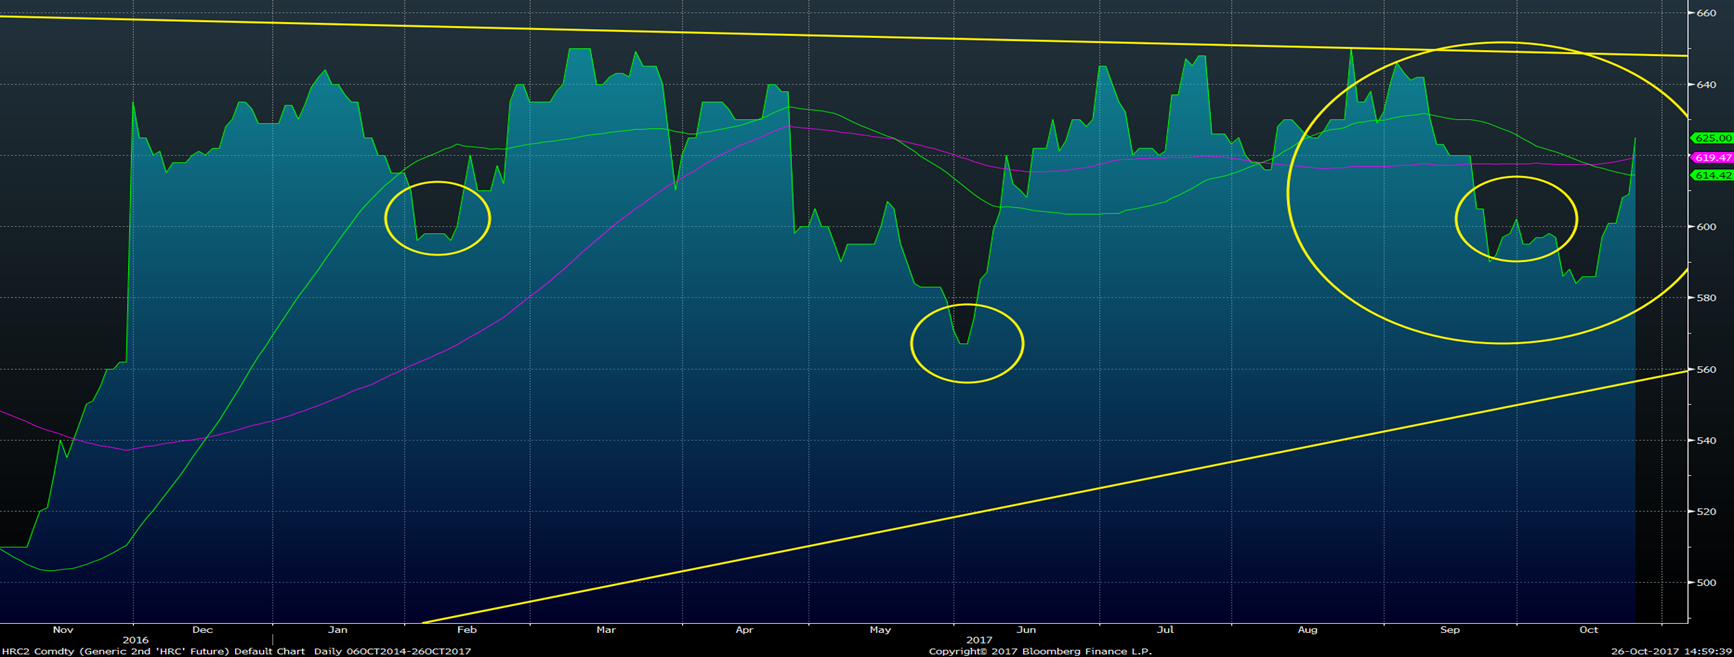
Here is the chart as of this afternoon. As you can see, the right shoulder is almost fully completed and aggressively approaching the “neckline.”
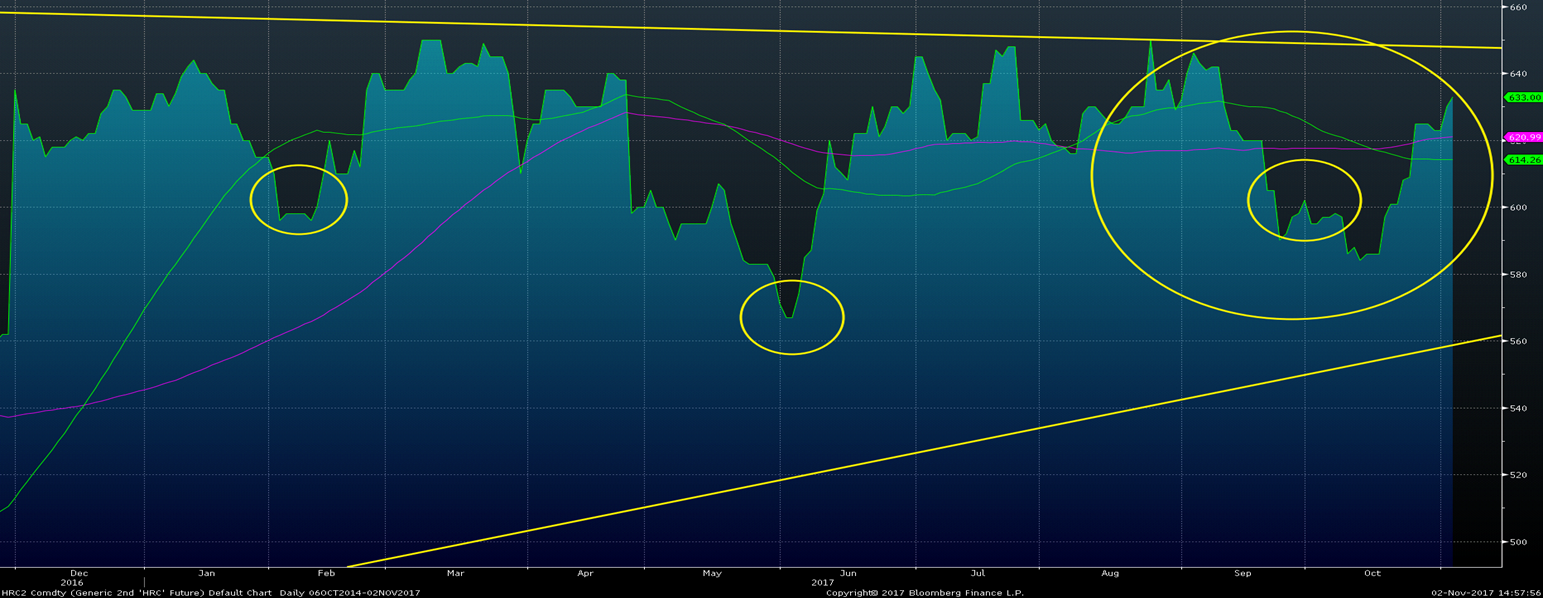
If the HRC price breaks above the $650 “neckline,” this chart pattern indicates a significant rally to follow. And don’t forget what happened with the Death Star. It didn’t look fully completed either and then it blew up an entire planet.

Point being, while I can’t tell you what’s going to happen (that’s only in the SMU Premium Newsletter), I wouldn’t get in front of this thing. You could get blown out!
Folks, the dynamics of 2015 are long gone. We have been in a multi-year bull market that has been consolidating in a range for almost a year. At some point, the price will break out one way or the other, and the bull case is way better than the bear case.
The opportunity might present itself in HRC futures at any time, so pay close attention to President Trump’s tweets, keep your local broker on speed dial and remember Ferrous Bueller’s philosophy…
“Life moves pretty fast. If you don’t stop and take a look around once in a while, you could miss it.”