

Market Data
March 1, 2019
SMU Analysis: Key Market Indicators Weaken in April
Written by Peter Wright
Steel Market Update is sharing this Premium content with Executive-level subscribers in this issue. For more information on upgrading to a Premium-level membership, email info@SteelMarketUpdate.com
Steel Market Update’s analysis of Key Market Indicators shows that U.S. economic trends deteriorated in April to the worst level in 27 months.
This report is designed to be a big picture summary of data that we have reported on in detail during the month. In it, we summarize 36 data streams that critically describe the state of the steel market and provide forward guidance. Import statistics from the USITC are still running about 14 days late, but this report is current as of April 30.
See the end of this piece for an explanation of the Key Indicators concept. This will explain the difference between our view of the present situation, which is subjective, and our analysis of trends, which is based on the latest facts available.
Please refer to Table 1 for our view of the present situation and the quantitative measure of trends. Readers should regard the color codes in the present situation column as a visual summary of the current market condition. The “Trend” columns of Table 1 are also color coded to give a quick visual appreciation of the direction the market is headed. All results are the latest available as of March 31, 2019.
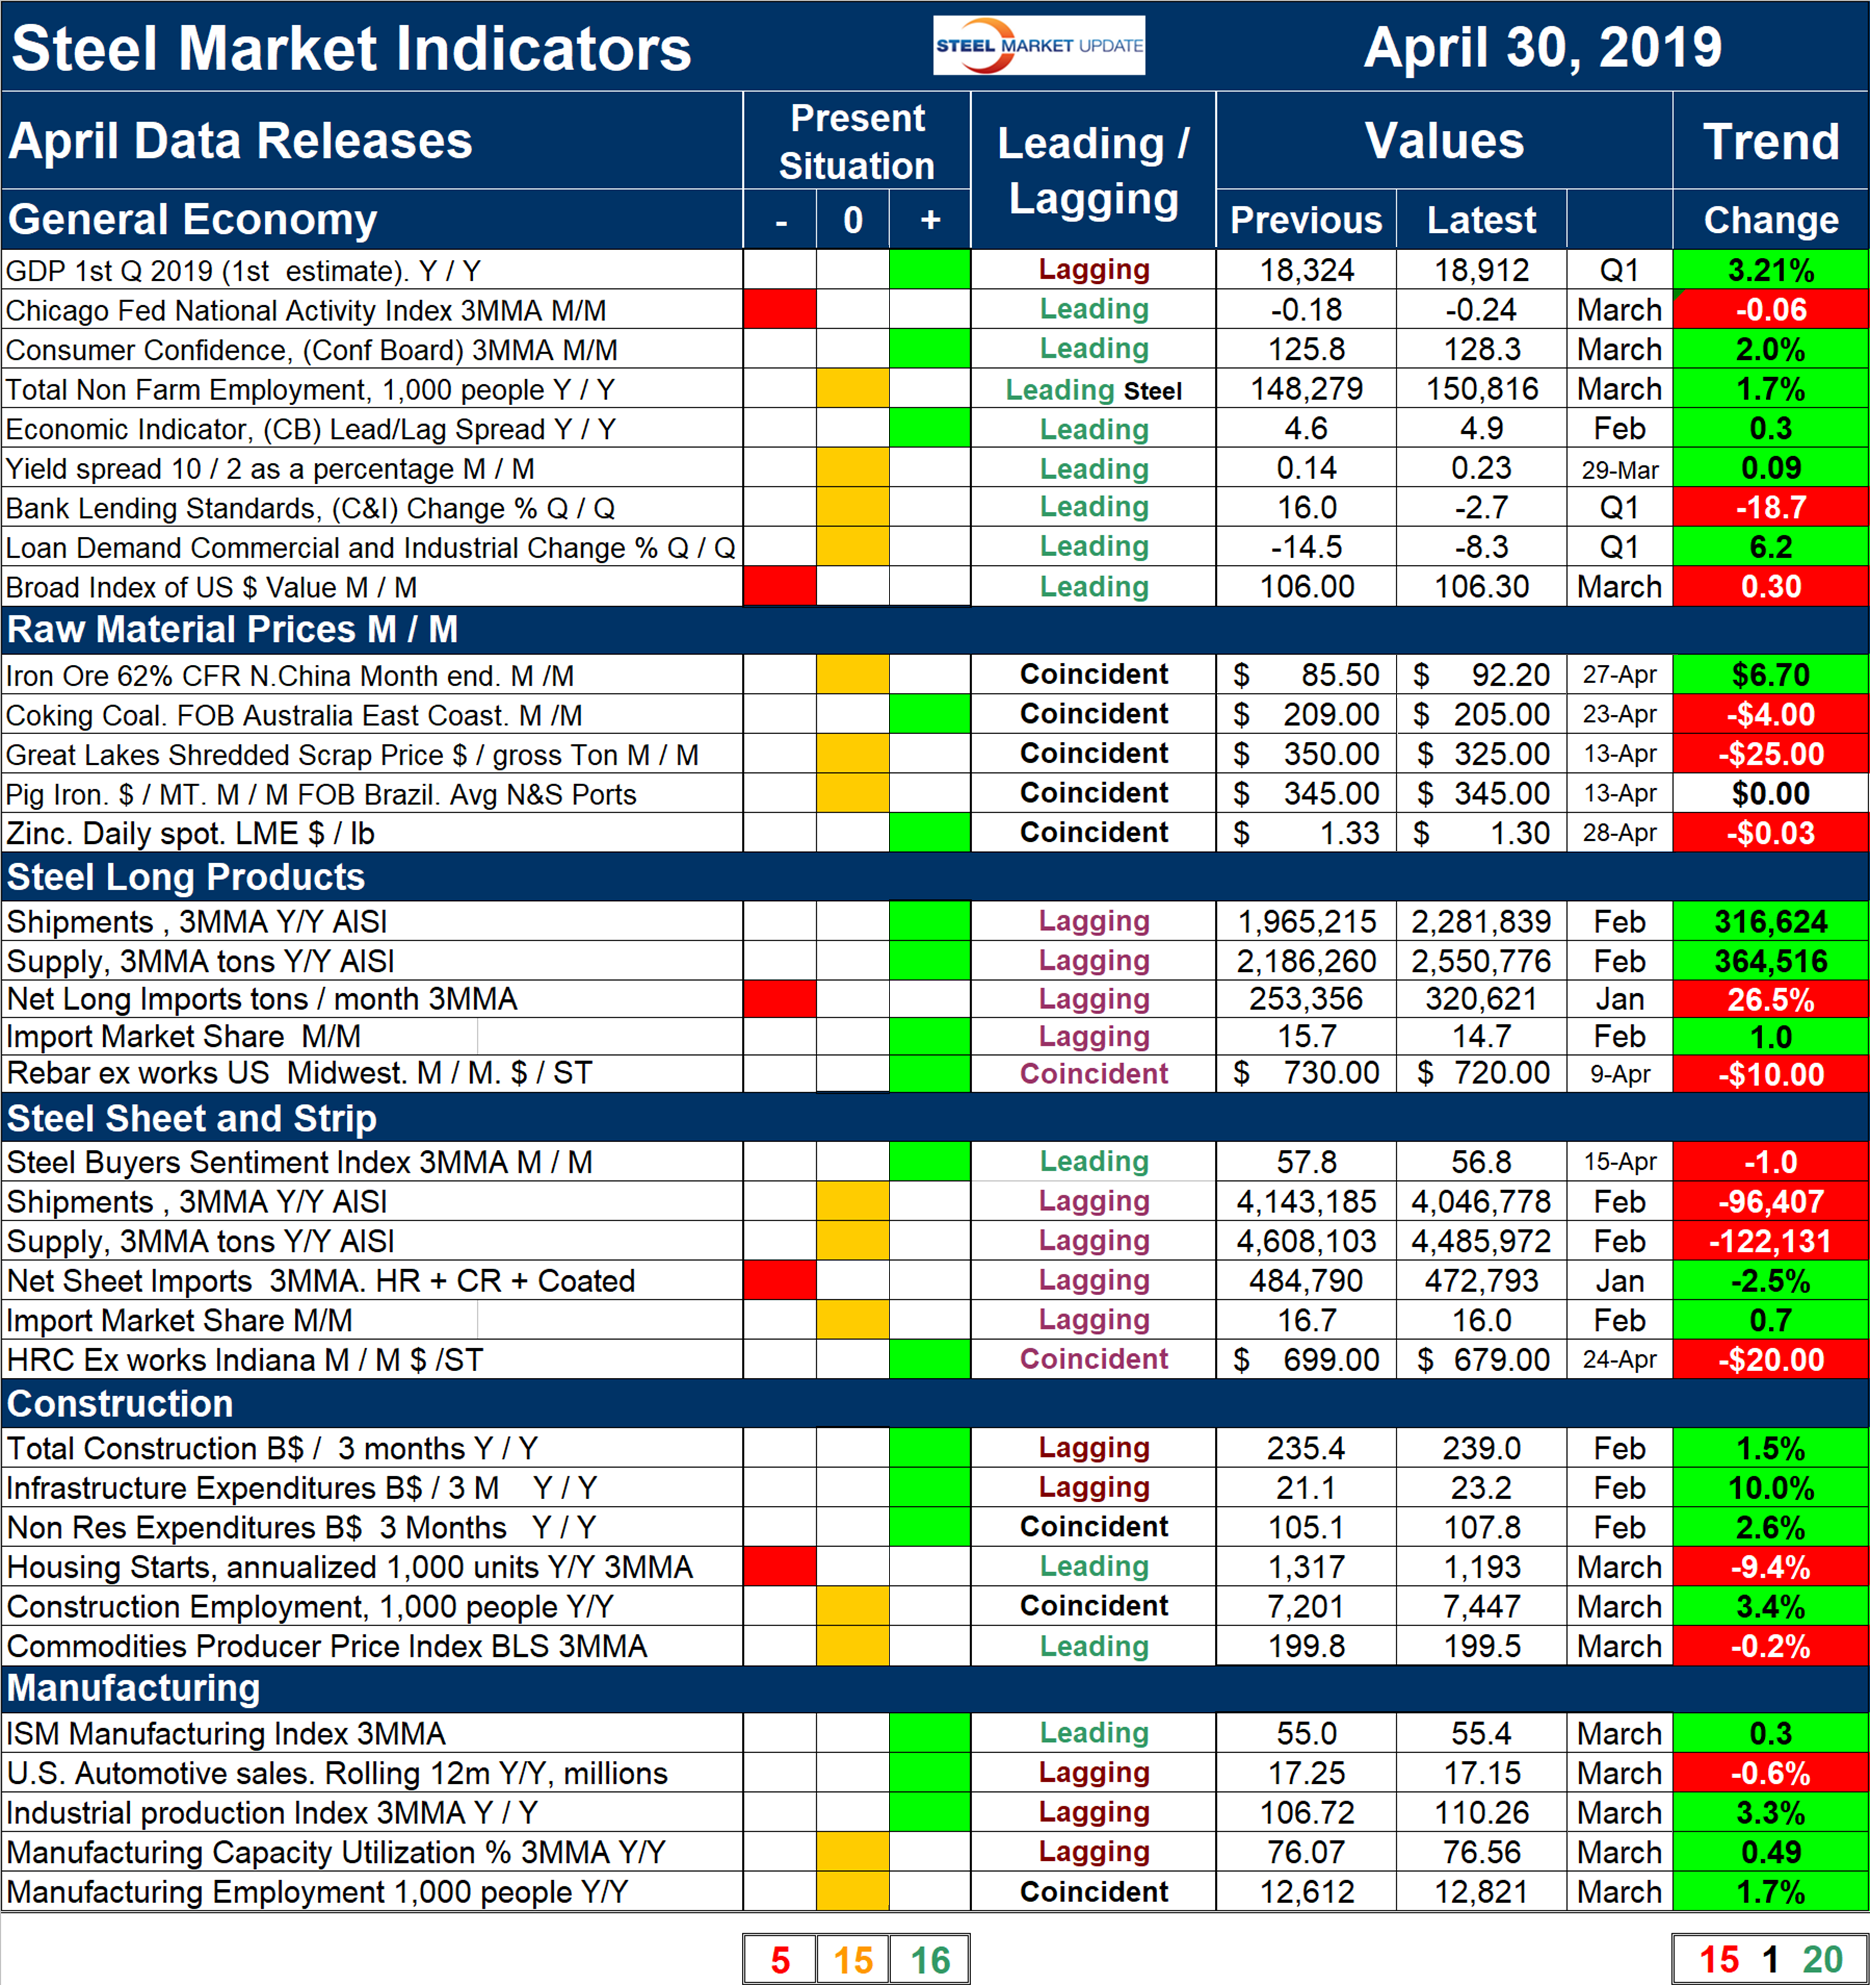
Present Situation
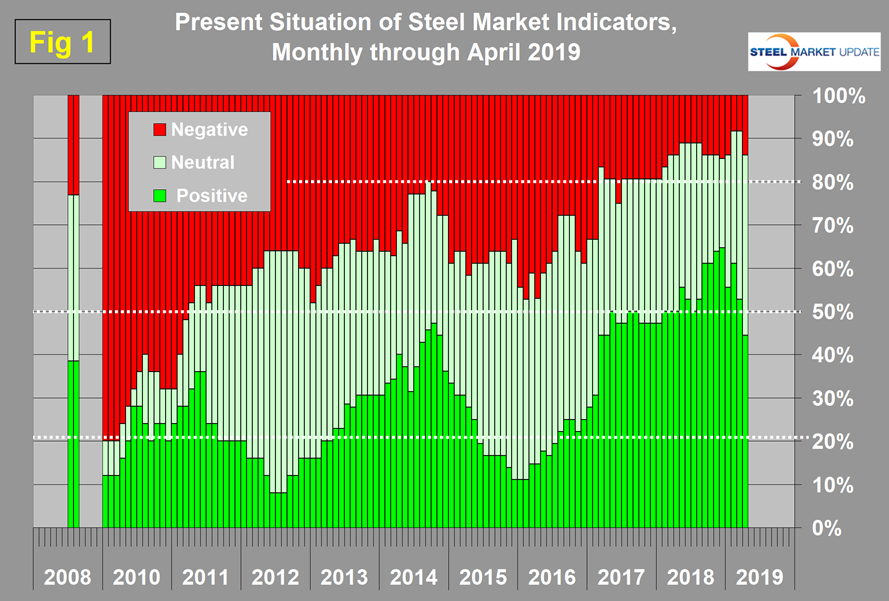
In our February analysis, the number of negatives declined to three, stayed at three in March and increased to five in April. There was a decrease of three in the number of positives and an increase of one in the number of indicators that we consider normal. Our intent in using the word normal is to say that this indicator is in the mid-range of historical data. Figure 1 shows our monthly assessment of the present situation since January 2010 on a percentage basis. In the general economy section, we revised GDP from normal to positive, which was a reversal of the March change. The Chicago Fed National Activity Index deteriorated from normal to negative. In the steel indicators sections, the net imports of long products deteriorated from normal to negative and shipments and supply of sheet products both deteriorated from positive to normal. There were no changes in the present situation of construction or manufacturing.
Trends
Most values in the trends columns are three-month moving averages (3MMAs) to smooth out what can be very erratic monthly data. Trend changes in the individual sectors are described below together with some general comments. (Please note that in most cases this is not April data but data that was released in April for previous months.)
Figure 2 shows the trend of the trends and the pre-recession situation at the far left of the chart. There were many trend changes in April in both directions, but the net was a decrease of four positives and an increase of four negatives. There has been a gradual deterioration in the number of positively trending indicators since February 2018. In April 2019, 55.6 percent of the 36 indicators were trending positive, 41.7 negative and 2.8 percent unchanged.
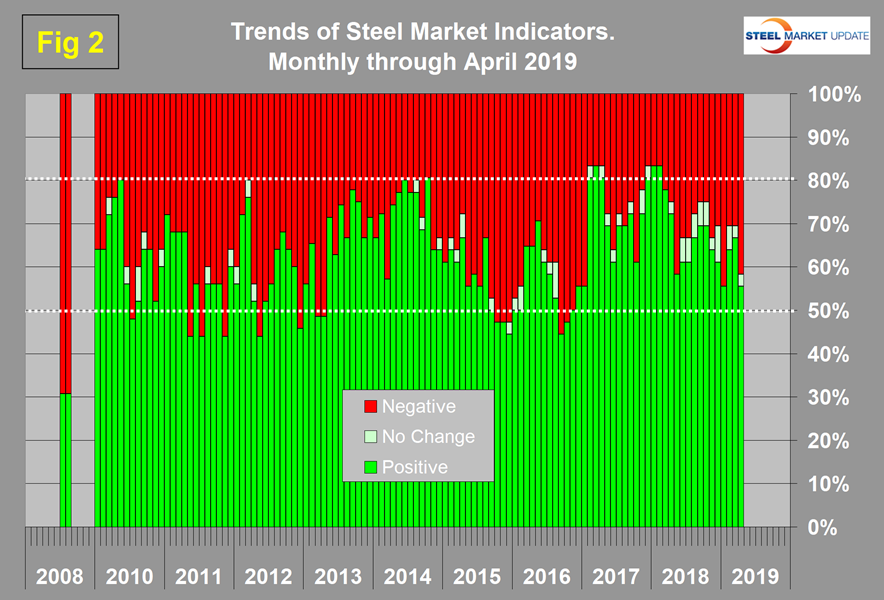
Our observations about trends in the April data are as follows: In the general economy, consumer confidence and the yield spread improved and the value of the U.S. dollar strengthened, which we class as a negative. All the raw materials experienced a trend reversal. Iron ore trended positive, while scrap, coking coal and zinc trended negative and pig iron went from negative to no change. In the steel sections, the prices of rebar and hot rolled coil both reversed to the negative, as did both shipments and supply of sheet products. The only trend change in construction and manufacturing was that the ISM manufacturing index reversed from negative to positive. Four out of six construction indicators are now trending positive as are four out of five manufacturing indicators.
We believe a continued examination of both the present situation and direction is a valuable tool for corporate business planning. Figures 1 and 2 both show the pre-recession situation in August 2008. The trends analysis shows that the steel market was going over a cliff, but the actual values of the indicators at that time were still good with only 23 percent registering as historically negative.
Explanation: The point of this analysis is to give both a quick visual appreciation of the market situation and a detailed description for those who want to dig deeper. It describes where we are now and the direction the market is headed and is designed to describe the situation on a specific date. The chart is stacked vertically to separate the primary indicators of the general economy, of raw material prices, of both sheet and long product market indicators, and of construction and manufacturing indicators. The indicators are classified as leading, coincident or lagging as shown in the third column.
Columns in the chart are designed to differentiate between where the market is today and the direction it is pointing. Our evaluation of the present situation is subjectively based on our opinion of the historical value of each indicator. There is nothing subjective about the trends section, which provides the latest facts available on the date of publication. It is quite possible for the present situation to be predominantly red and trends to be predominantly green or vice versa depending on the overall situation and direction of the market. The present situation is subdivided into: below the historical norm (-), (OK), and above the historical norm (+). The “Values” section of the chart is a quantitative definition of the market’s direction. In most cases, values are three-month moving averages to eliminate noise. In cases where seasonality is an issue, the evaluation of market direction is made on a year-over-year comparison to eliminate this effect. Where seasonality is not an issue, concurrent periods are compared. The date of the latest data is identified in the third values column. Values will always be current as of the date of publication. Finally, the far-right column quantifies the trend as a percentage or numerical change with color code classification to indicate positive or negative direction.


