

Market Data
September 4, 2019
SMU Analysis: Key Market Indicators Through August
Written by Peter Wright
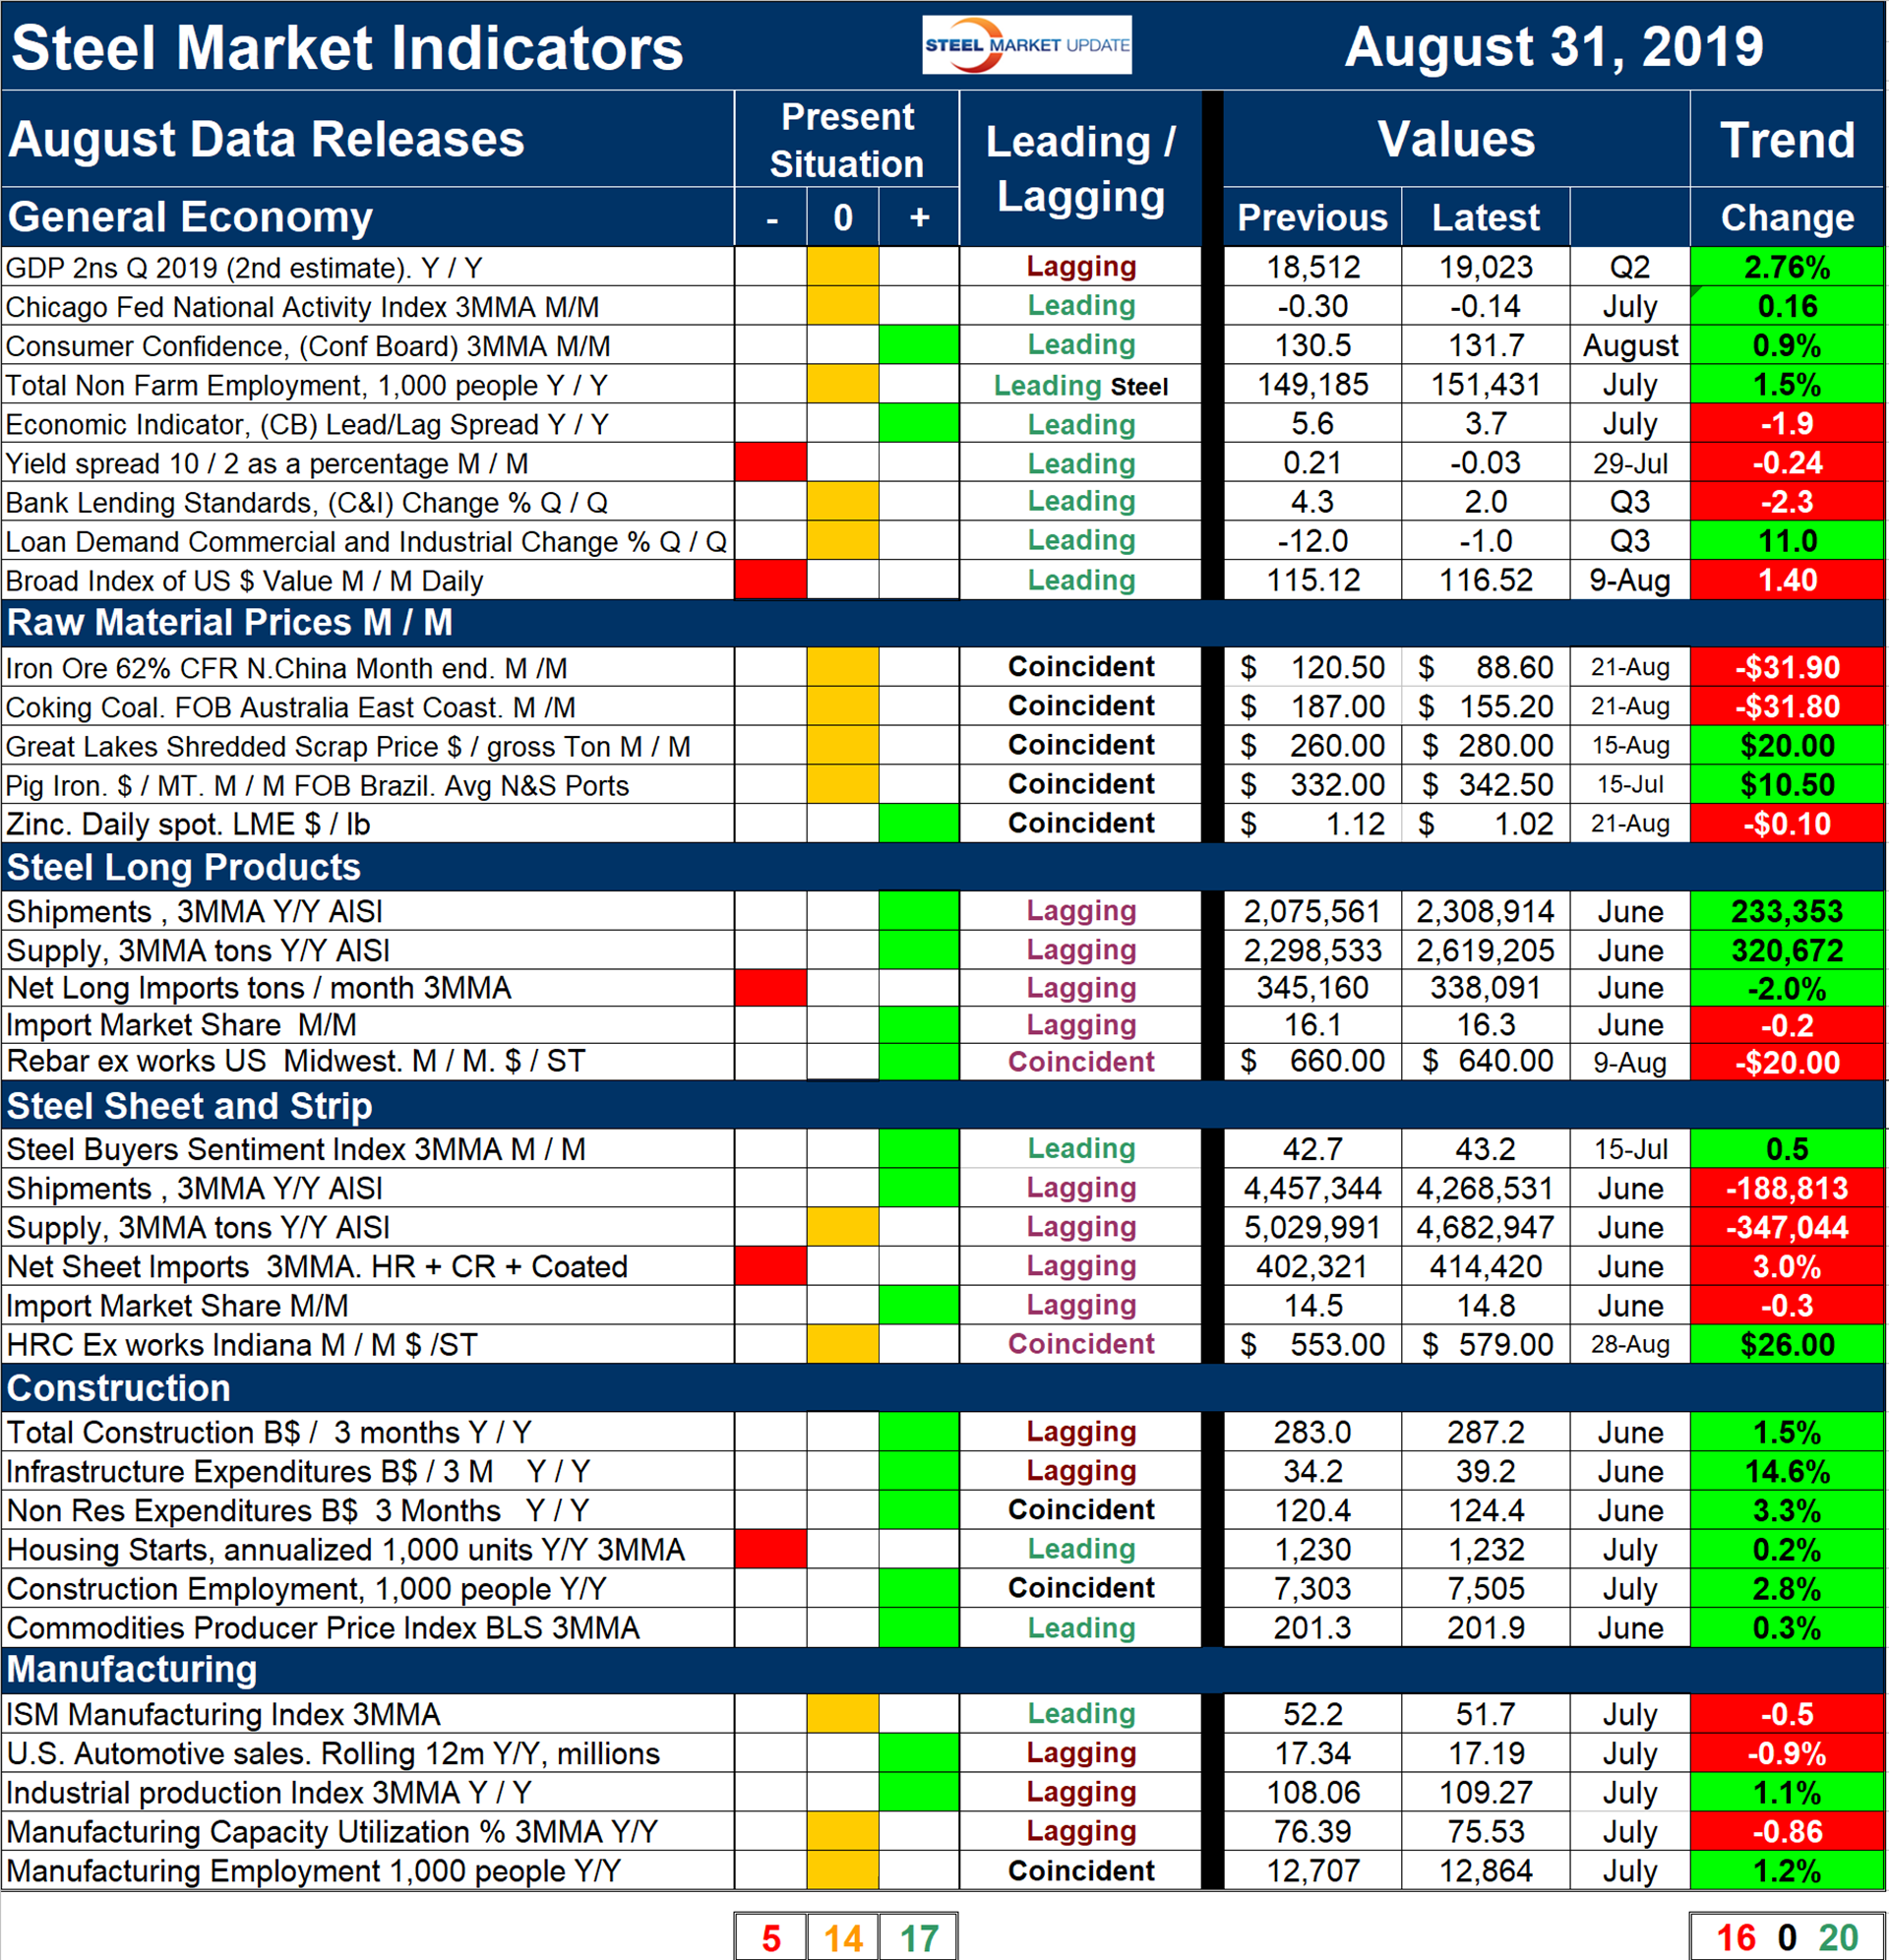
This report is designed to be a big picture summary of data we have reported in detail during the month. It summarizes 36 data streams that describe the state of the steel market and provide forward guidance for steel buyers and sellers. See the end of this piece for an explanation of the Key Indicators concept. This will explain the difference between our view of the present situation, which is subjective, and our analysis of trends, which is based on the latest facts available.
Please refer to Table 1 for our view of the present situation and the quantitative measure of trends. Readers should regard the color codes in the present situation column as a visual summary of the current market condition. The “Trend” columns of Table 1 are also color coded to give a quick visual appreciation of the direction the market is headed. All results are the latest available as of Aug. 31, 2019.
Present Situation
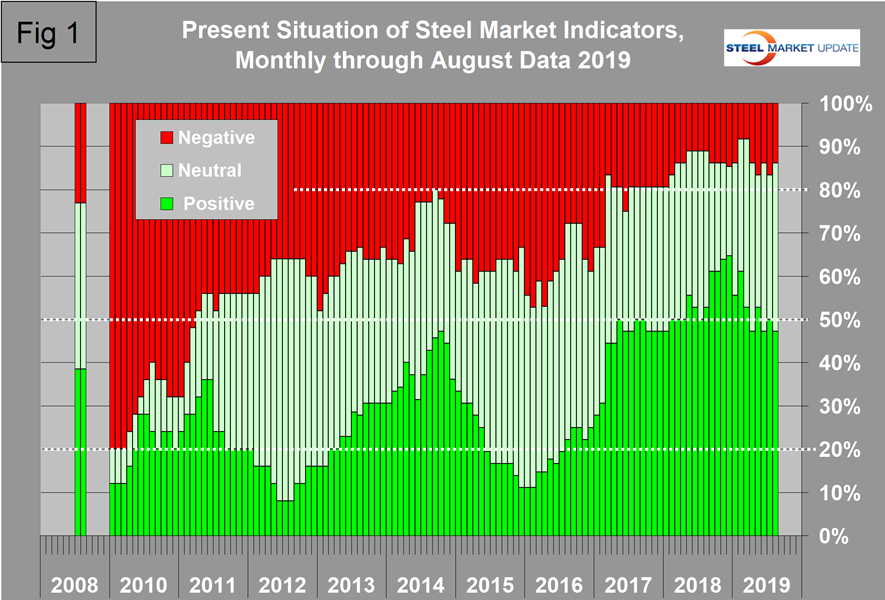
Our view of the August data is that the number of indicators we regard as strong has been hovering around 50 percent for the last six months with only 14 percent being weak. The balance are in the historical mid-range (normal). Figure 1 shows the history of our view of the present situation data since January 2010 on a percentage basis, and on the far left of the chart is the August 2008 situation immediately before the recession struck the steel business in September that year. Our view of the August data is that of the 36 indicators, 17 are currently positive, 14 are normal and five are negative. This was a decrease of one positive, of one negative and an increase of two normal since our July update. Our intent in using the word normal is to say that this indicator is in the mid-range of historical data.
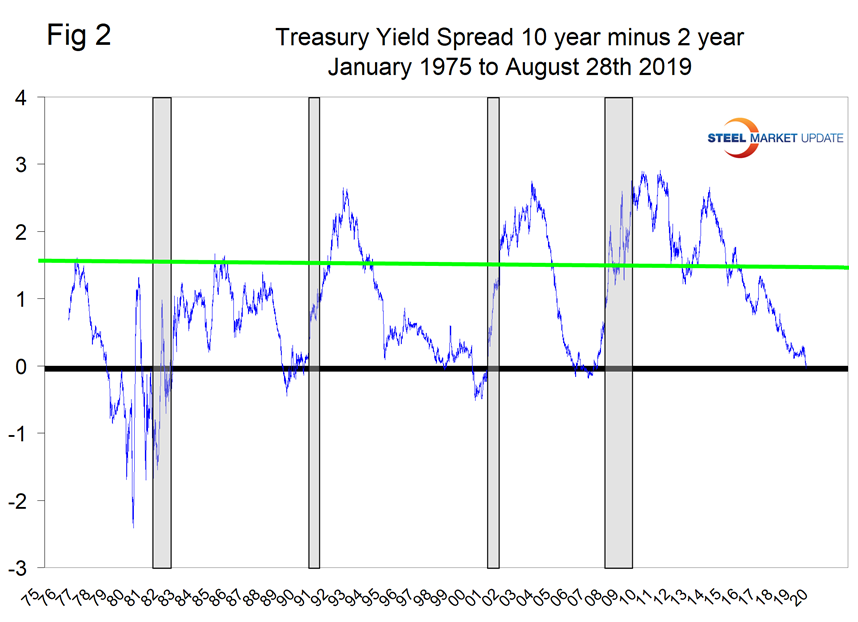
The most significant change in the latest data was that on Aug. 27 the treasury yield spread, 10-year minus two-year, dipped into negative territory with a value of -.04 percent. The last time the 10/2 spread was negative was June 6, 2007 (Figure 2). A negative spread has predicted every recession since the mid 1960s with a six- to 24-month lead time (and just one false positive). Or to put another way, if the 10/2 yield curve inverts, there’s a 90 percent historical probability that a recession is coming in the next two years. At the end of August, the spread was only very slightly negative, but certainly needs to be on our radar screens as we move into September. The other significant change in the August data was that the ISM manufacturing index declined in our view from positive to neutral. This index has been declining steadily for almost a year and is approaching the critical 50 level. An index value above 50 indicates that the manufacturing economy is generally expanding; below 50 indicates the opposite.
Trends
Most values in the trends columns are three-month moving averages (3MMA) to smooth out what can be very erratic monthly data. Trend changes in the individual sectors are described below together with some general comments. (Please note that in most cases this is not August data but data that was released in August for previous months.)
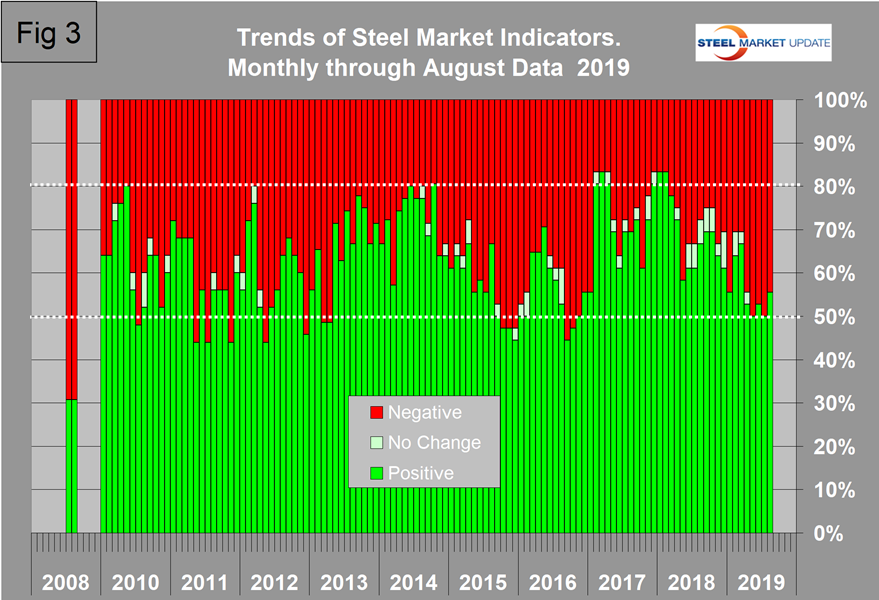
Figure 3 shows the trend of the trends and the pre-recession situation at the far left of the chart. In August 2019, 20 indicators were trending positive and 16 negative. Ten indicators reversed direction in the August data resulting in a net increase of two positive and a net decrease of two negative. Three of those reversals were in the raw materials section where iron ore trended negative and scrap and pig iron trended positive. The only trend change in the construction and manufacturing sections was that the producer price index of commodities reversed direction and trended positive. We regard this as a leading indicator of industrial construction. All of the construction indicators are trending positive and three of the five manufacturing indicators are trending negative. As a result of the construction and manufacturing situation, the shipments and supply of long steel products are trending positive and the reverse is the case for sheet steel products. There has been deterioration in the number of positively trending indicators since February 2018.
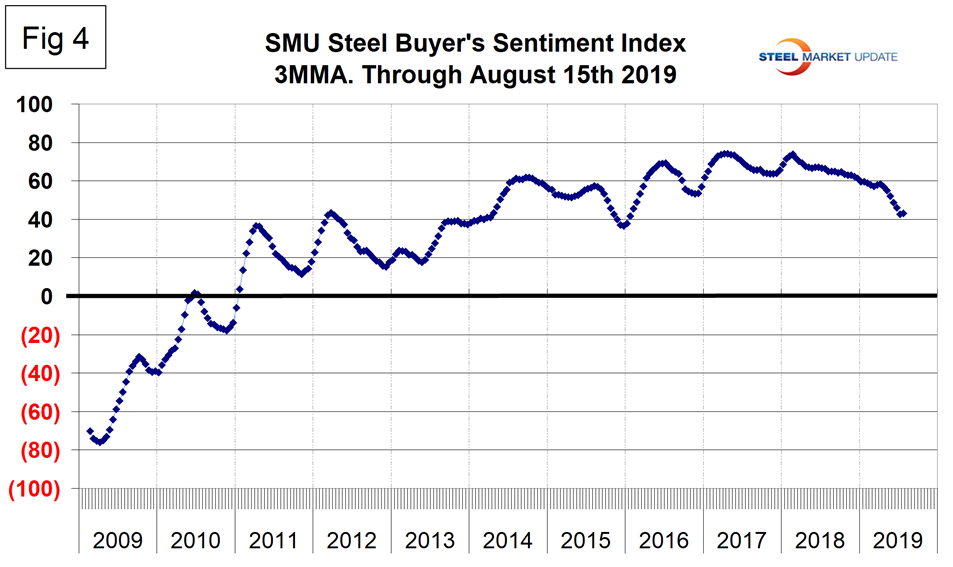
As a reality check for this report, we include here Figure 4, which is SMU’s Steel Buyers Sentiment index. Readings are developed during the twice monthly SMU market surveys. SMU Steel Buyers Sentiment is a measure of the current attitude of North American buyers and sellers of flat rolled products regarding their company’s opportunity for success in today’s market. A reading above the neutral point of zero indicates that a preponderance of buyers have a positive attitude. The index has been deteriorating since mid-February last year. The mid-August value was still positive 43.2, but down from a peak of 73.8 in February 2018.
We believe a continued examination of both the present situation and direction is a valuable tool for corporate business planning. Figures 1 and 3 both show the pre-recession situation in August 2008. The trends analysis shows that the steel market was going over a cliff, but the actual values of the indicators at that time were still good with only 23 percent registering as historically negative.
Explanation: The point of this analysis is to give both a quick visual appreciation of the market situation and a detailed description for those who want to dig deeper. It describes where we are now and the direction the market is headed and is designed to describe the situation on a specific date. The chart is stacked vertically to separate the primary indicators of the general economy, of raw material prices, of both sheet and long product market indicators, and of construction and manufacturing indicators. The indicators are classified as leading, coincident or lagging as shown in the third column.
Columns in the chart are designed to differentiate between where the market is today and the direction it is pointing. Our evaluation of the present situation is subjectively based on our opinion of the historical value of each indicator. There is nothing subjective about the trends section, which provides the latest facts available on the date of publication. It is quite possible for the present situation to be predominantly red and trends to be predominantly green or vice versa depending on the overall situation and direction of the market. The present situation is subdivided into: below the historical norm (-), (OK), and above the historical norm (+). The “Values” section of the chart is a quantitative definition of the market’s direction. In most cases, values are three-month moving averages to eliminate noise. In cases where seasonality is an issue, the evaluation of market direction is made on a year-over-year comparison to eliminate this effect. Where seasonality is not an issue, concurrent periods are compared. The date of the latest data is identified in the third values column. Values will always be current as of the date of publication. Finally, the far-right column quantifies the trend as a percentage or numerical change with color code classification to indicate positive or negative direction.


