

Market Data
January 5, 2020
SMU Analysis: Key Market Indicators through December
Written by Peter Wright
Steel Market Update is pleased to share this Premium content with Executive level members. For more information on how to upgrade to a Premium-level subscription, email Info@SteelMarketUpdate.com.
Key Market Indicators showed a substantial improvement in market trends in the December data. This report is designed to be a big picture summary of data SMU has reported in detail during the month. It summarizes 36 data streams that describe the state of the steel market and provide forward guidance for steel buyers and sellers. See the end of this piece for an explanation of the Key Indicators concept. This will explain the difference between our view of the present situation, which is subjective, and our analysis of trends, which is based on the latest facts available.
![]()
Please refer to Table 1 for our view of the present situation and the quantitative measure of trends. Readers should regard the color codes in the present situation column as a visual summary of the current market condition. The “Trend” columns of Table 1 are also color coded to give a quick visual appreciation of the direction the market is headed. All results are the latest available as of Dec. 31, 2019.
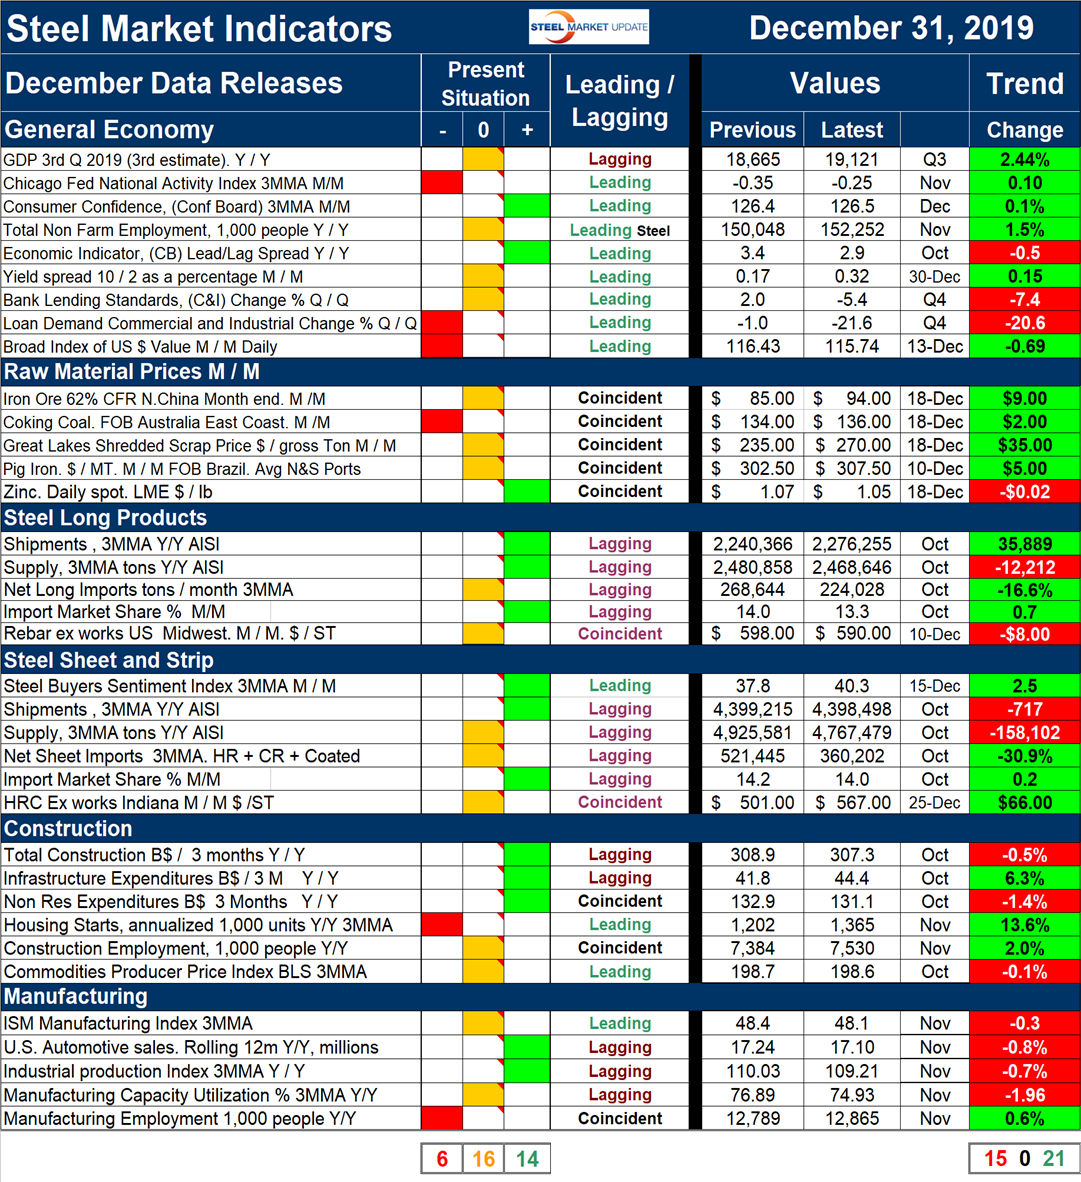
Present Situation
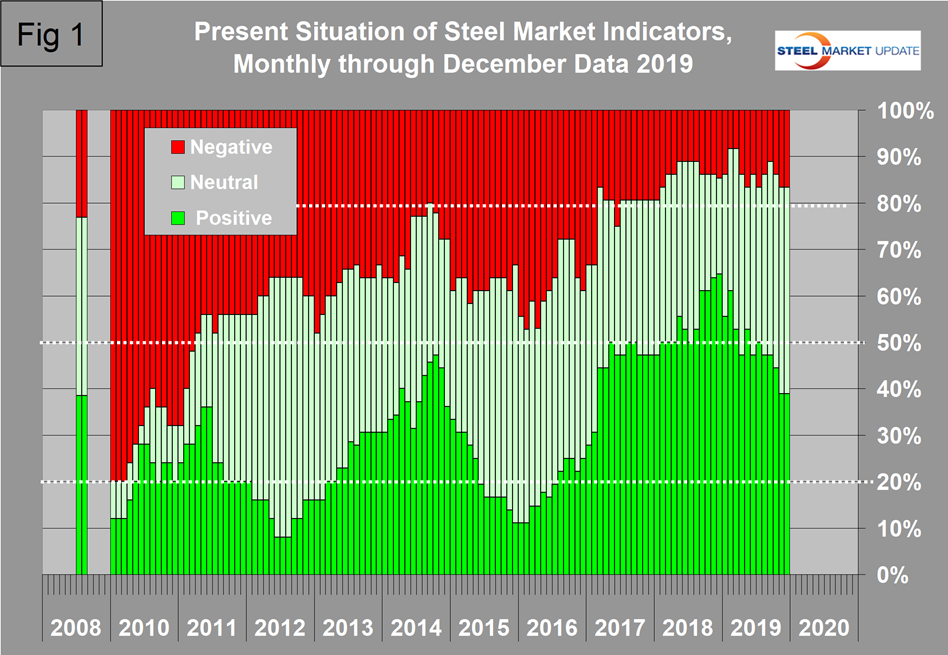
Our view of the December data is that the net number of indicators we regard as strong was unchanged from November with 14 strong, 16 normal and 6 weak. There has been a declining number of strong indicators throughout 2019, but the number we regard as weak has increased only slightly. In other words, the transition has been from strong to normal. By normal we mean the current data value is in the mid-range of the historical distribution. Figure 1 shows the history of our view of the present situation data since January 2010 on a percentage basis, and on the far left of the chart is the August 2008 situation immediately before the recession struck the steel business in September that year. There were two individual changes in December that cancelled each other out. The Chicago Fed National Activity Index transitioned from normal to weak and the price of shredded scrap transitioned from weak to normal.
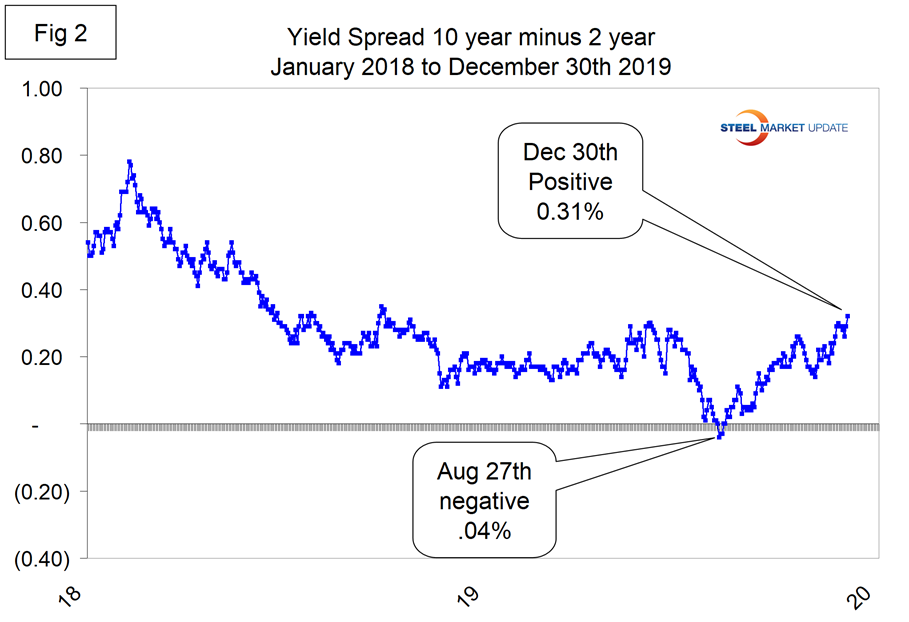
We make special mention of the Treasury yield spread here because the 10-year minus two-year dipped into negative territory for three days at the end of August. Historically, a negative yield spread has been a predictor of recession within 18 months. On Dec. 30 the value was positive 0.31 percent, the strongest since Nov. 10, 2018 (Figure 2). The negative duration was so short and the negativity so small that maybe we have dodged the recession prediction for now. The last time the 10/2 spread was negative was June 6, 2007.
There were no other changes in our view of the present situation in December.
Trends
Most values in the trends columns are three-month moving averages (3MMA) to smooth out what can be very erratic monthly data. Trend changes in the individual sectors are described below together with some general comments. (Please note that in many cases this is not December data but data that was released in December for previous months.)
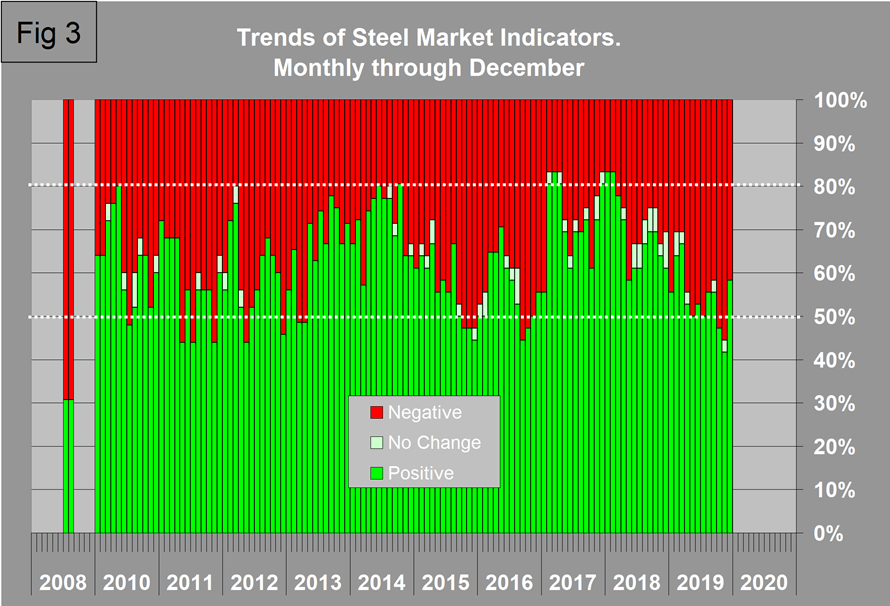
There was a substantial improvement in market trends in December, particularly in the sections dealing with the general economy and raw materials prices. The number of positives increased from 15 in November to 21 in December and the number of negatives declined from 20 to 15. One indicator, the price of pig iron, was unchanged in November and trended positive in December. Figure 3 shows the trend of the trends and the pre-recession situation at the far left of the chart. Seven indicators reversed direction in the December data and one transitioned from unchanged to positive. The only trend that reversed from positive to negative was the supply of long products, which declined slightly year over year. The CFNAI, the yield spread, consumer confidence, the prices of iron ore and coking coal and steel buyers’ sentiment all reversed direction from negative to positive in the December data. There were no trend changes for either construction or manufacturing. Construction is mixed and manufacturing is weak.
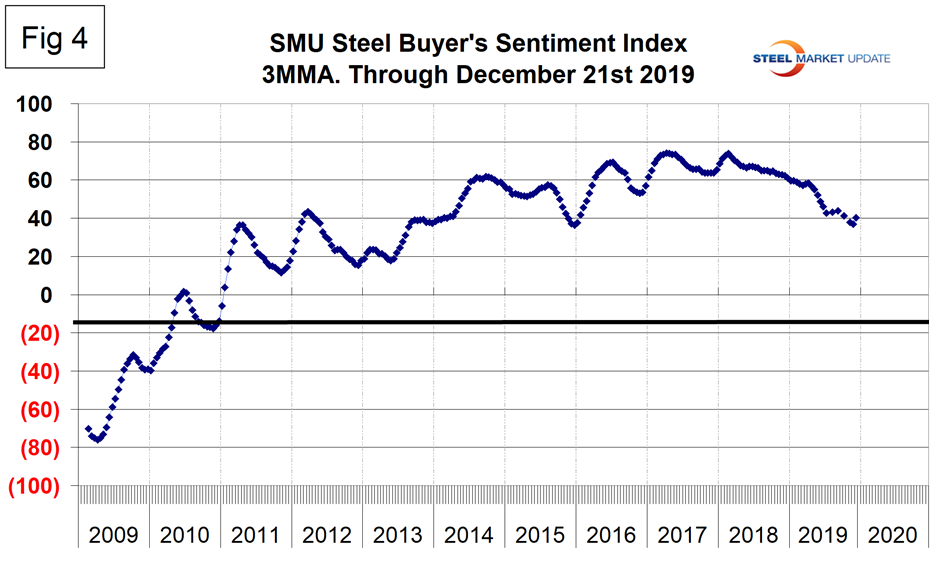
As a reality check for this report we include here Figure 4, which is SMU’s Steel Buyers Sentiment index. Readings are developed during the twice monthly SMU market surveys. SMU Steel Buyers Sentiment is a measure of the current attitude of North American buyers and sellers of flat rolled products regarding their company’s opportunity for success in today’s market. A reading above the neutral point of zero indicates that a preponderance of buyers have a positive attitude. The index has been deteriorating since mid-February last year, but in mid-December increased by 3.5 points. It’s too soon to announce a trend, but this change is encouraging. While showing more optimism about current market conditions, the reading is still 21 points below the level at this time last year. On a 3MMA basis, the mid-December value was positive 40.33, up from 36.83 in mid-November but down from a peak of 73.8 in February 2018.
We believe a continued examination of both the present situation and direction is a valuable tool for corporate business planning. Figures 1 and 3 both show the pre-recession situation in November 2008. The trends analysis shows that the steel market was going over a cliff, but the present values at that time were still good with only 23 percent registering as historically negative. Last month we reported that there was deterioration in the direction of trends that had been remorseless since the beginning of 2018. The December data exhibited a substantial improvement, which if it continues will be very encouraging. Our view of the present situation is still quite good, though the number of indicators having a historically high value has deteriorated since the end of 2018.
Explanation: The point of this analysis is to give both a quick visual appreciation of the market situation and a detailed description for those who want to dig deeper. It covers where we are now and the direction the market is headed and is designed to describe the situation on a specific date. The chart is stacked vertically to separate the primary indicators of the general economy, of raw material prices, of both sheet and long product market indicators, and of construction and manufacturing indicators. The indicators are classified as leading, coincident or lagging as shown in the third column.
Columns in the chart are designed to differentiate between where the market is today and the direction it is pointing. Our evaluation of the present situation is subjectively based on our opinion of the historical value of each indicator. There is nothing subjective about the trends section, which provides the latest facts available on the date of publication. It is quite possible for the present situation to be predominantly red and trends to be predominantly green or vice versa depending on the overall situation and direction of the market. The present situation is subdivided into: below the historical norm (-), (OK), and above the historical norm (+). The “Values” section of the chart is a quantitative definition of the market’s direction. In most cases, values are three-month moving averages to eliminate noise. In cases where seasonality is an issue, the evaluation of market direction is made on a year-over-year comparison to eliminate this effect. Where seasonality is not an issue, concurrent periods are compared. The date of the latest data is identified in the third values column. Values will always be current as of the date of publication. Finally, the far-right column quantifies the trend as a percentage or numerical change with color code classification to indicate positive or negative direction.


