Analysis

April 5, 2021
CPIP Data: Residential Construction Strong in February
Written by David Schollaert
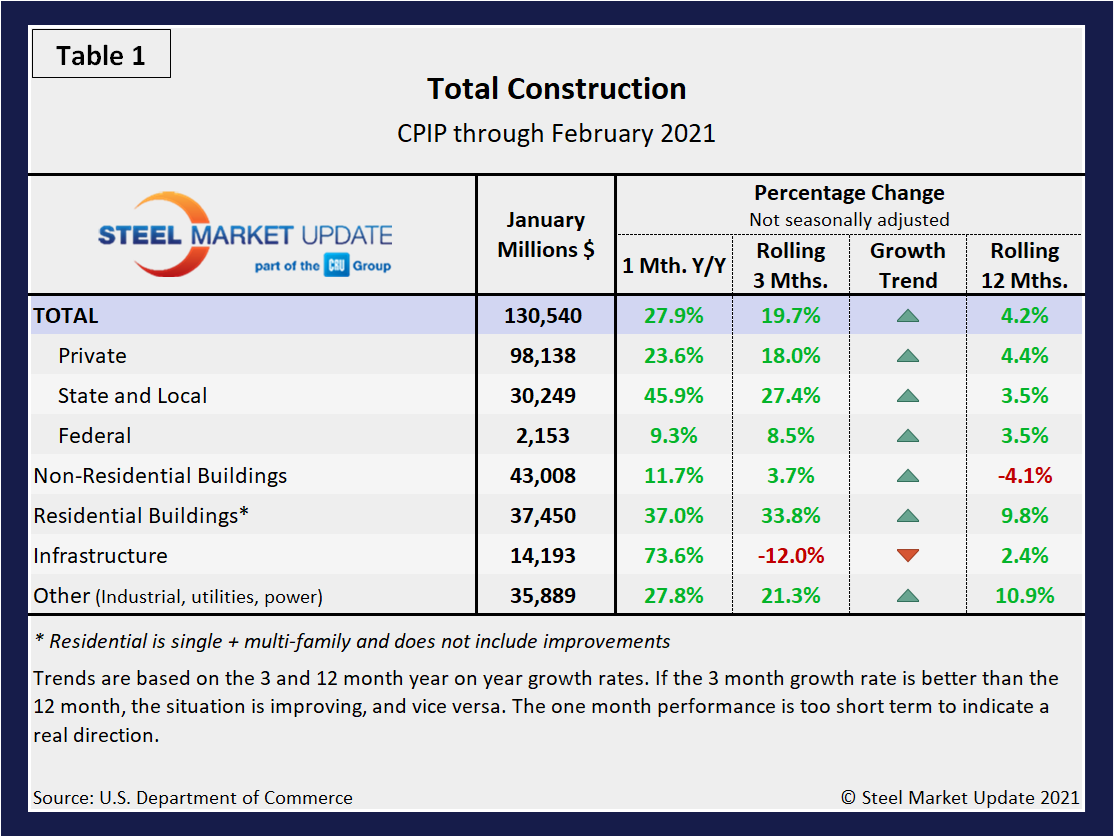
Total construction expenditures edged down in February to $1.52 trillion, down 0.8% from January’s revised estimate of $1.53 trillion, reported the U.S. Census Bureau. Despite the slight dip month on month, total construction was up 5.3% compared to a year ago when spending totaled $1.44 trillion. Year-to-date construction spending amounted to $2.13 trillion, 4.9% above the $2.03 trillion for the same period in 2020.
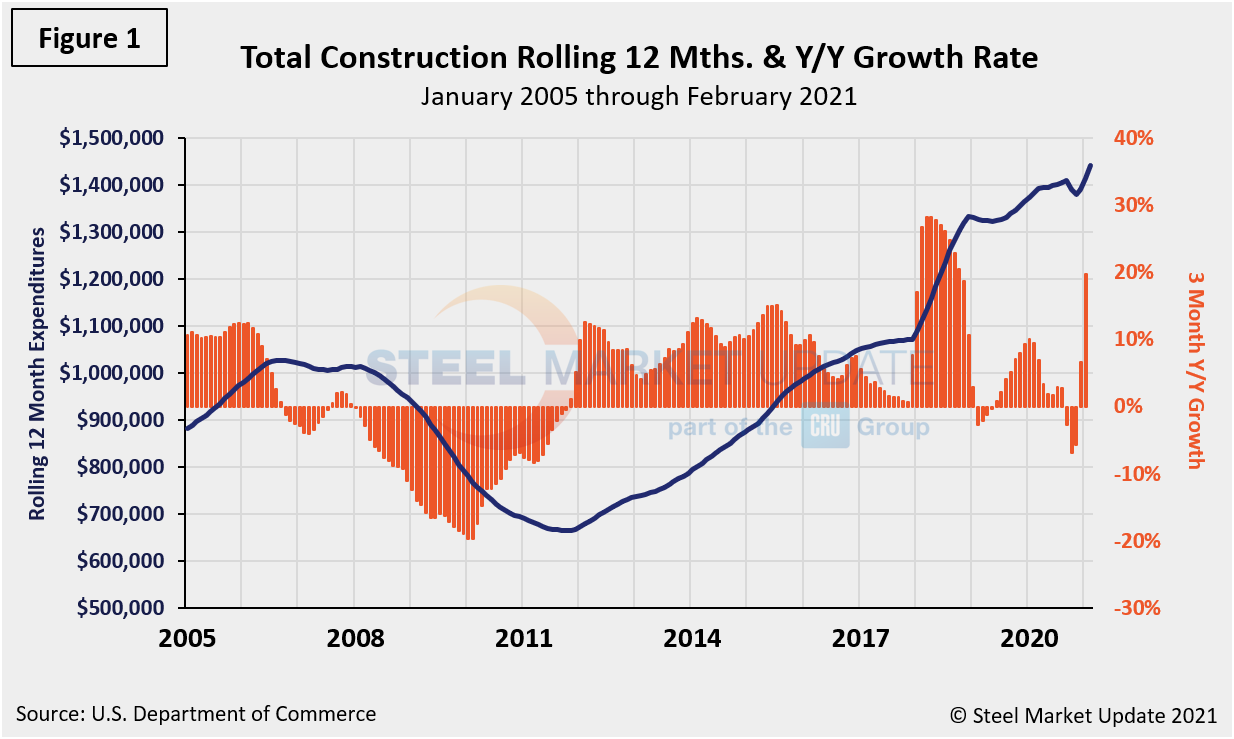
Except for infrastructure, all other sectors show steady growth trends in Table 1 below. This is especially positive as year-over-year comparisons are still largely pre-pandemic. Private, state and local, and federal construction are all on the rise, especially residential buildings measured on a rolling three- and 12-month basis. Additionally, Figure 1 shows total construction expenditures on a rolling 12-month basis as the blue line and the rolling three-month year-over-year growth rate as the orange bars
Private Construction
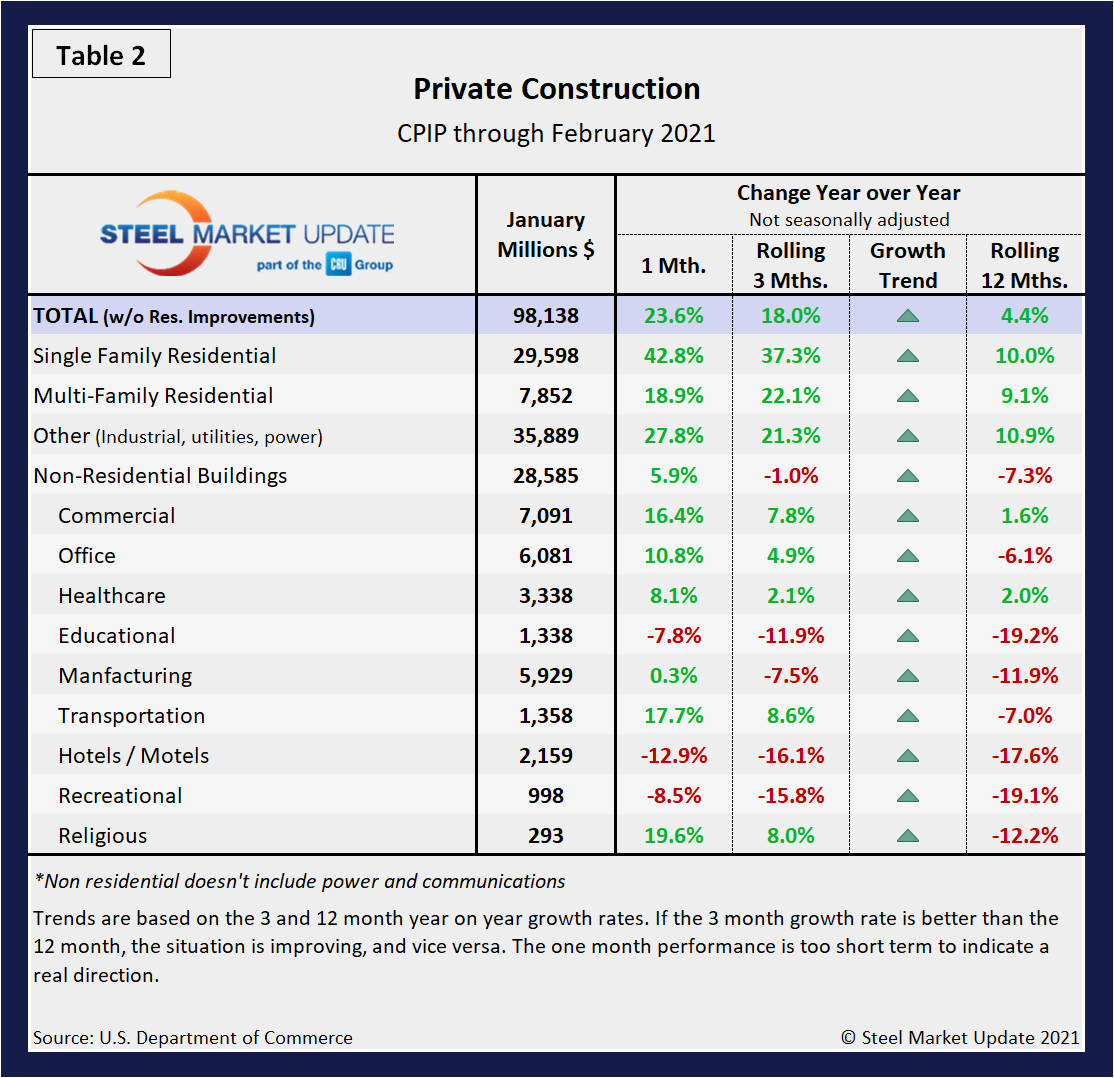
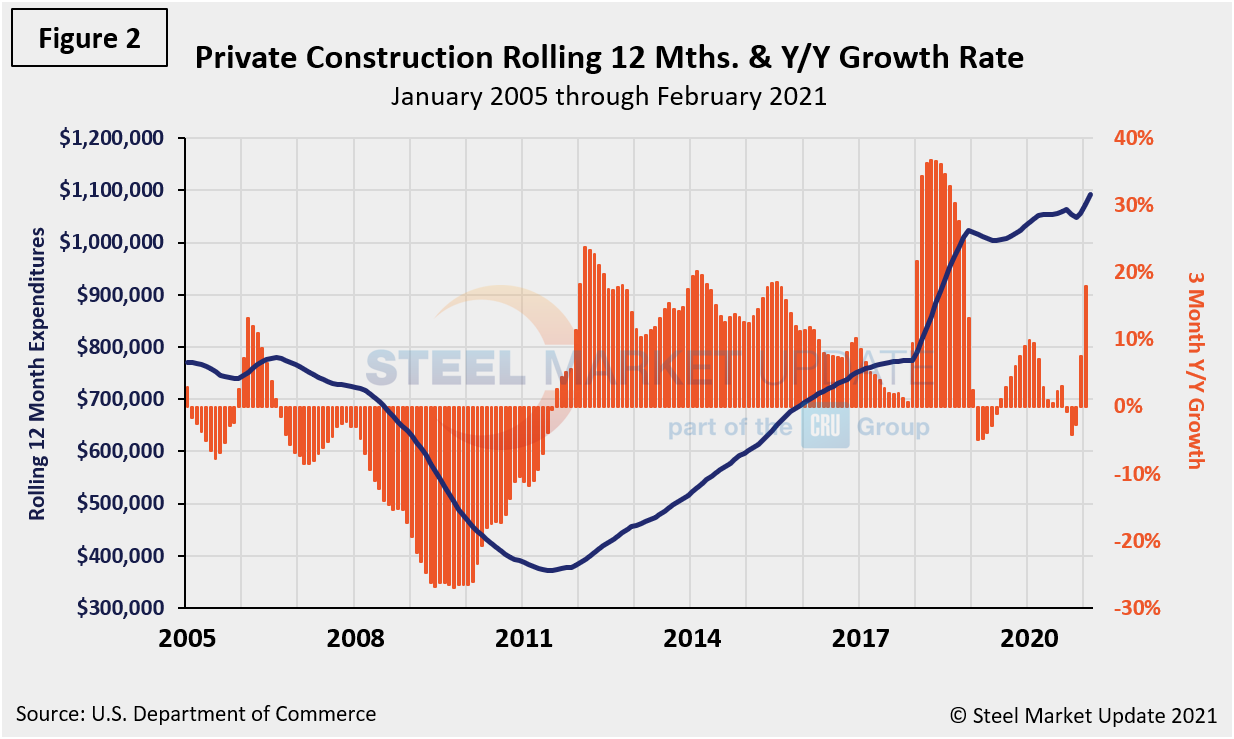
The breakdown of private expenditures into residential and non-residential and their subsectors are highlighted below (Table 2). The major point to highlight here is that, without exception, all categories and subcategories are showing a positive growth trend, with single-family residential leading the way and posting a positive 42.8% growth rate in February. Spending on private construction hit a seasonally adjusted annual rate of $1.17 trillion, 0.5% below the revised January estimate. Residential construction saw a seasonally adjusted annual rate of $717.9 billion in February, 0.2% below the revised January estimate of $719.3 billion, the Census Bureau reported (Figure 2).
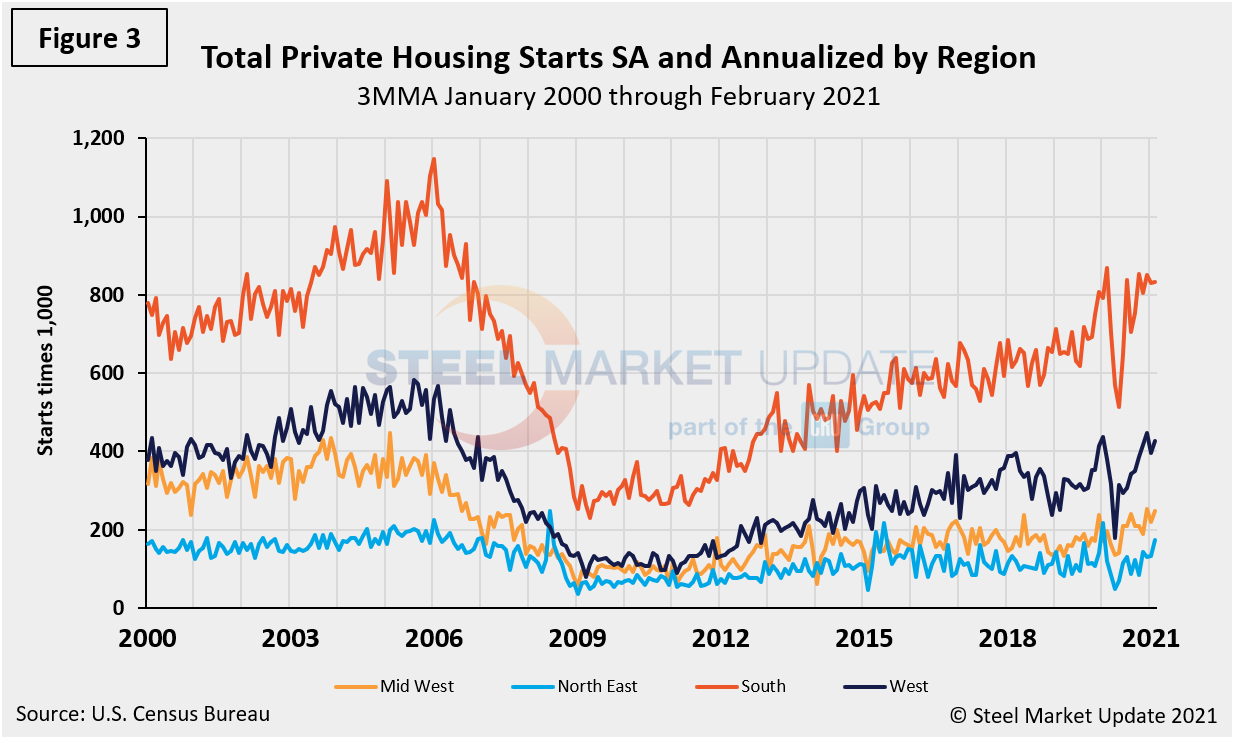
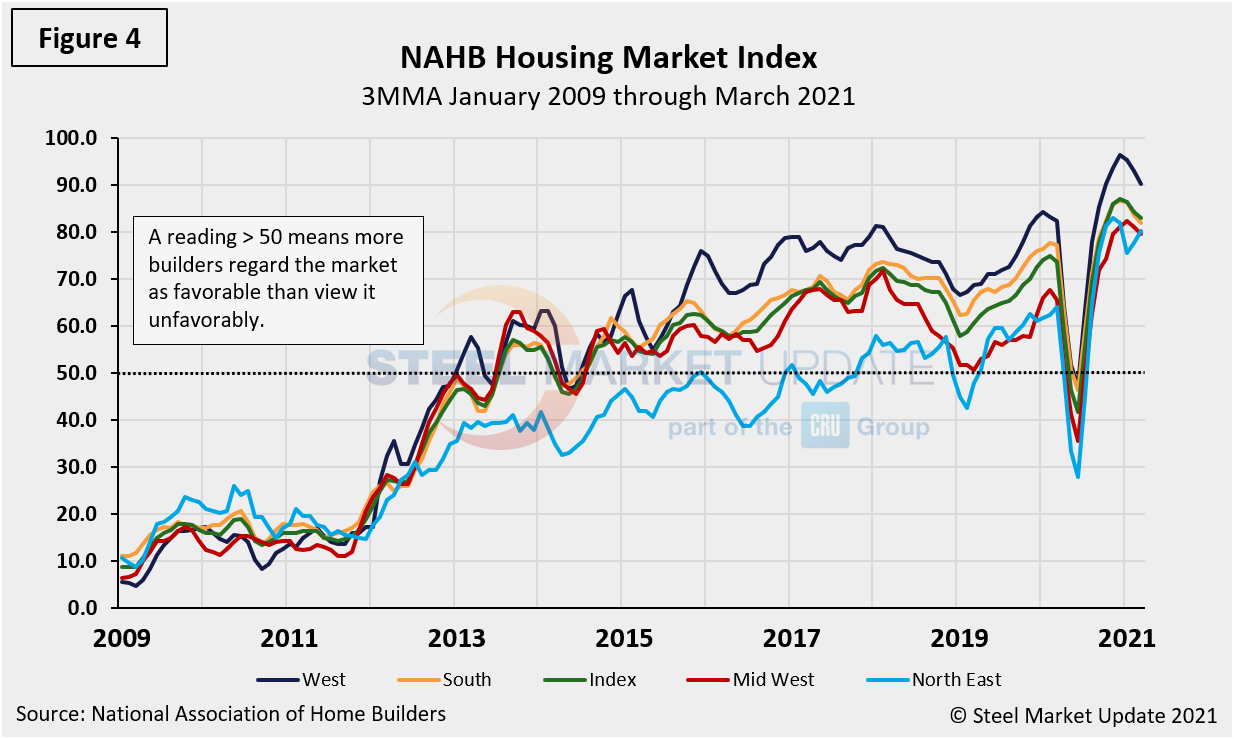
Total housing starts in four regions are displayed below (Figure 3) and show no change in overall dynamics. The Southern region continues to be the strongest region while the Northeast trails all three. All four regions fell and were directly impacted by the widespread COVID-19 shutdowns, but all have nearly recovered to pre-pandemic levels. The National Association of Home Builders optimism index crashed in April and recovered each month May through December last year. Since the new year, the index has fluctuated, slipping slightly, according to March data as shown in Figure 4.
State and Local Construction
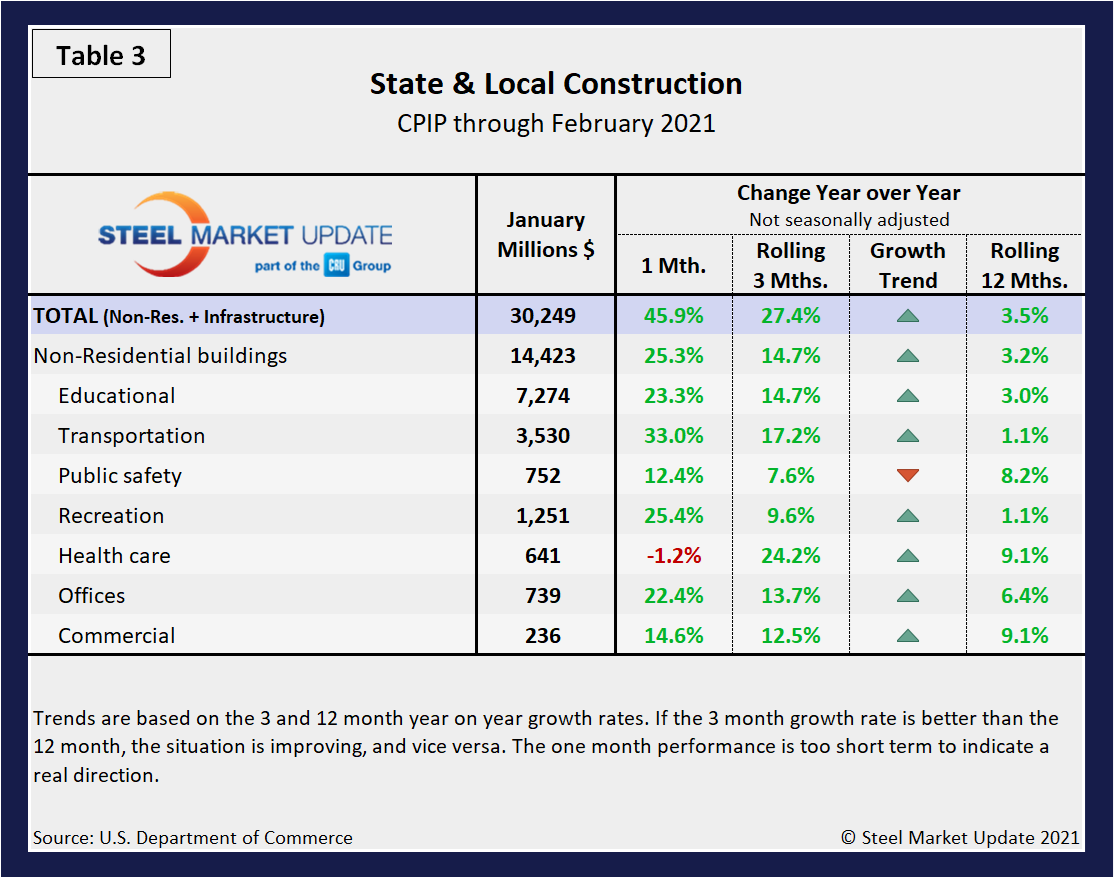
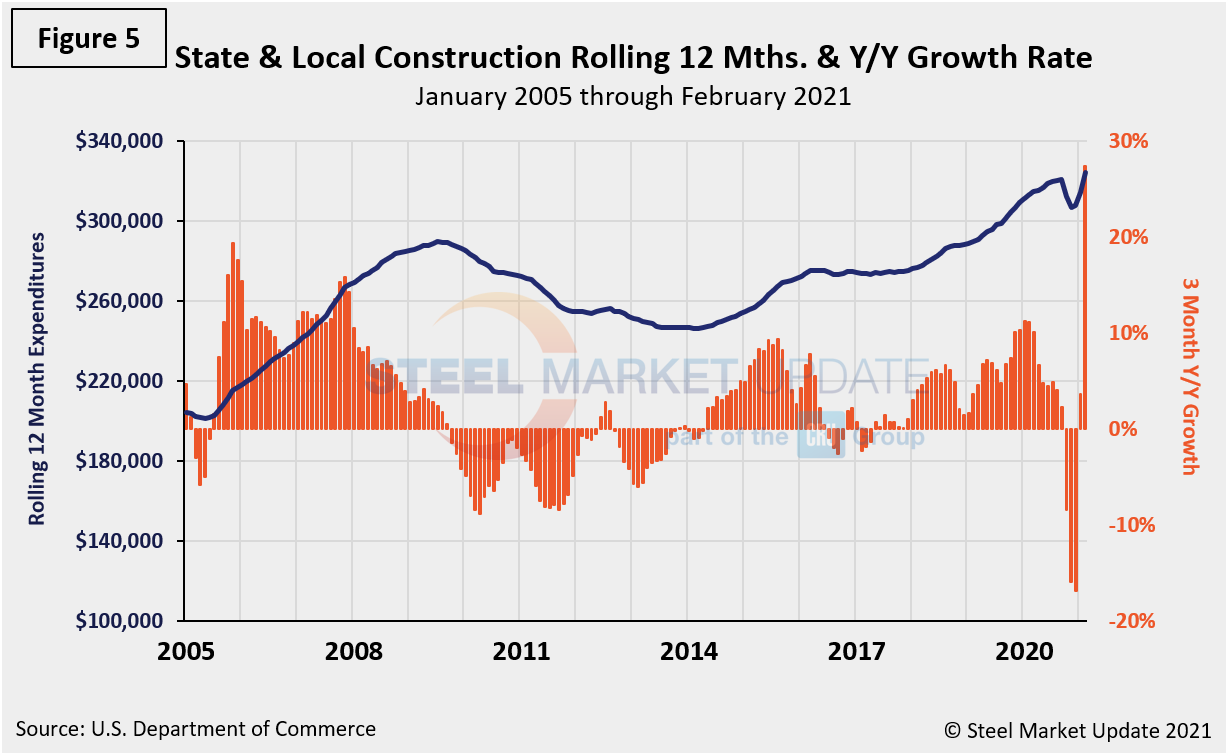
The growth trends for State and Local (S&L) expenditures were positive for the first time since the height of the pandemic last March (Table 3). In three months through February, only public safety is still seeing negative momentum. In February, the estimated seasonally adjusted annual rate of public construction spending was $351.2 billion, 1.7% below the revised January estimate of $357.4 billion. Educational construction was at a seasonally adjusted annual rate of $86.9 billion, 3.2% below the revised January estimate of $89.8 billion. Highway construction was at a seasonally adjusted annual rate of $102.3 billion, 0.6% below the revised January estimate of $103.0 billion. Figure 5 shows the history of total S&L expenditures.
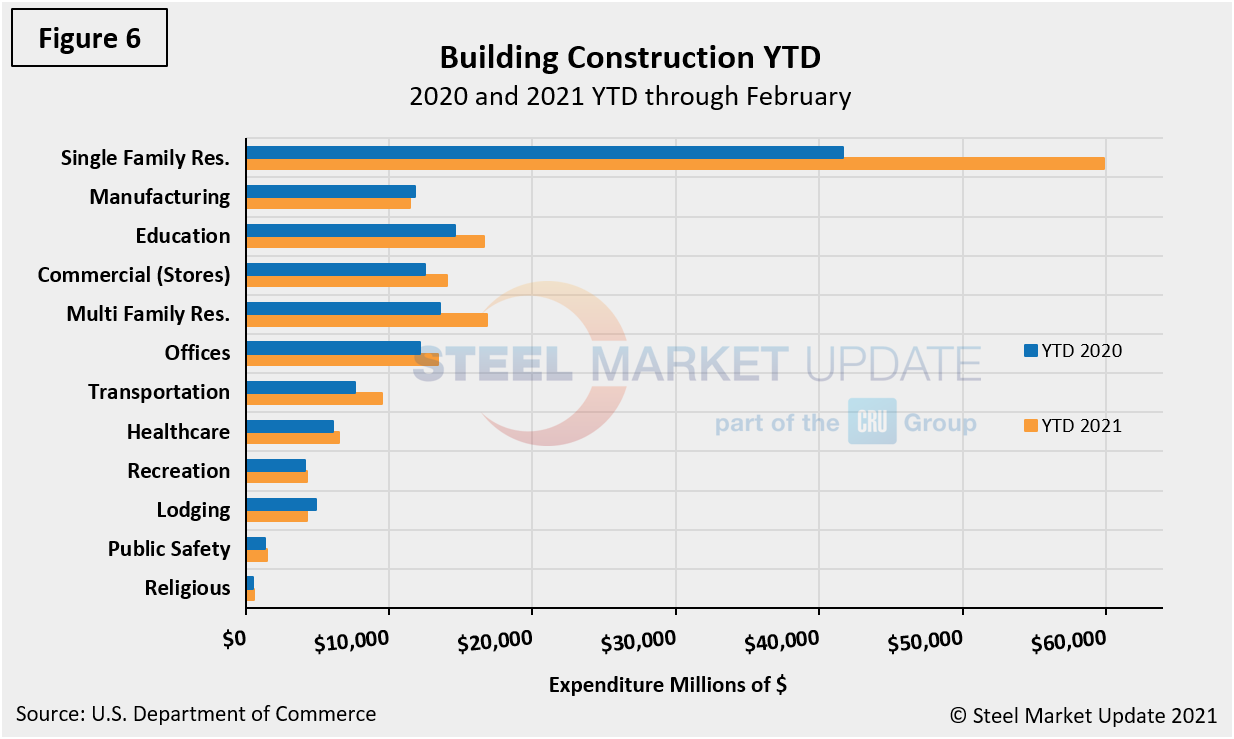
Year-to-date expenditures for the construction of the various building sectors for 2020 and 2021 is compared in Figure 6. Single-family residential was dominant in 2020 with expenditures totaling $301.9 billion annualized, and it has not let up in 2021. Through February, expenditures for single-family construction were $59.8 billion, up 43.5% compared to year-ago levels.
Explanation: Each month, the Commerce Department issues its Construction Put in Place (CPIP) data, usually on the first working day covering activity one month and one day earlier. There are three major categories based on funding source: private, state and local, and federal. Within these three groups are about 120 subcategories of construction projects. SMU analyzes the expenditures from the three funding categories to provide a concise summary of the steel-consuming sectors.
By David Schollaert, David@SteelMarketUpdate.com