

Market Data

June 3, 2021
GDP Growth Unchanged at 6.4% in Q1’s Second Estimate
Written by David Schollaert
U.S. gross domestic product (GDP) grew by 6.4% in the first quarter of 2021 on an annualized basis, according to the second estimate from the Bureau of Economic Analysis (BEA). The second estimate saw no change in overall GDP compared to the advance estimate; however, upward revisions to consumer spending and nonresidential fixed investment were offset by downward revisions to exports and private inventory investment.
The economy’s progress in Q1 marks the second-fastest pace of growth since Q2 2003 and was exceeded only by the pandemic-reopening-fueled burst of Q3 in 2020. This growth follows the 4.3% real GDP increase seen in Q4 2020, with economists speculating that GDP could top 10.0% in the second quarter.
The recovery from last year’s deep recession gained steam at the beginning of this year, helped by mass vaccination efforts and trillions of dollars in government assistance. Upward revisions in spending by consumers, who account for two-thirds of economic activity, were offset by weaker growth in exports.
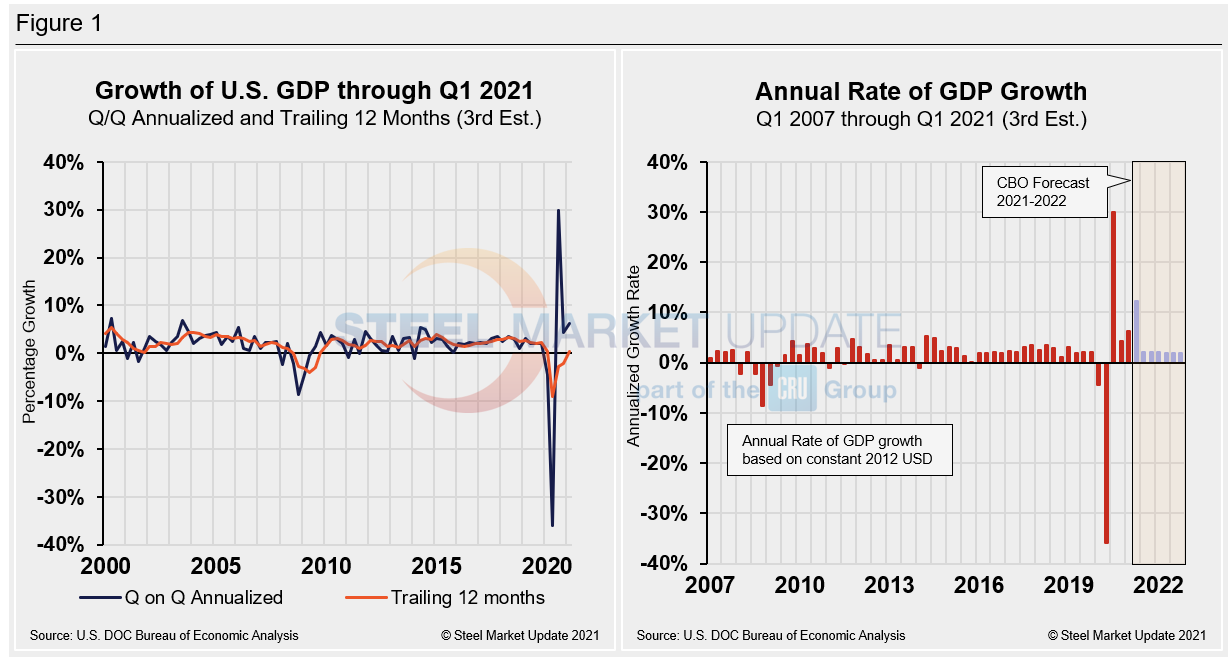
The Department of Commerce’s second look at U.S. GDP showed that first-quarter GDP totaled $22.06 trillion. Consumer spending grew at a sizzling annual rate of 11.0% or a $566.3 billion increase from the previous quarter, even better than the 10.7% estimate made a month ago. Below in Figure 1 is a side-by-side comparison of the growth of U.S. GDP and the annual rate of GDP, both through Q1 2021. On a trailing 12-month basis, GDP was up by 0.41% in Q1, a positive swing from a negative 2.22% in Q4, and a vast improvement from negative 9.04% in Q2 last year at the height of the pandemic. In the same period in 2020, the trailing 12-month growth rate was slightly higher at a positive 0.44%. For comparison, the average in 43 quarters since Q1 2010 has been a growth rate of 1.96%. The blue line in the same chart shows the progress of the trailing 12-month result since Q1 of 2000. The chart on the right details the headline quarterly results since Q1 2007 including the Congressional Budget Office’s GDP projection through 2022.
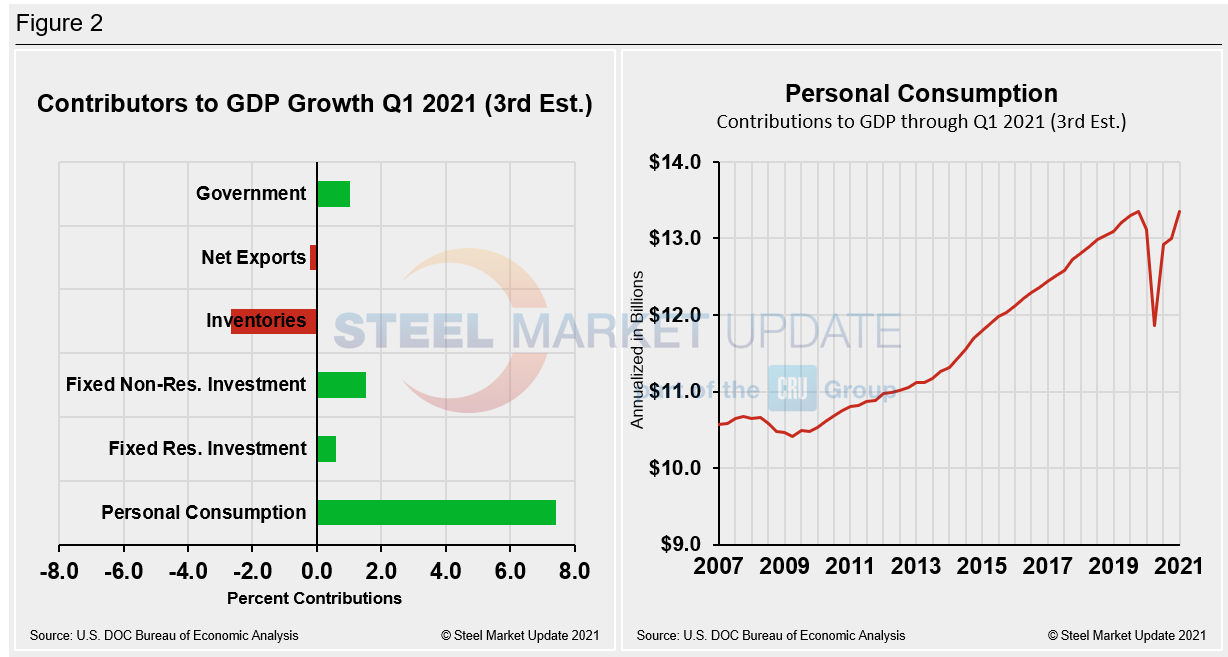
Shown below in Figure 2 is a side-by-side comparison of two charts. On the left is the mix of the six major contributory components in the GDP growth calculation, while the chart on the right puts a spotlight on personal consumption. The most notable change and major source of GDP fluctuation is still personal consumption as it typically reflects consumer confidence and spending engagement. Personal consumption in the first quarter of 2021 rose to a positive 7.4%, up from positive 1.58% the prior quarter. The fact that it was the dominant contributor in the first quarter of 2021—for the first time since Q4 2019—highlights the continued recovery across to the U.S. economy and improved overall market sentiment.
Business investment spending was also up and residential construction, which has been a standout performer over the past two years, grew at a 12.7% annual rate, better than the 10.8% gain first estimated. Those areas of stronger growth were offset, however, by weakness in U.S. export sales, which fell at an annual rate of 2.9%, larger than the 1.1% rate of decline reported last month.
While exports were falling, imports were rising with the U.S. economy emerging from the pandemic recession at a faster pace than initially anticipated. With strong demand from U.S. consumers, imports rose at a 6.7% annual rate in the first quarter. The trade deficit widened in the first quarter and subtracted 1.2% from overall growth. Business inventories were also drawn down in the first quarter as companies were not able to keep up with rising demand. The drop in inventories subtracted 2.8% from first-quarter growth. However, that should translate into stronger growth in the second quarter as businesses work to restock empty store shelves.
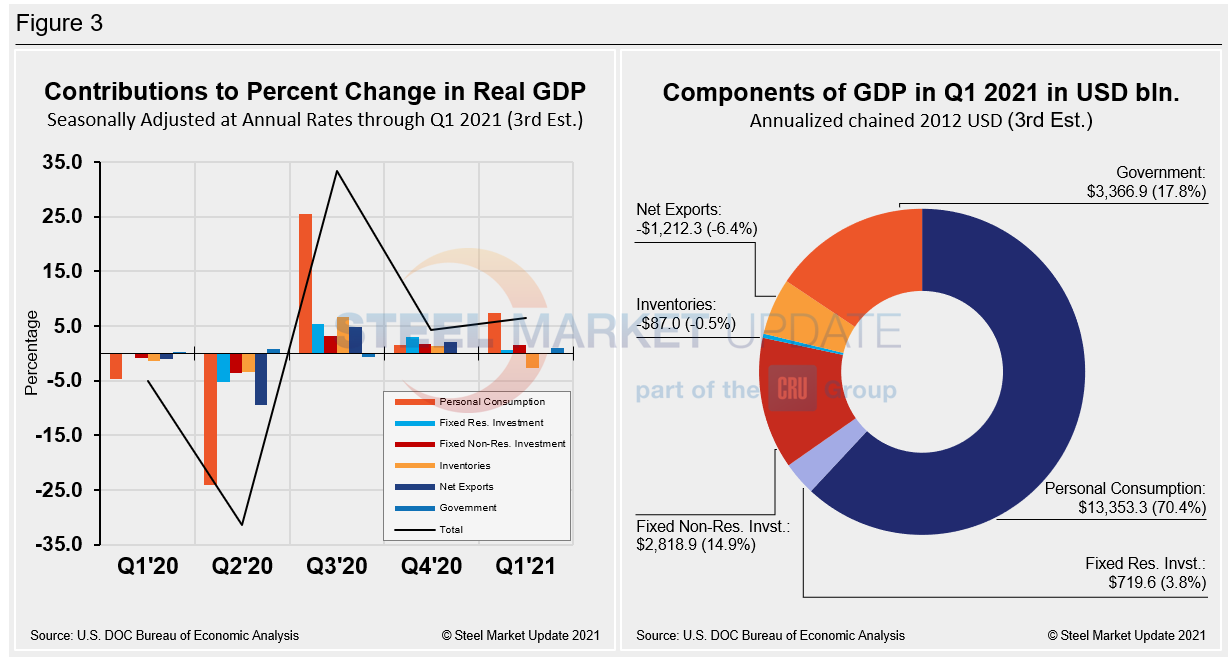
Quarterly contributions of the six major subcomponents of GDP since Q1 2020 and the breakdown of the $22.06 trillion economy in BEA’s second estimate of Q1’s GDP are both shown in Figure 3. The chart on the left is detailed out for cross-comparison with Figure 1 above. The chart on the right shows how personal consumption was the biggest contributor to the recovery in Q1.
SMU Comment: The 6.4% GDP growth confirmed in BEA’s Q1 2021 second estimate continues to point towards a full recovery as the economy distances itself from the worst of the pandemic. Despite the growth and speculated increase for Q2, the long-term impact of the global pandemic remains to be quantified.
By David Schollaert, David@SteelMarketUpdate.com


