

Market Data

June 30, 2021
GDP Growth Firm at 6.4% in Q1’s Final Revision
Written by David Schollaert
U.S. GDP grew by 6.4% in the first quarter of 2021 on an annualized basis, according to the Bureau of Economic Analysis’ (BEA) third and final revision. The third revision saw no change in overall GDP compared to the advance and second estimates; however, upward revisions to nonresidential fixed investment, private inventory investment, and exports were offset by an upward revision to imports, which are a subtraction in the calculation of gross domestic product.
The economy’s progress in Q1 was the second-fastest pace of growth since Q2 2003 and was exceeded only by the rally that erupted during initial pandemic re-opening efforts in Q3 last year. This growth is an acceleration from the 4.3% real GDP increase seen in Q4 2020, setting the stage for what economists believe may be the strongest year for the economy in nearly seven decades. The recovery from last year’s deep recession gained steam at the beginning of this year, helped by mass COVID vaccination efforts and trillions of dollars in government assistance.
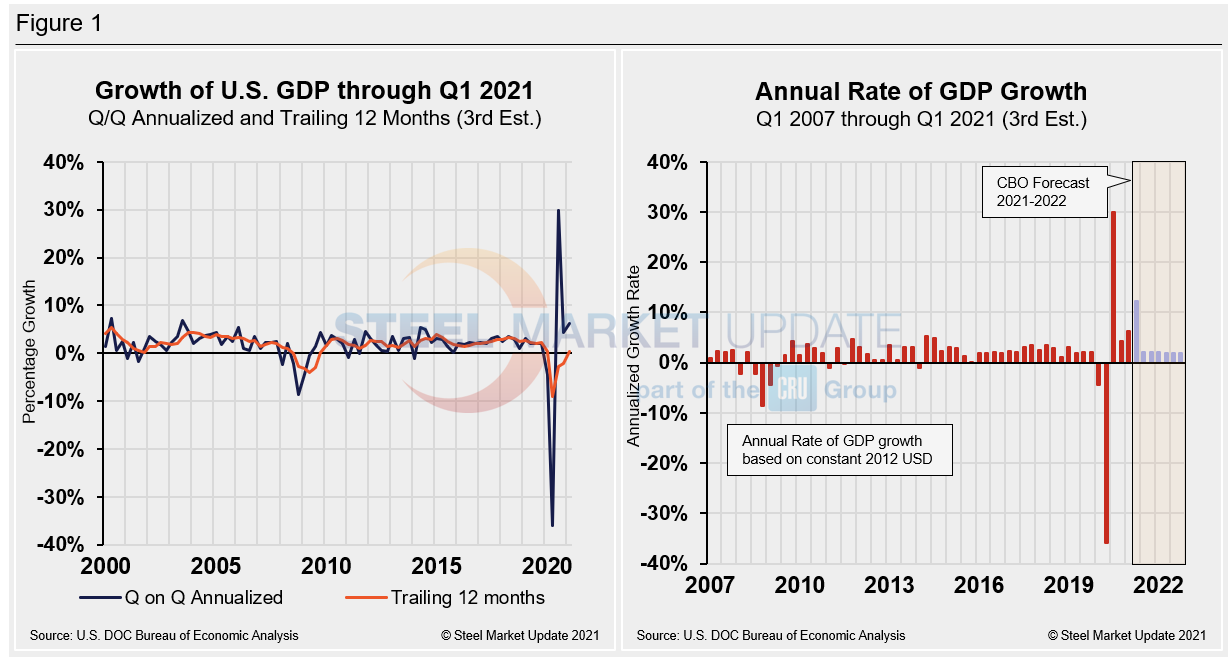
The Department of Commerce’s third and final look at U.S. GDP showed that first-quarter GDP totaled $22.06 trillion. Consumer spending, which accounts for more than two-thirds of economic activity, grew at a sizzling annual rate of 11.4% or a $566.8 billion increase from the previous quarter, exceeding the initial 10.7% estimate. Below in Figure 1 is a side-by-side comparison of the growth of U.S. GDP and the annual rate of GDP, both through Q1 2021. On a trailing 12-month basis, GDP was up by 0.40% in Q1, a positive swing from a negative 2.22% in Q4, and a vast improvement from negative 9.04% in Q2 last year at the height of the pandemic. In the same period in 2020, the trailing 12-month growth rate was slightly higher at a positive 0.44%. For comparison, the average in 43 quarters since Q1 2010 has been a growth rate of 1.96%. The blue line in the same chart shows the progress of the trailing 12-month result since Q1 of 2000. The chart on the right details the headline quarterly results since Q1 2007 including the Congressional Budget Office’s GDP projection through 2022.
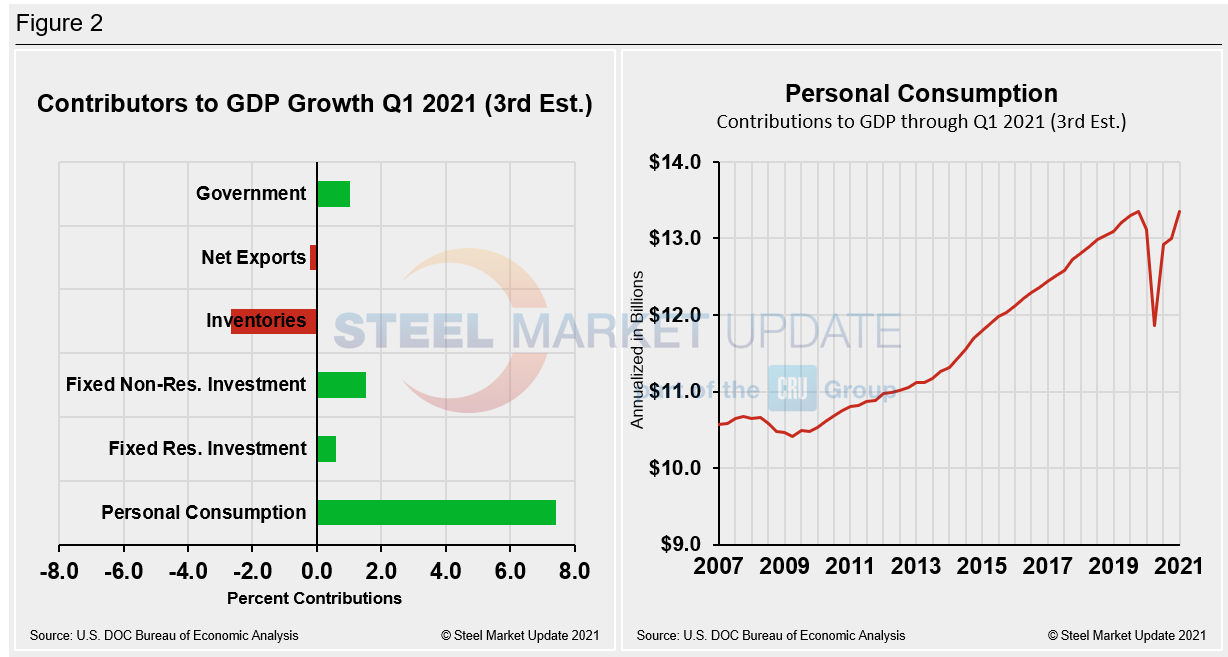
Shown below in Figure 2 is a side-by-side comparison of two charts. On the left is the mix of the six major contributory components in the GDP growth calculation, while the chart on the right puts a spotlight on personal consumption. The most notable change and major source of GDP fluctuation is still personal consumption as it typically reflects consumer confidence and spending engagement. The first-quarter spending gain reflected increases in goods purchases, led by auto sales, and gains in spending on services, led by food services and travel accommodations–two areas that have benefited greatly from the re-opening of the economy as vaccinations have increased. Personal consumption in the first quarter of 2021 rose to a positive 7.42%, up from positive 1.58% the prior quarter. The fact that it was the dominant contributor in the first quarter of 2021—for the first time since Q4 2019—points towards improving sentiment and continued recovery across to the U.S. economy.
Business investment was also up. And residential construction, which has been a standout performer over the past two years, grew at a 12.7% annual rate, better than the 10.8% gain first estimated. Those areas of stronger growth were offset by weakness in U.S. export sales, however, which fell at an annual rate of 2.9%, larger than the 1.1% rate of decline reported last month.
While exports were falling, imports were rising, with the U.S. economy emerging from the pandemic recession at a faster pace than initially anticipated. With strong demand from U.S. consumers, imports rose at a 6.7% annual rate in the first quarter. The trade deficit grew in the first quarter, subtracting 1.5% from growth as a recovering U.S. economy attracted rising imports while U.S. exporters struggled with weaker overseas demand. Business investment grew at a strong 11.7% rate, better than the previous estimate of 10.8% growth, while government spending increased at a 5.7% rate, slightly below last month’s estimate of a 5.8% gain.
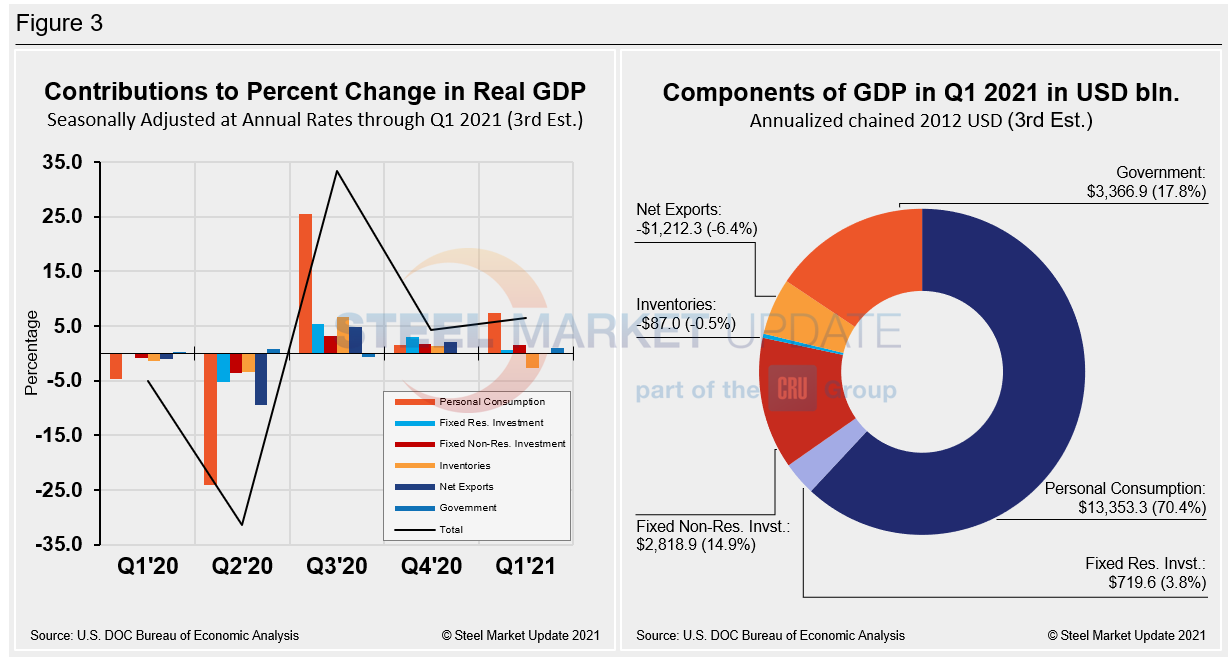
Quarterly contributions of the six major subcomponents of GDP since Q1 2020 and the breakdown of the $22.06 trillion economy in BEA’s second estimate of Q1’s GDP are both shown in Figure 3. The chart on the left is detailed out for cross-comparison with Figure 1 above. The chart on the right shows how personal consumption was the biggest contributor to the recovery in Q1.
SMU Comment: The 6.4% GDP growth confirmed in BEA’s final review of Q1 2021 points to a nation that has quickly regained its footing from the global pandemic. Current estimates speculate that GDP growth in Q2 could surge to an annual rate of 12% and growth for the entire year could come in at 7.5%. That would be the best annual performance since 1951. Even the most conservative estimates still forecast 2021 growth ranging between 6% and 7%—the best growth since a 7.2% gain in 1984. All eyes will be on Q2’s advance estimate from the Department of Commerce, roughly a month from now.
By David Schollaert, David@SteelMarketUpdate.com


