

Market Data

May 12, 2022
March Shipments and Supply of Steel Products
Written by David Schollaert
Total mill shipments of steel products recovered in March following repeated declines at the start the year. March’s mill shipments totaled 8.342 million tons, a 9% increase from February’s 7.655 million tons. Apparent supply also surged in March, up 12.9% versus the prior month, and expanding for the first time in three months.
This analysis is based on steel mill shipment data from the American Iron and Steel Institute (AISI) and import-export data from the US Department of Commerce (DOC). The analysis summarizes total steel supply by product from 2008 through March 2022 and year-on-year changes.
The supply/demand differential was still shifting in March (supply still topped demand) but at a slower pace. In March, apparent supply (domestic shipments plus imports) grew by nearly 13% – driven by a 31.5% surge in imports – month-on-month (MoM). But exports were up too. The arrival of foreign steel grew by more than 17% over the same period – reaching its highest total in nearly five years.
Domestic mill utilization averaged 79.8% through March, down roughly 0.5% versus February’s total amid rising lead times. (Lead times at the time averaged just over five weeks.) Though supply still outpaced demand, prices surged as concerns over raw material readiness grew due to Russia’s invasion of Ukraine.
SMU’s benchmark hot-rolled coil price rose by more than $400 per net ton ($15 per cwt) in March. HRC prices ended the month at average of $1,435 per ton FOB mill, east of the Rockies. Prices gained momentum throughout the month after averaging $1,000 per ton – with some inputs well below that level – as of March 1.
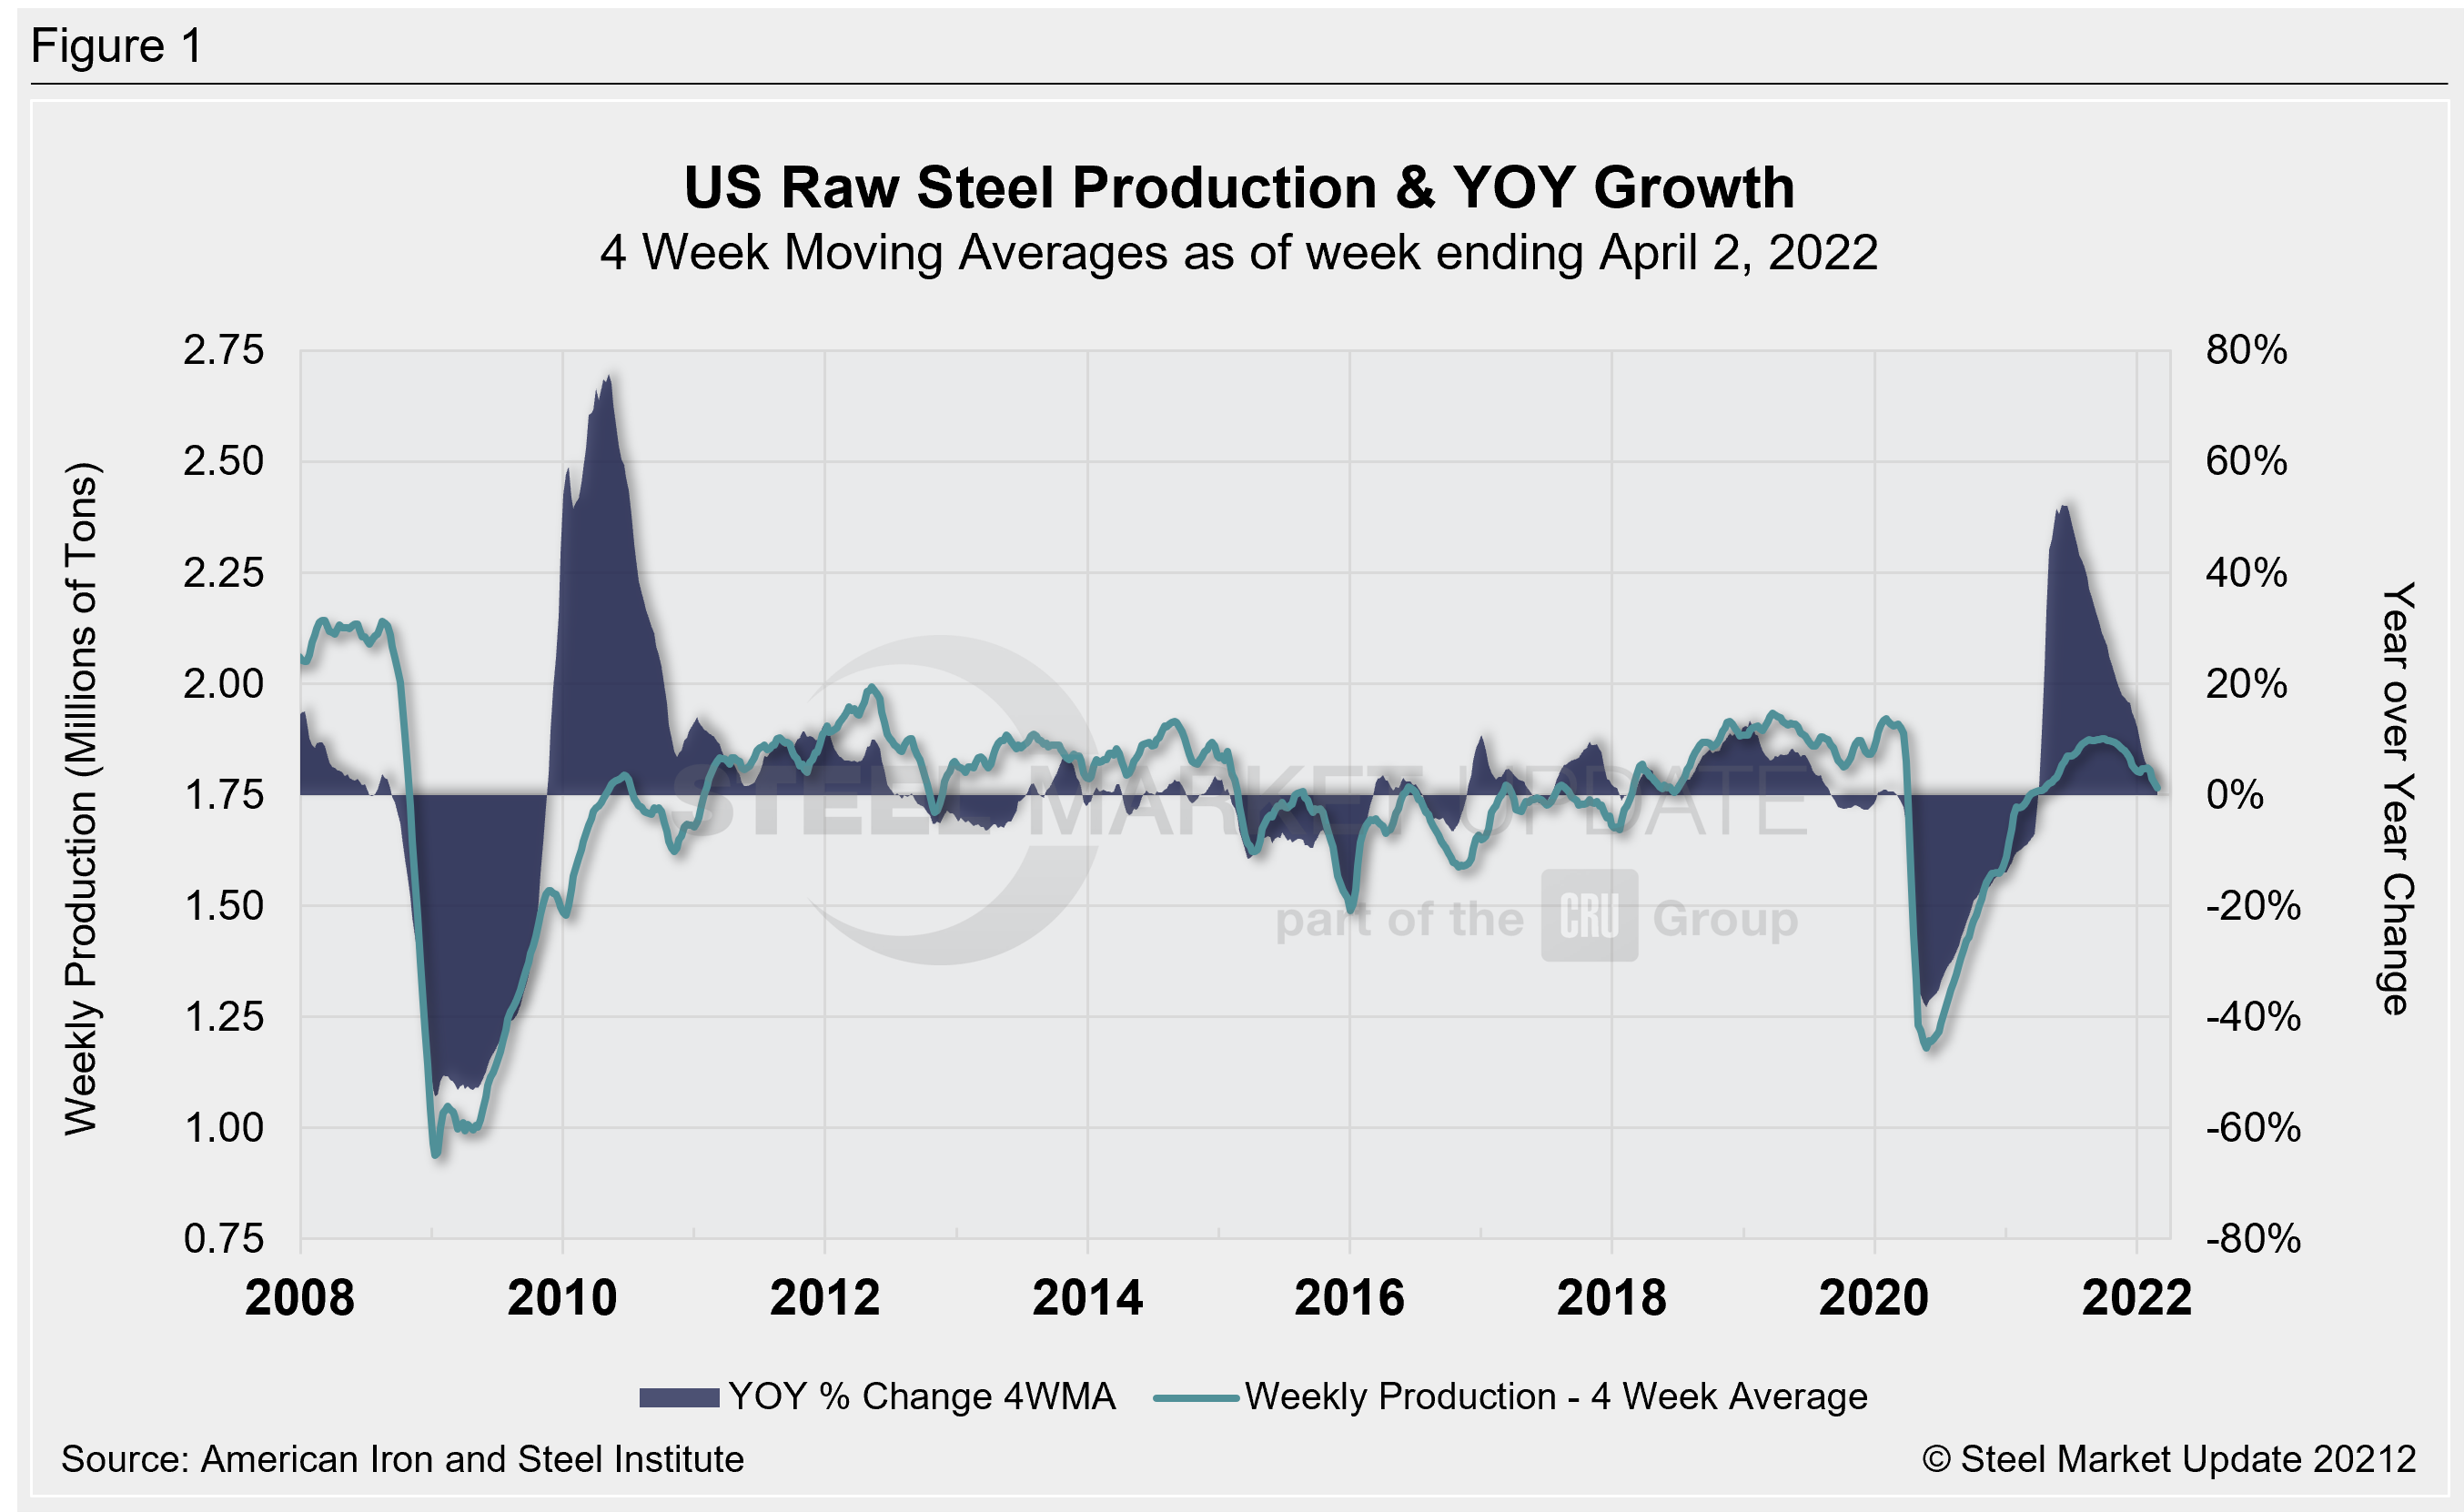
The price dynamic reflected uncertainty stemming from the war in Ukraine and the subsequent sanctions against Russian enterprises. Prices reached an inflection point in mid-April, peaking at $1,480 per ton. They have since begun to slide and now stand at $1,365 per ton, according to SMU’s latest check of the market on May 10. Raw steel production, shown below in Figure 1, is based on weekly data from the AISI. It is displayed here as four-week moving averages through Feb. 26, 2022.
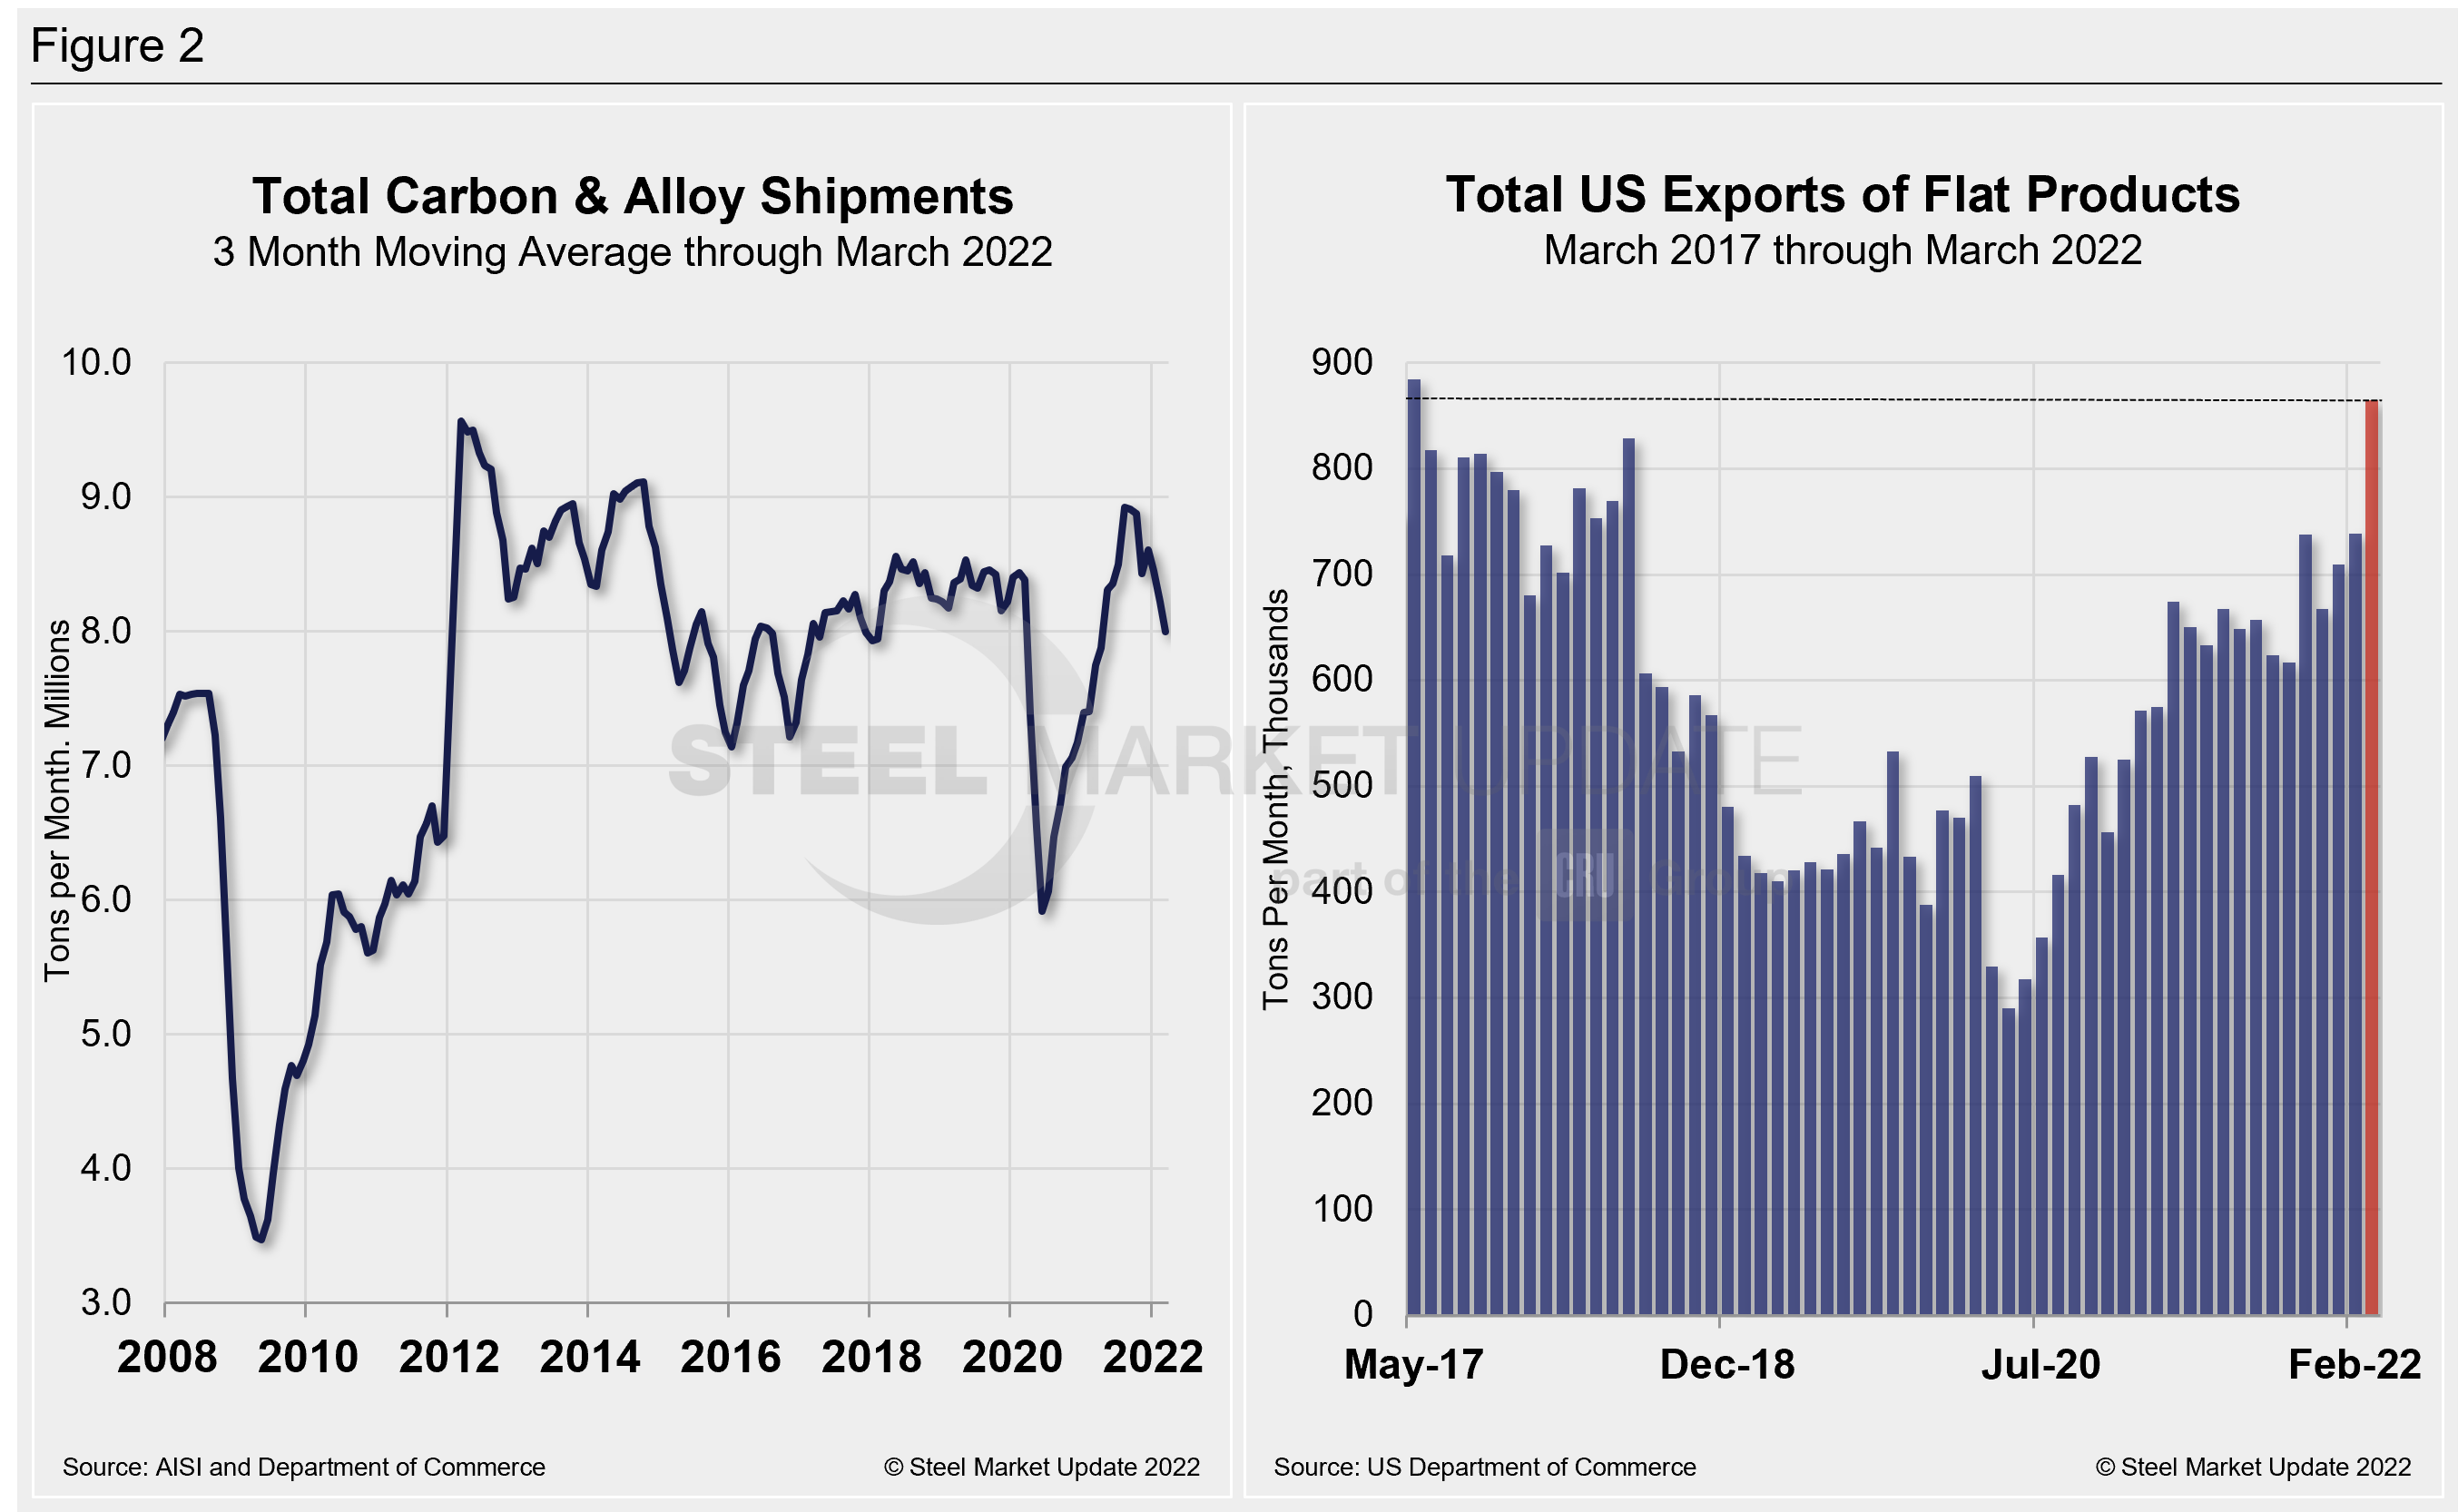
Monthly shipment data for all rolled steel products and exports are noted in Figure 2. Measured as a three-month moving average (3MMA) of the monthly data, March’s total was 7.997 million tons, down 2.7% versus 8.219 million tons in February. March also marked the fifth decline in five months for the 3MMA analysis. Shipments were up just 3.2% in March versus the year prior, when shipments were 7.749 million tons. The recovery from Covid-related shutdowns nearly two years ago was meaningful. But March’s shipments fell below the pre-pandemic period in 2020 by 4.6%.
All rolled product exports totaled 864,559 tons in March, up 17% MoM and nearly 30% versus the same year-ago period. 2021. March’s total is the highest export mark since May 2017, when the US exported a total of 884,314 tons.
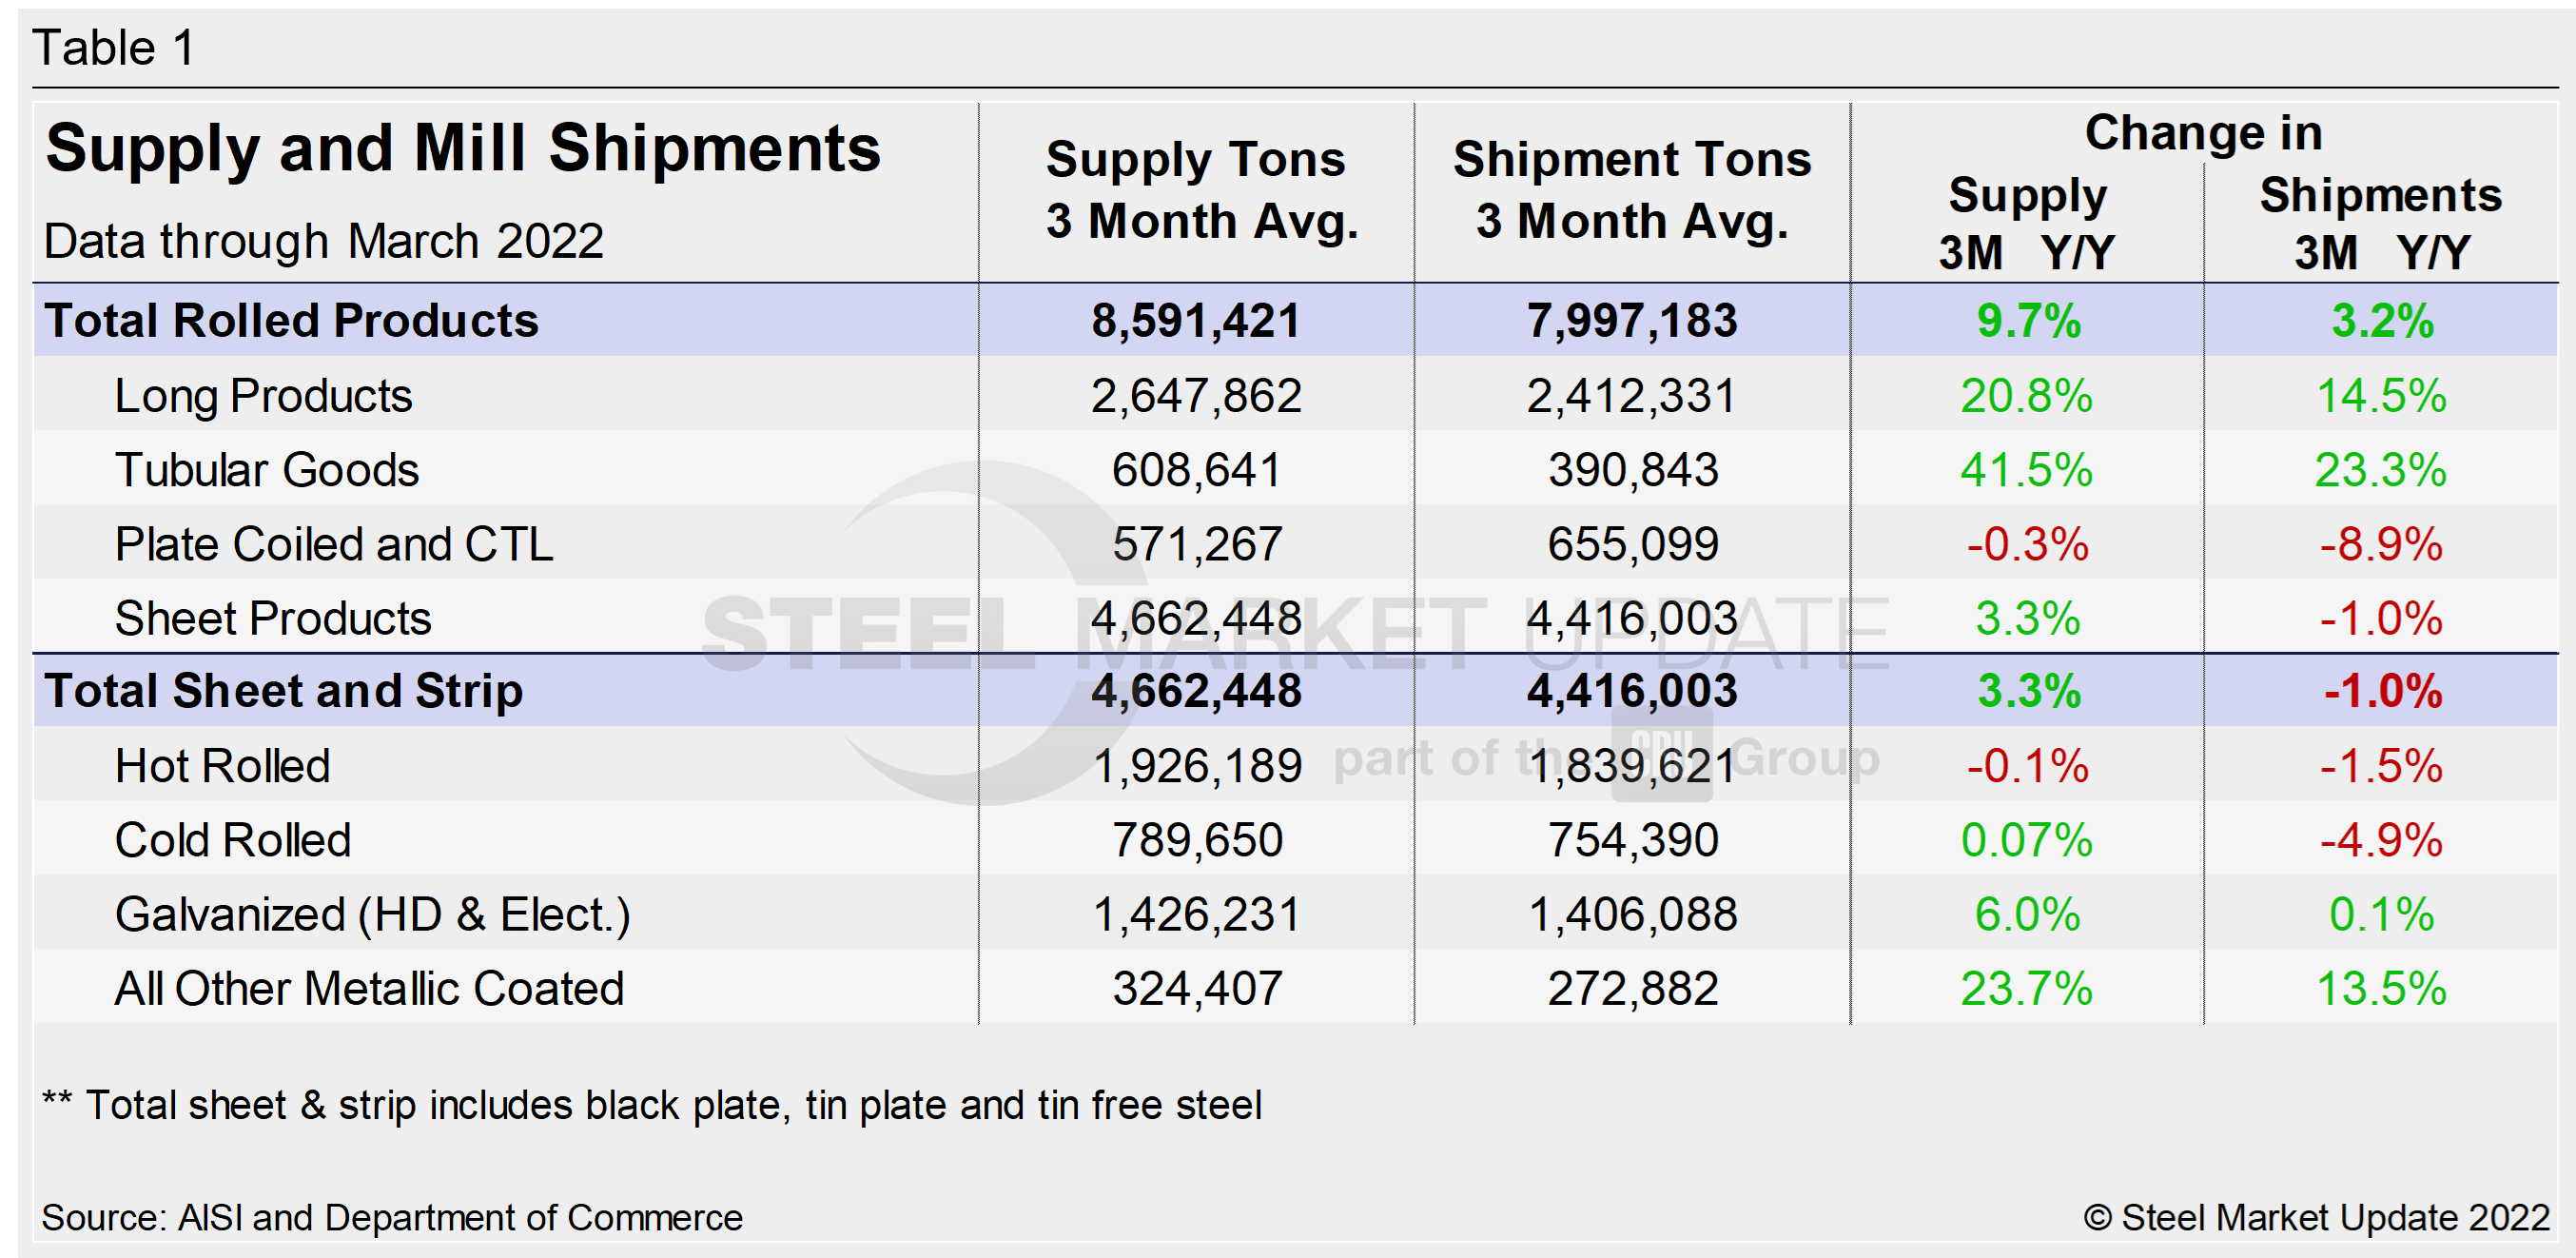
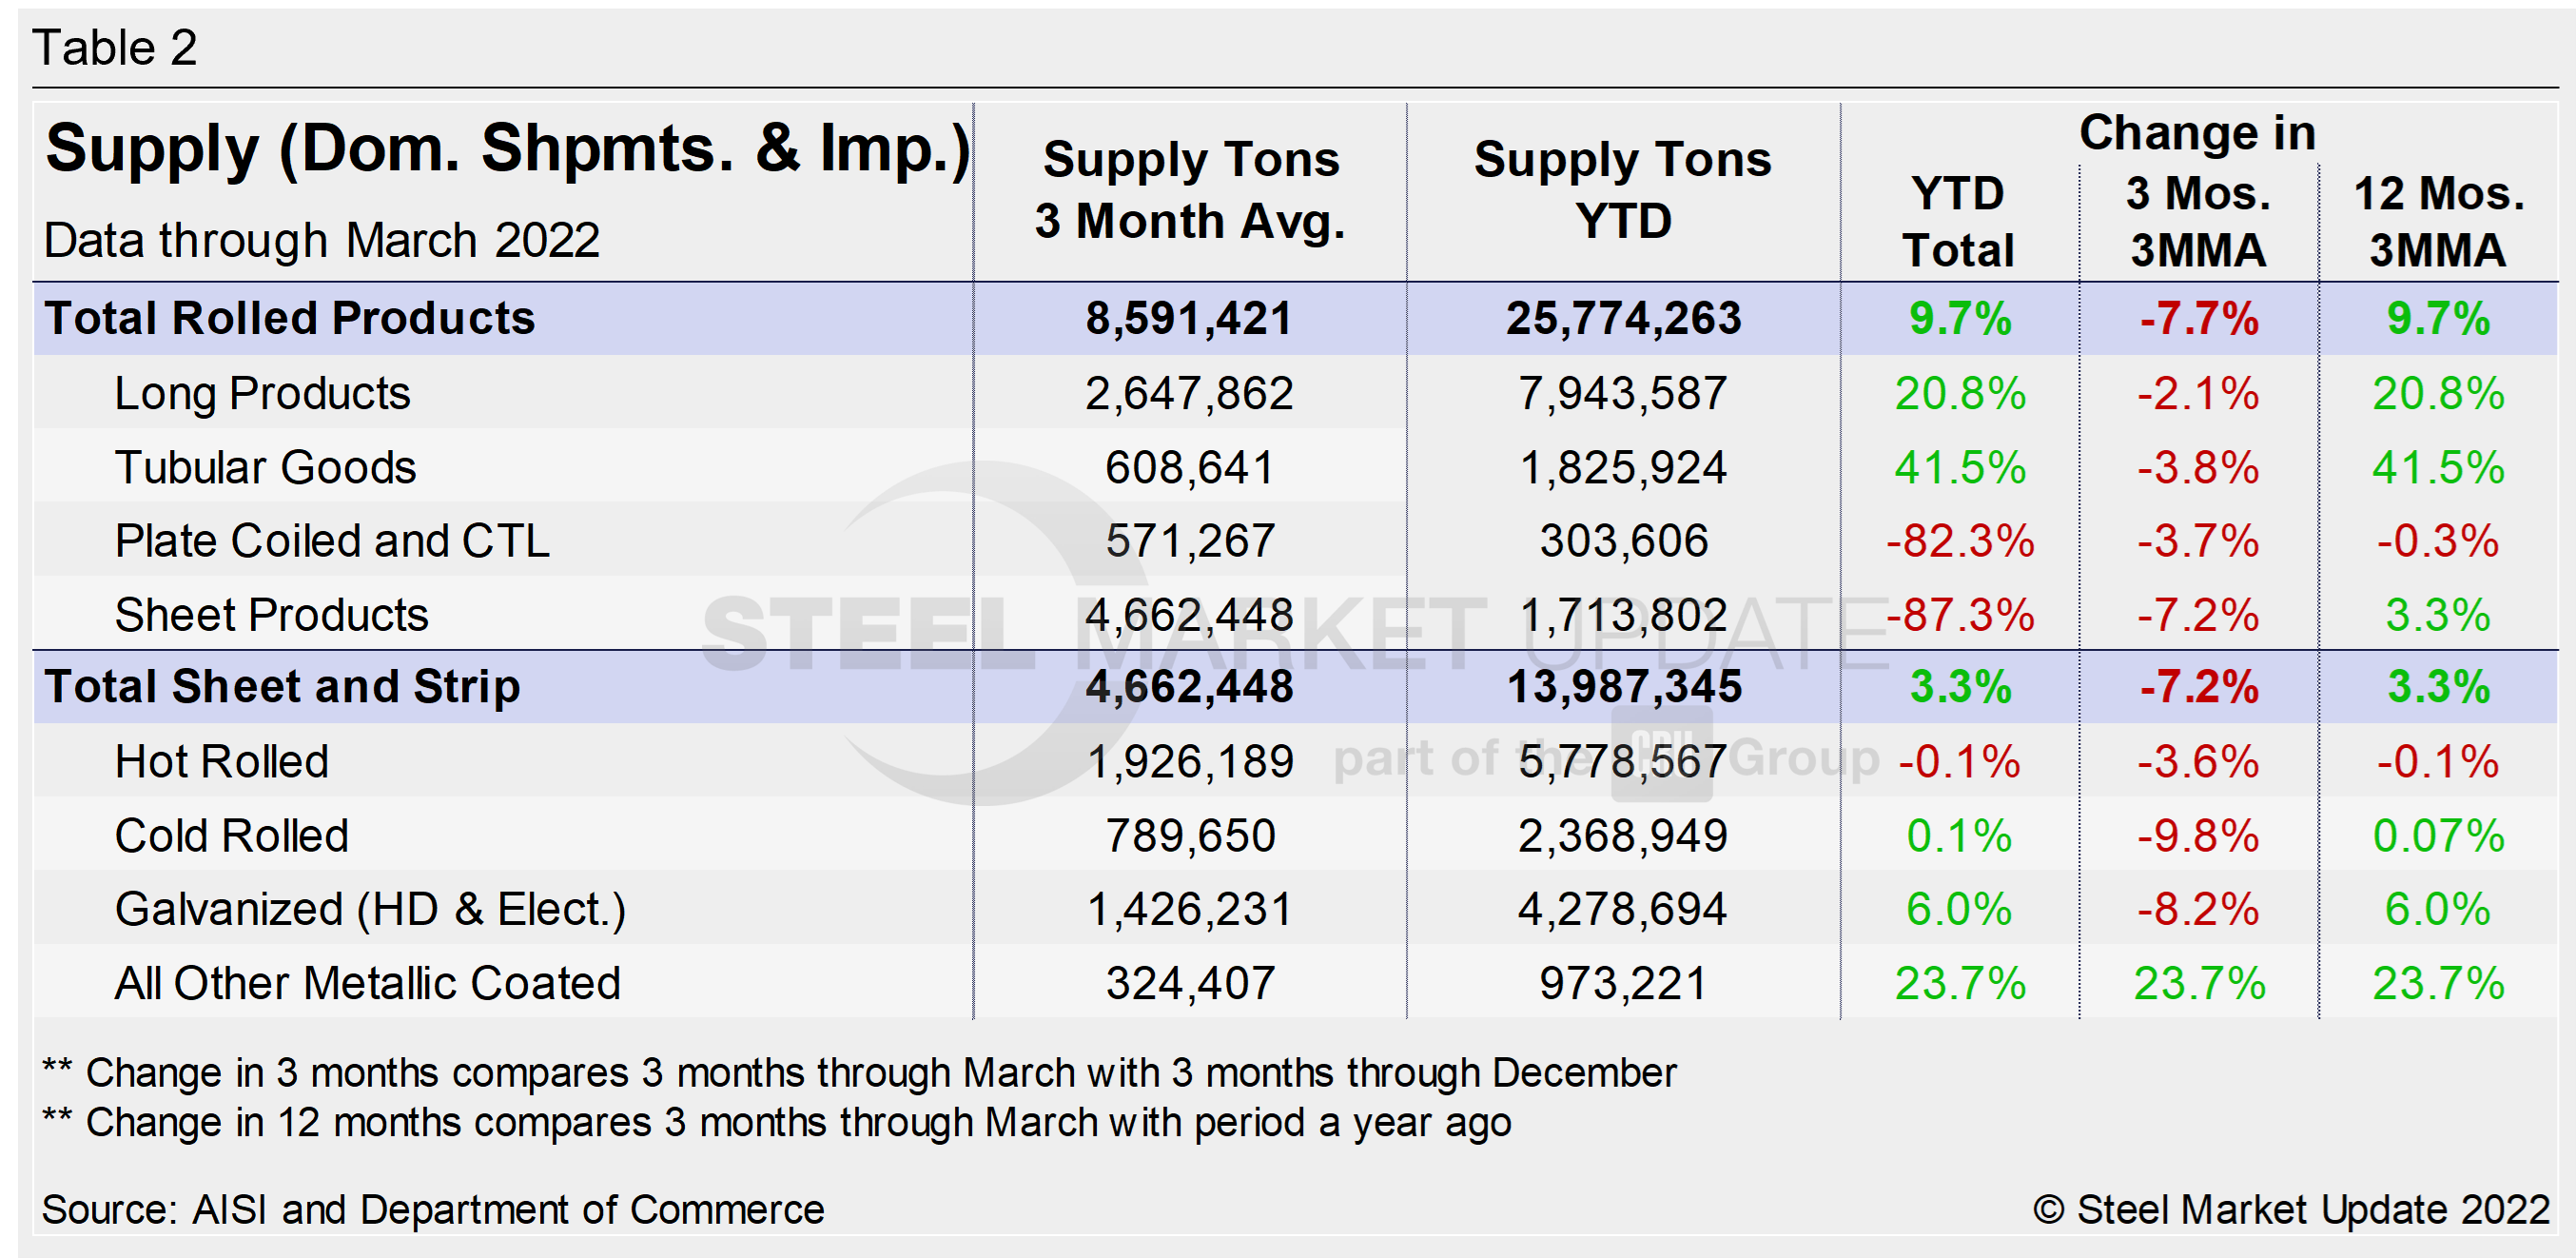
Shipment and supply details for all product groups and individual sheet products are noted in Table 1. Domestic supply (shipments and imports) is shown in Table 2. Total supply (a proxy for market demand) as a 3MMA was up year-on-year (YoY) in March, a big turnaround from the 9% decline the year prior – when the market was still working its way out early pandemic-related disruptions.
Apparent supply is defined as domestic mill shipments to domestic locations plus imports. Mill shipments were also up, a reversal from a decrease of 7.5% seen during the year-ago period in the same 3MMA comparison. The recovery has varied significantly among various products. But it should remain up due to steady domestic output, especially if foreign material continues to make its way to US ports at current or similar rates.
Total sheet and strip apparent supply is up year to date (Table 2) compared to 2021, but down 7.2% over the past three months. Total rolled product apparent supply is also up over the same year-ago period but is trending down on a three-month moving average basis. Note that year-over-year comparisons have seasonality removed.
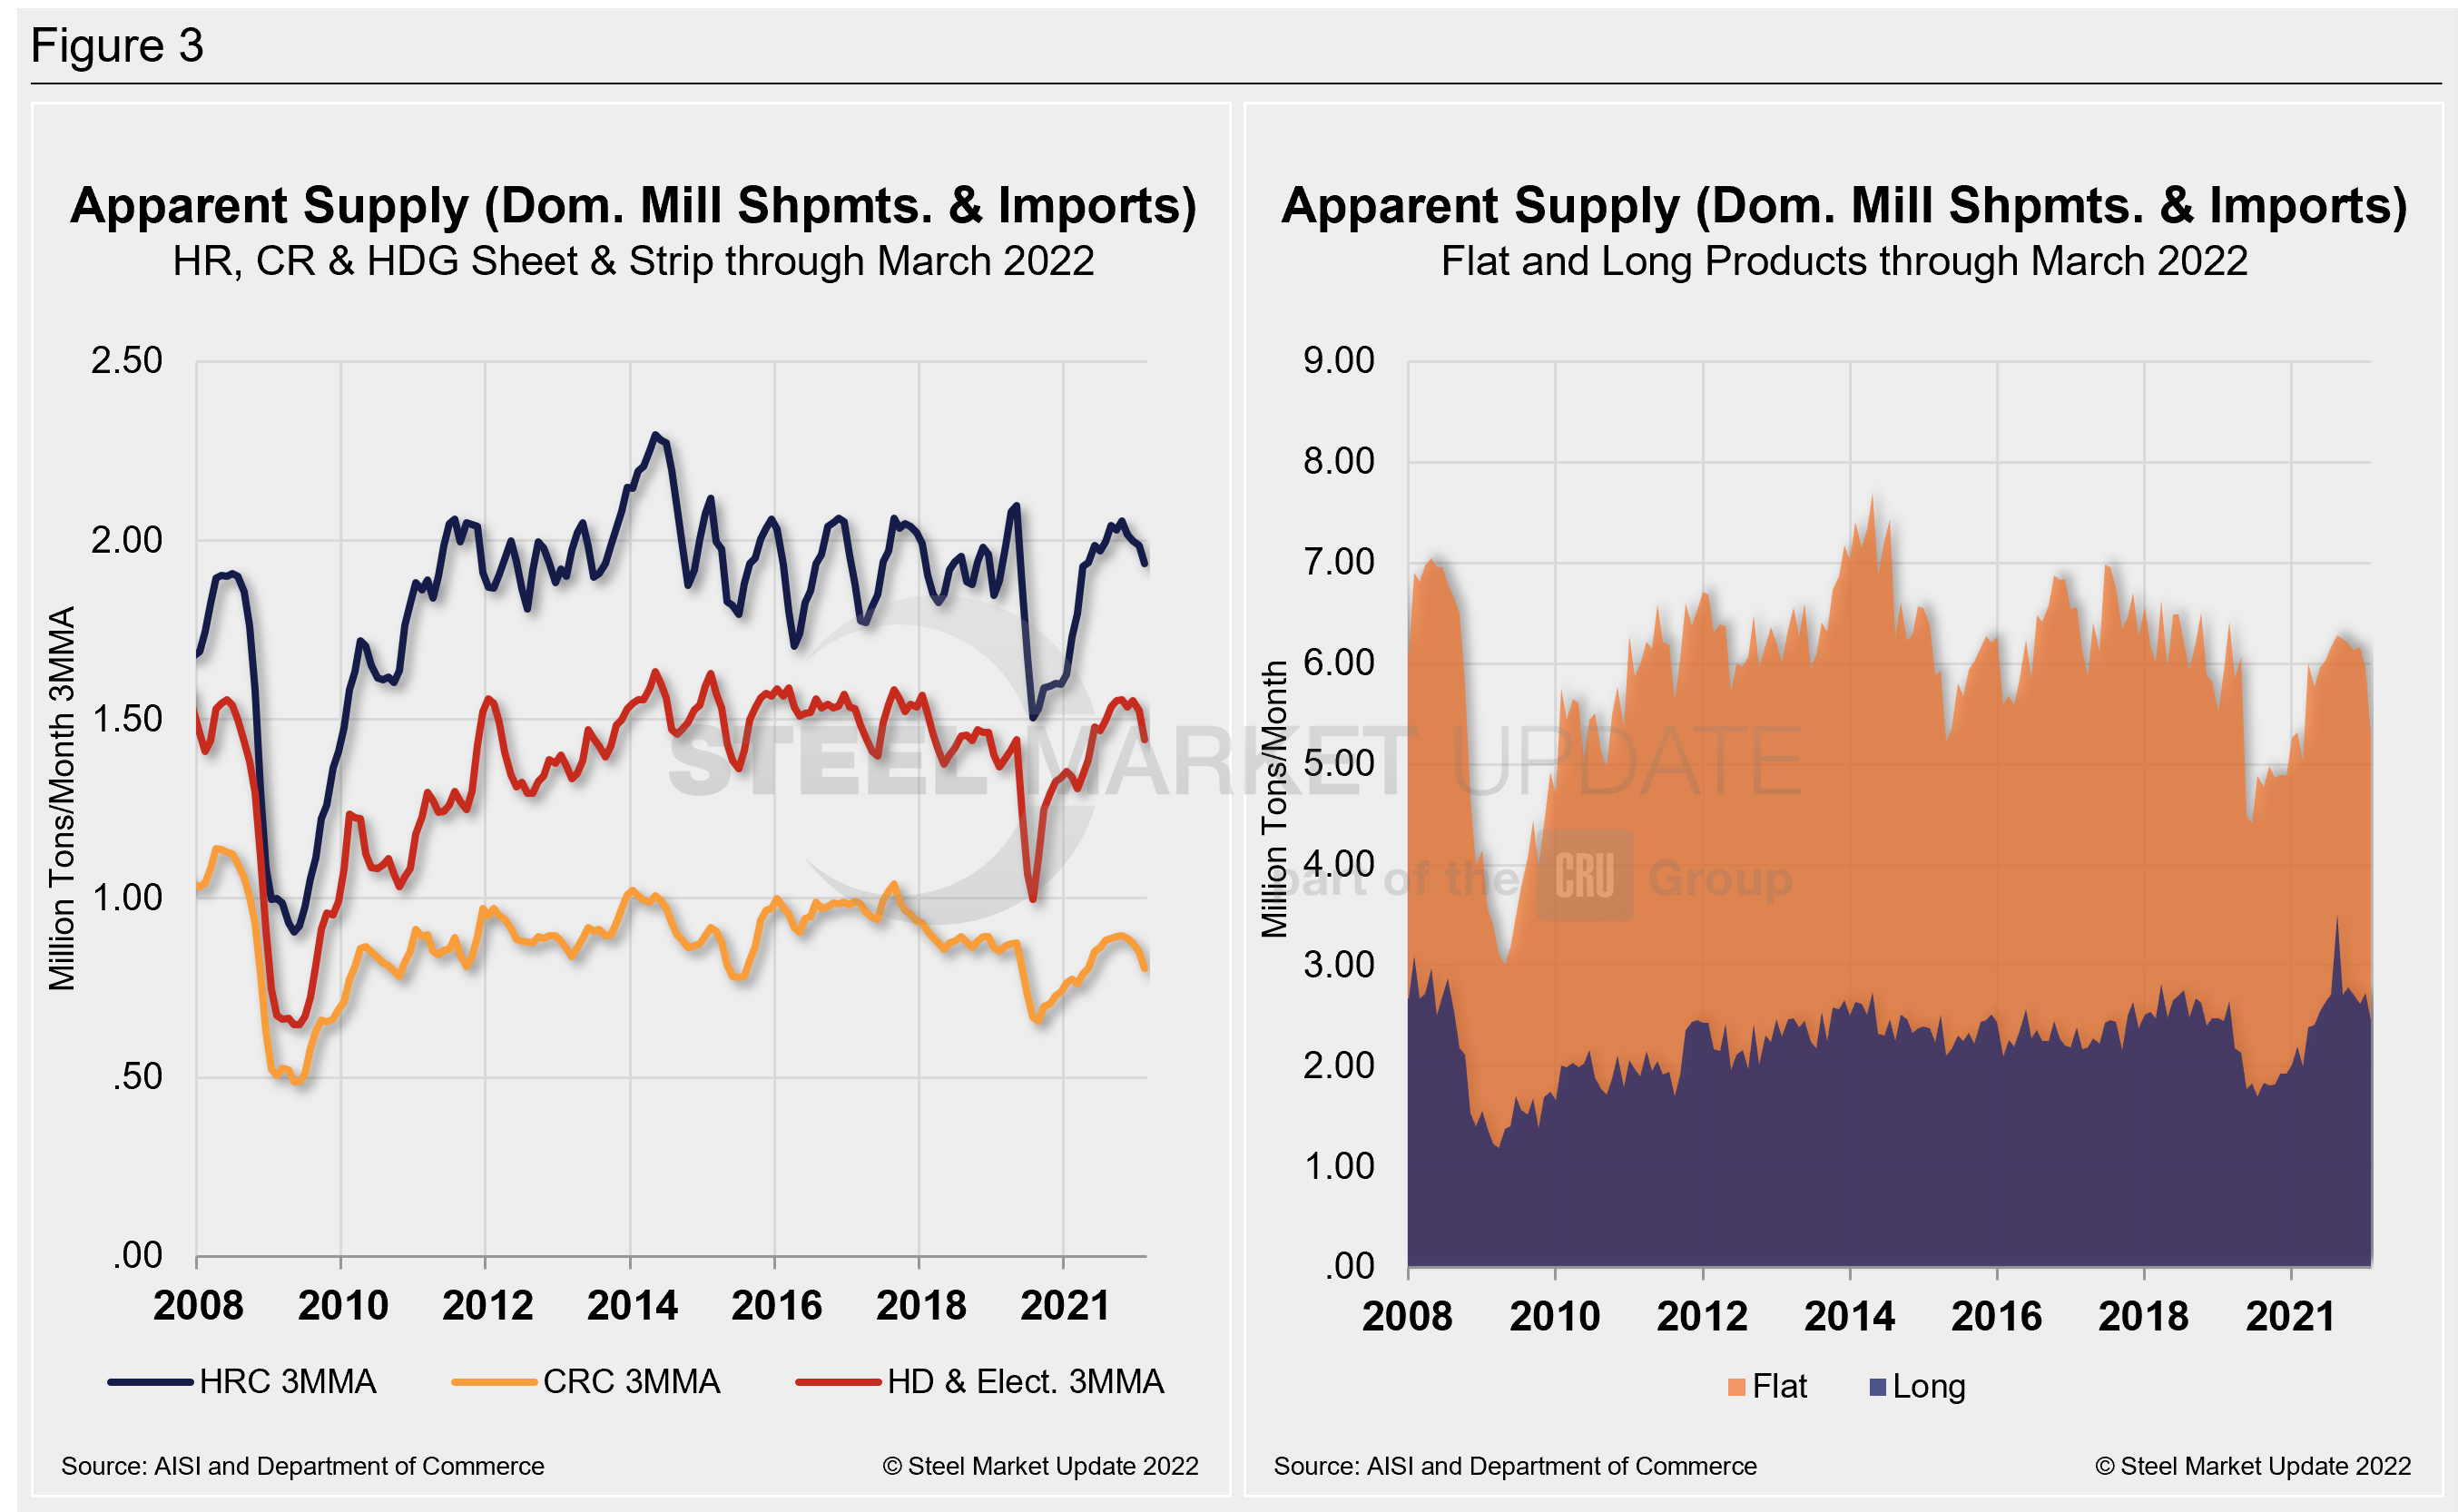
The supply picture for HRC, CRC and HDG since August 2008 as three-month moving averages versus the long-term comparison between flat and long products is shown side-by-side in Figure 3. On the left chart, all three sheet products are displayed. They have experienced some improvement since mid-2020 but are nonethless trending down of late. When compared to the same pre-pandemic period in 2020, all there are down. Supplies of cold rolled have seen the largest percentage decline (-9.7), followed by hot rolled and galvanized (hot dipped and electrolytic), down 8.2% and 1.2%, respectively, from the same pre-pandemic period in 2020. In the right chart, note that these are monthly numbers (not 3MMAs), which show the trend difference between longs and flat products including plate.
By David Schollaert, David@SteelMarketUpdate.com


