Analysis

May 31, 2022
New and Existing Home Sales Dip in April
Written by Brett Linton
Sales of new and existing homes retracted in April, now in line with mid-2020 levels, according to recently released data from the US Department of Commerce and National Association of Realtors.
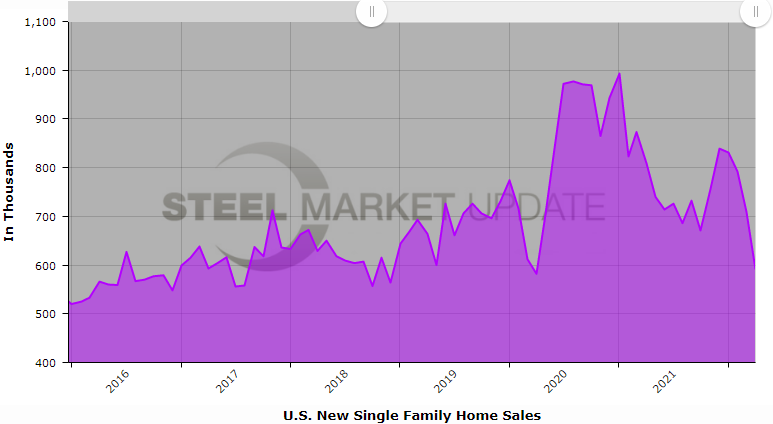
New home sales slipped to 591,000 units in April, down 17% compared to the previous month. The last time new sales were this low was exactly two years ago, in April 2020 when 582,000 units were sold. January 2021 holds the record for the highest monthly sales figure, just shy of 1 million units. One year ago monthly sales were 809,000 units.
Trading Economics reported that new home sales declined in April due to both rising construction and mortgage costs impacting buyers’ affordability. “Sales fell in all regions: the South (-19.8%), the Midwest (-15.1%), the West (-13.8%) and the Northeast (-5.9%). Meanwhile, the median sales price of new houses sold last month was $450,600, much higher than $376,600 a year earlier, while the average sales price was $570,300, up from $434,800. There are now 8.3 months of supply in inventory, almost twice 4.3 months a year earlier .”
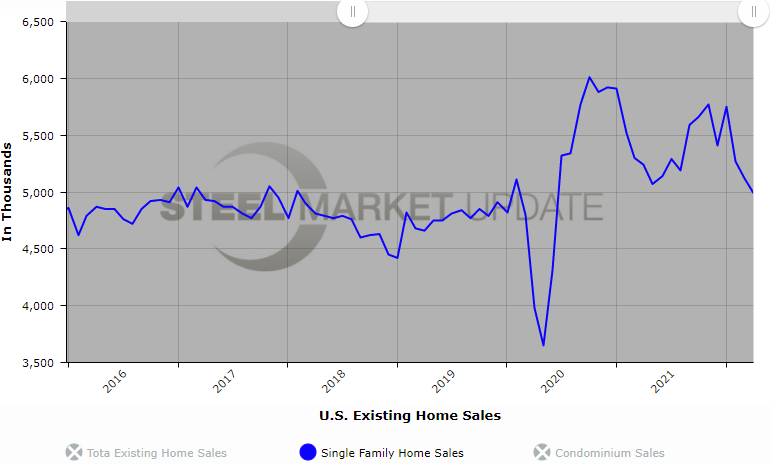
Existing home sales also declined in April, with single family home sales down 3% over March to 4.99 million units. The last time we saw levels this low was June 2020 when 4.31 million units sold. April 2021 saw existing home sales of 5.24 million units, compared to 3.98 million units sold in April 2020.
“Higher home prices and sharply higher mortgage rates have reduced buyer activity,” said Lawrence Yun, NAR’s chief economist. “It looks like more declines are imminent in the upcoming months, and we’ll likely return to the pre-pandemic home sales activity after the remarkable surge over the past two years.”
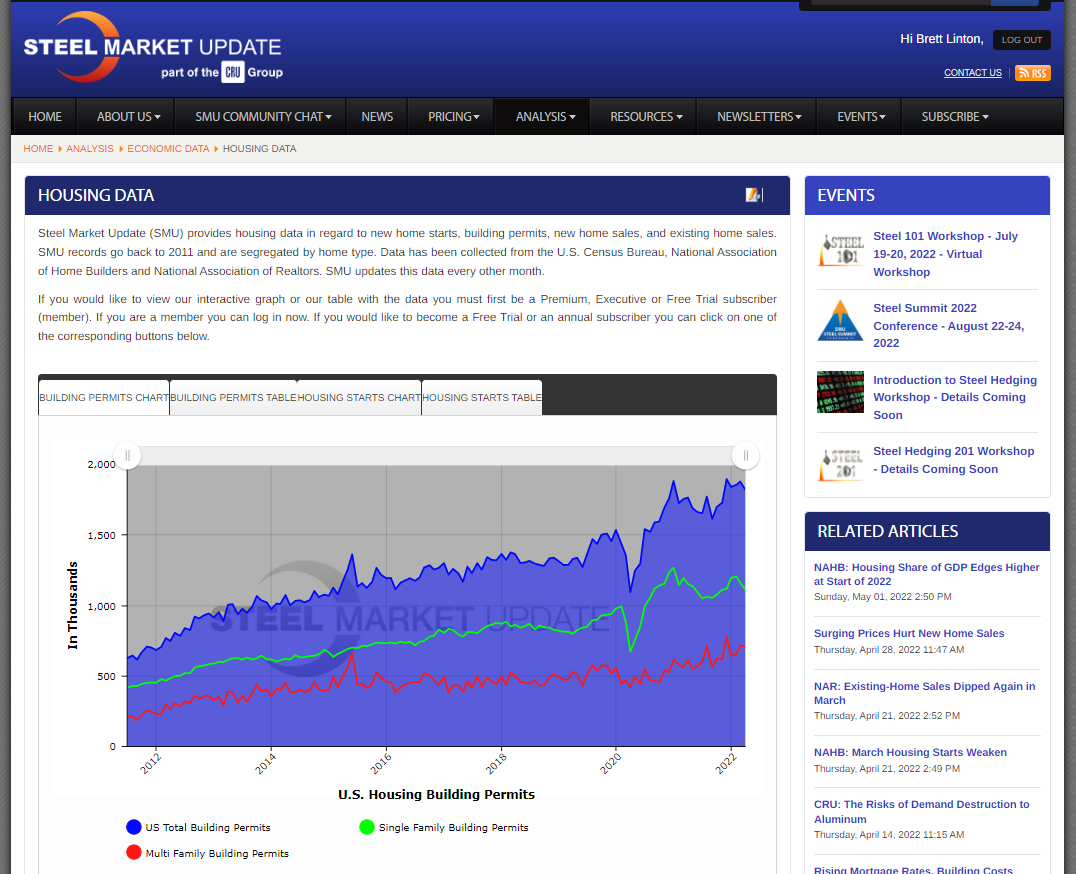
PSA: Did you know that SMU offers an interactive history of multiple housing datasets, available here on our website? In addition to the two home sales charts above, we provide interactive charts and data tables on US building permits and housing starts, both broken out into single and multi-family figures (example below). You can find this Housing Data in the ‘Analysis’ section of our website, under the ‘Economic Data’ sub-menu.
By Brett Linton, Brett@SteelMarketUpdate.com