

Prices
December 9, 2022
SMU Sentiment Index Dips From 5-Month High, But Remains Strong
Written by Brett Linton
After surging in late November to a five-month high, Steel Market Update’s (SMU) Steel Buyers Sentiment Index slipped three points through Dec. 8th. Our Future Buyers Sentiment Index also fell a few points from it’s previous high, down three points in comparison to two weeks prior. Buyers Sentiment remains strong overall, and Current Sentiment is well above where it was just a month ago.
SMU’s Buyers Sentiment Index measures how steel buyers feel about their company’s ability to be successful in the current market, as well as three to six months down the road. Every other week we poll steel buyers about sentiment, with historical data going back to 2008.
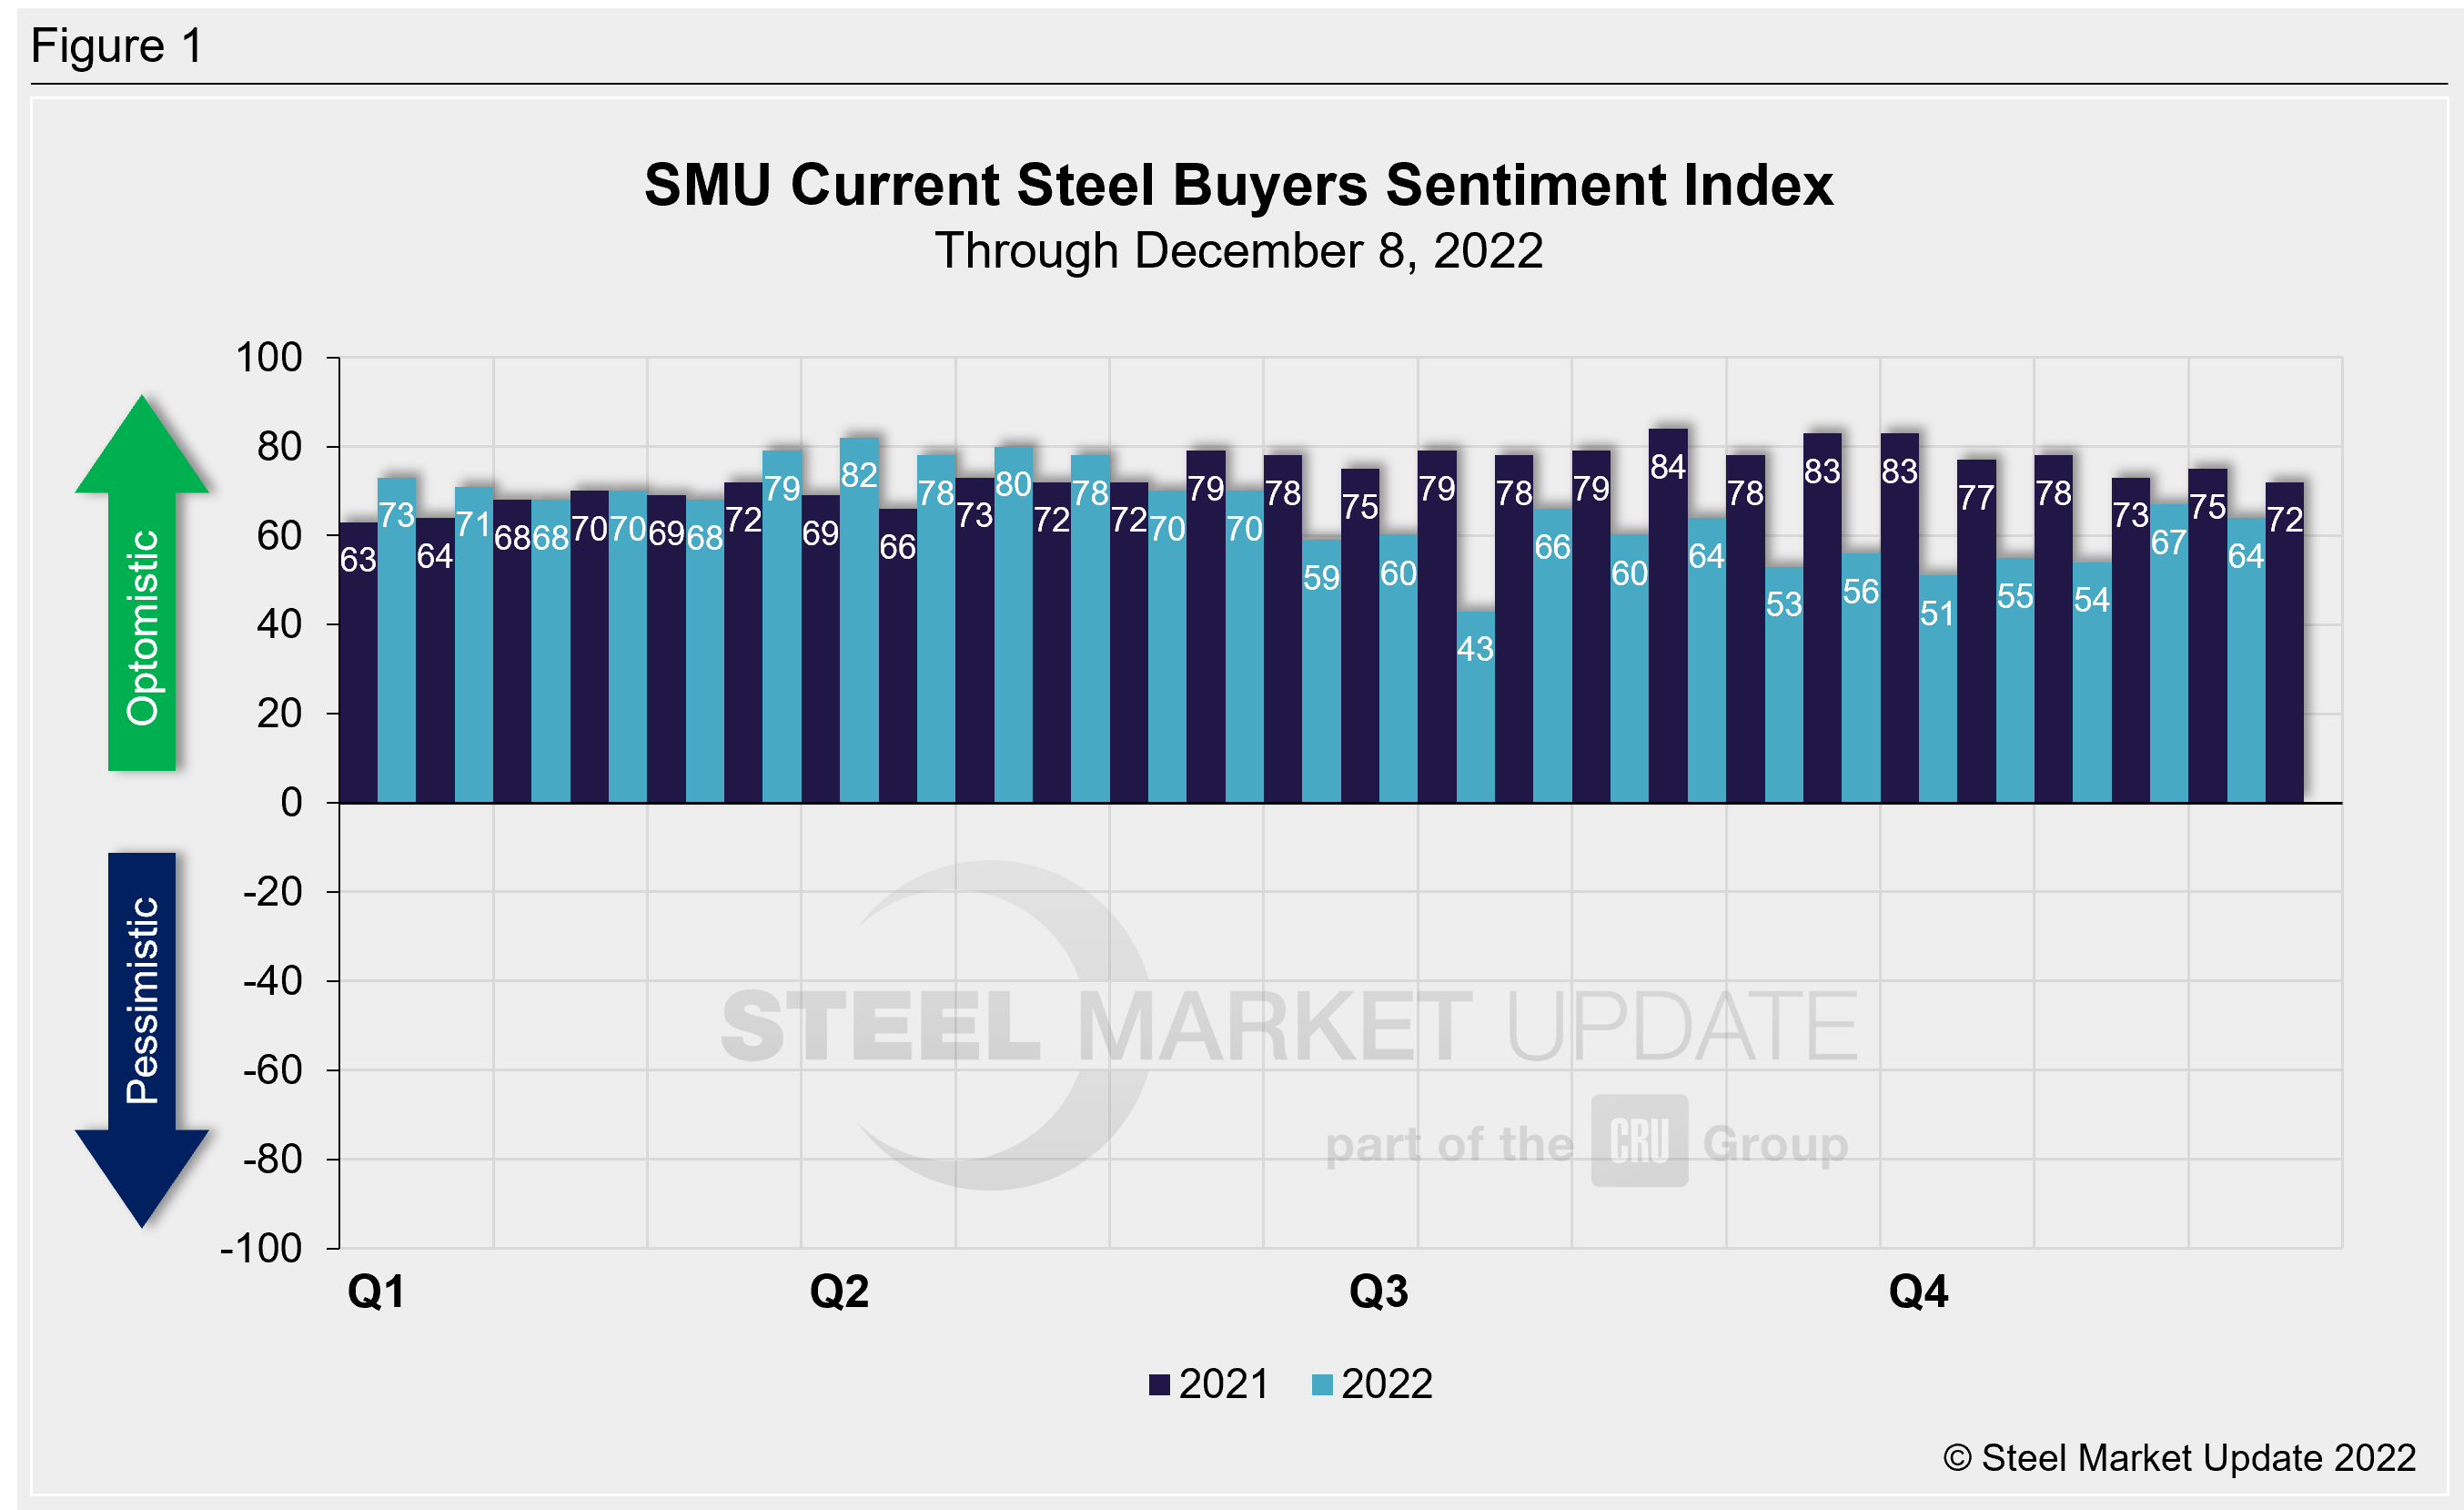
SMU’s Current Buyers Sentiment Index was recorded at +64, down three points from our previous market check, but up 10 points compared to levels one month ago (Figure 1). This is the third highest reading since June, when it had reached +70. Prior to mid-November, Current Buyers Sentiment had bounced around the mid/low +50s for two months. Recall that sentiment briefly slipped to a two-year low of +43 in mid-July, down from a peak of +82 in March.
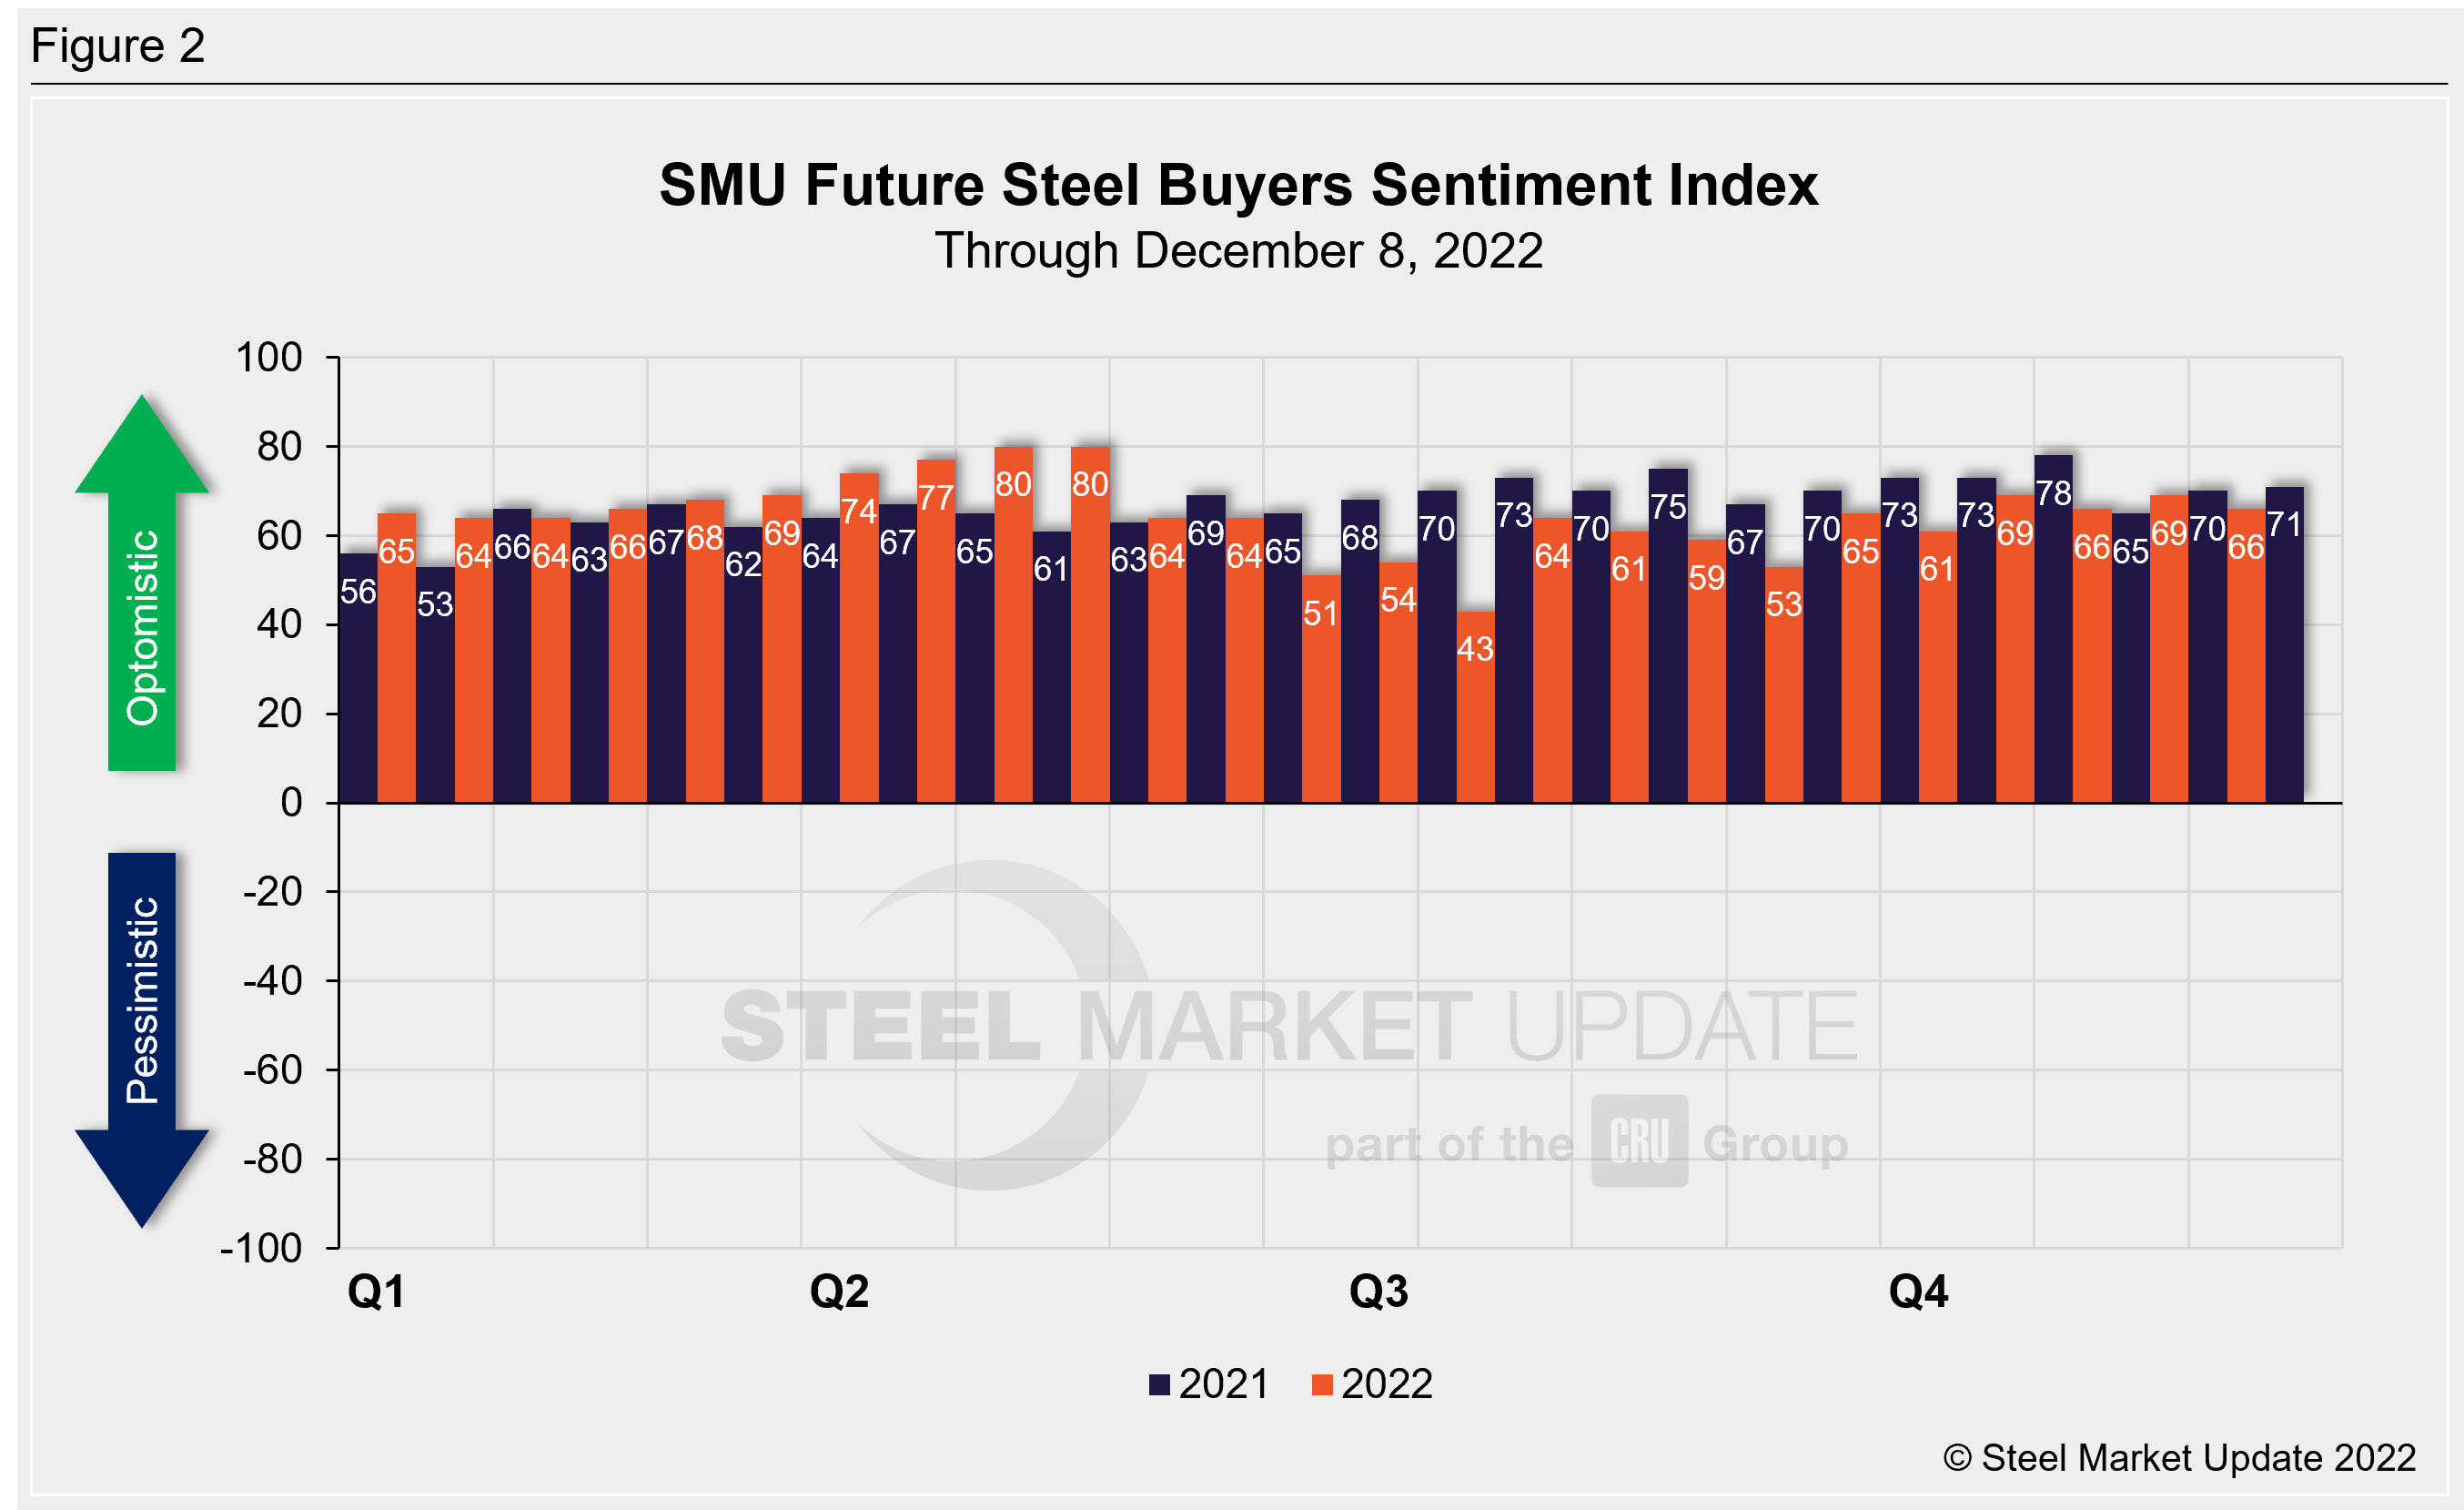
SMU’s Future Buyers Sentiment Index measures buyers’ feelings about business conditions three to six months in the future. Future Sentiment declined three points from our previous survey to +66. Future sentiment is now exactly the same as it was one month ago, tied for the second highest level recorded over the last six months (Figure 2). Recall we saw the highest Future Sentiment readings in our 13.5-year history earlier this year: late April and early May both registered +80. Then in mid-July, Future Sentiment fell to a nearly two-year low of +43.
Recall that as steel prices peaked in September 2021, Current Sentiment reached an all-time high of +84. Future Sentiment peaked two months later at +78. The lowest levels over the past decade both occurred in April 2020, at -8 and +10 respectively.
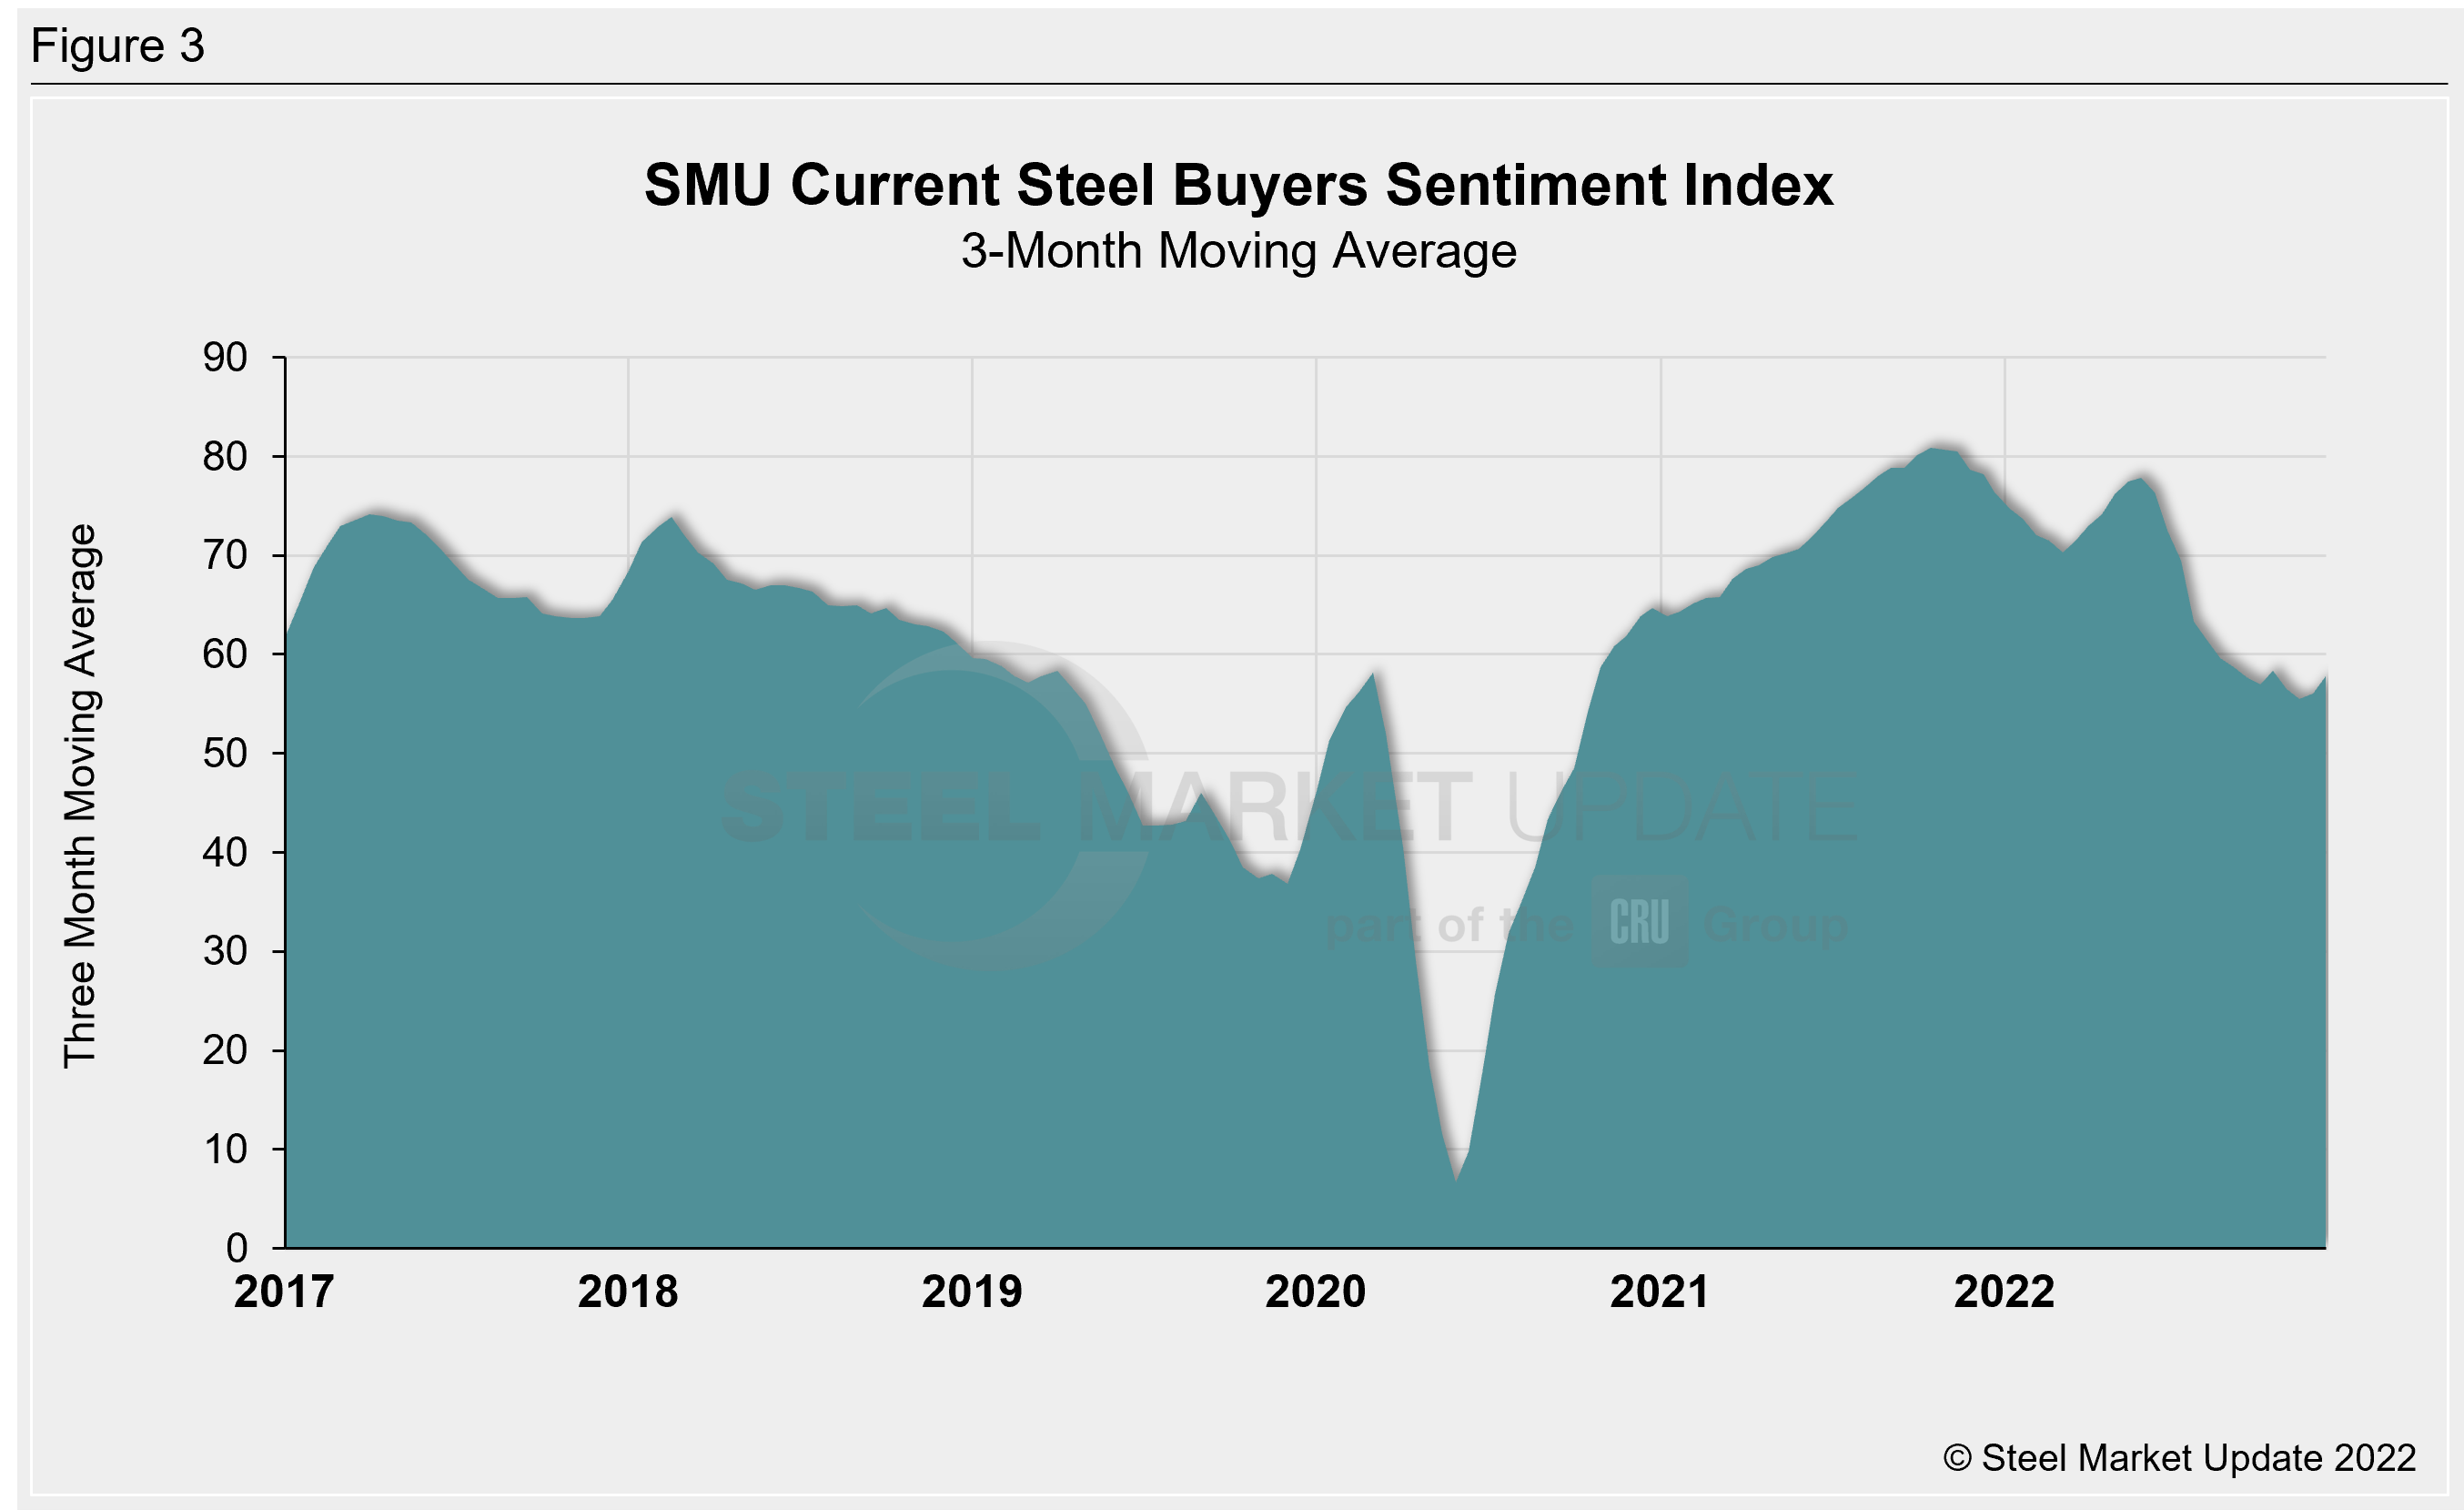
Measured as a three-month moving average, the Current Sentiment 3MMA rose nearly two points to +57.83 this week. This measure had trended downward between May and November. It’s possible we’re seeing the beginning of rebound now (Figure 3). One month ago, we saw a Current Sentiment 3MMA of +55.50, the lowest recorded since mid-October 2020 when it was +54.17. Six months ago, the Current Sentiment 3MMA peaked at +77.83, the highest level since December 2021.
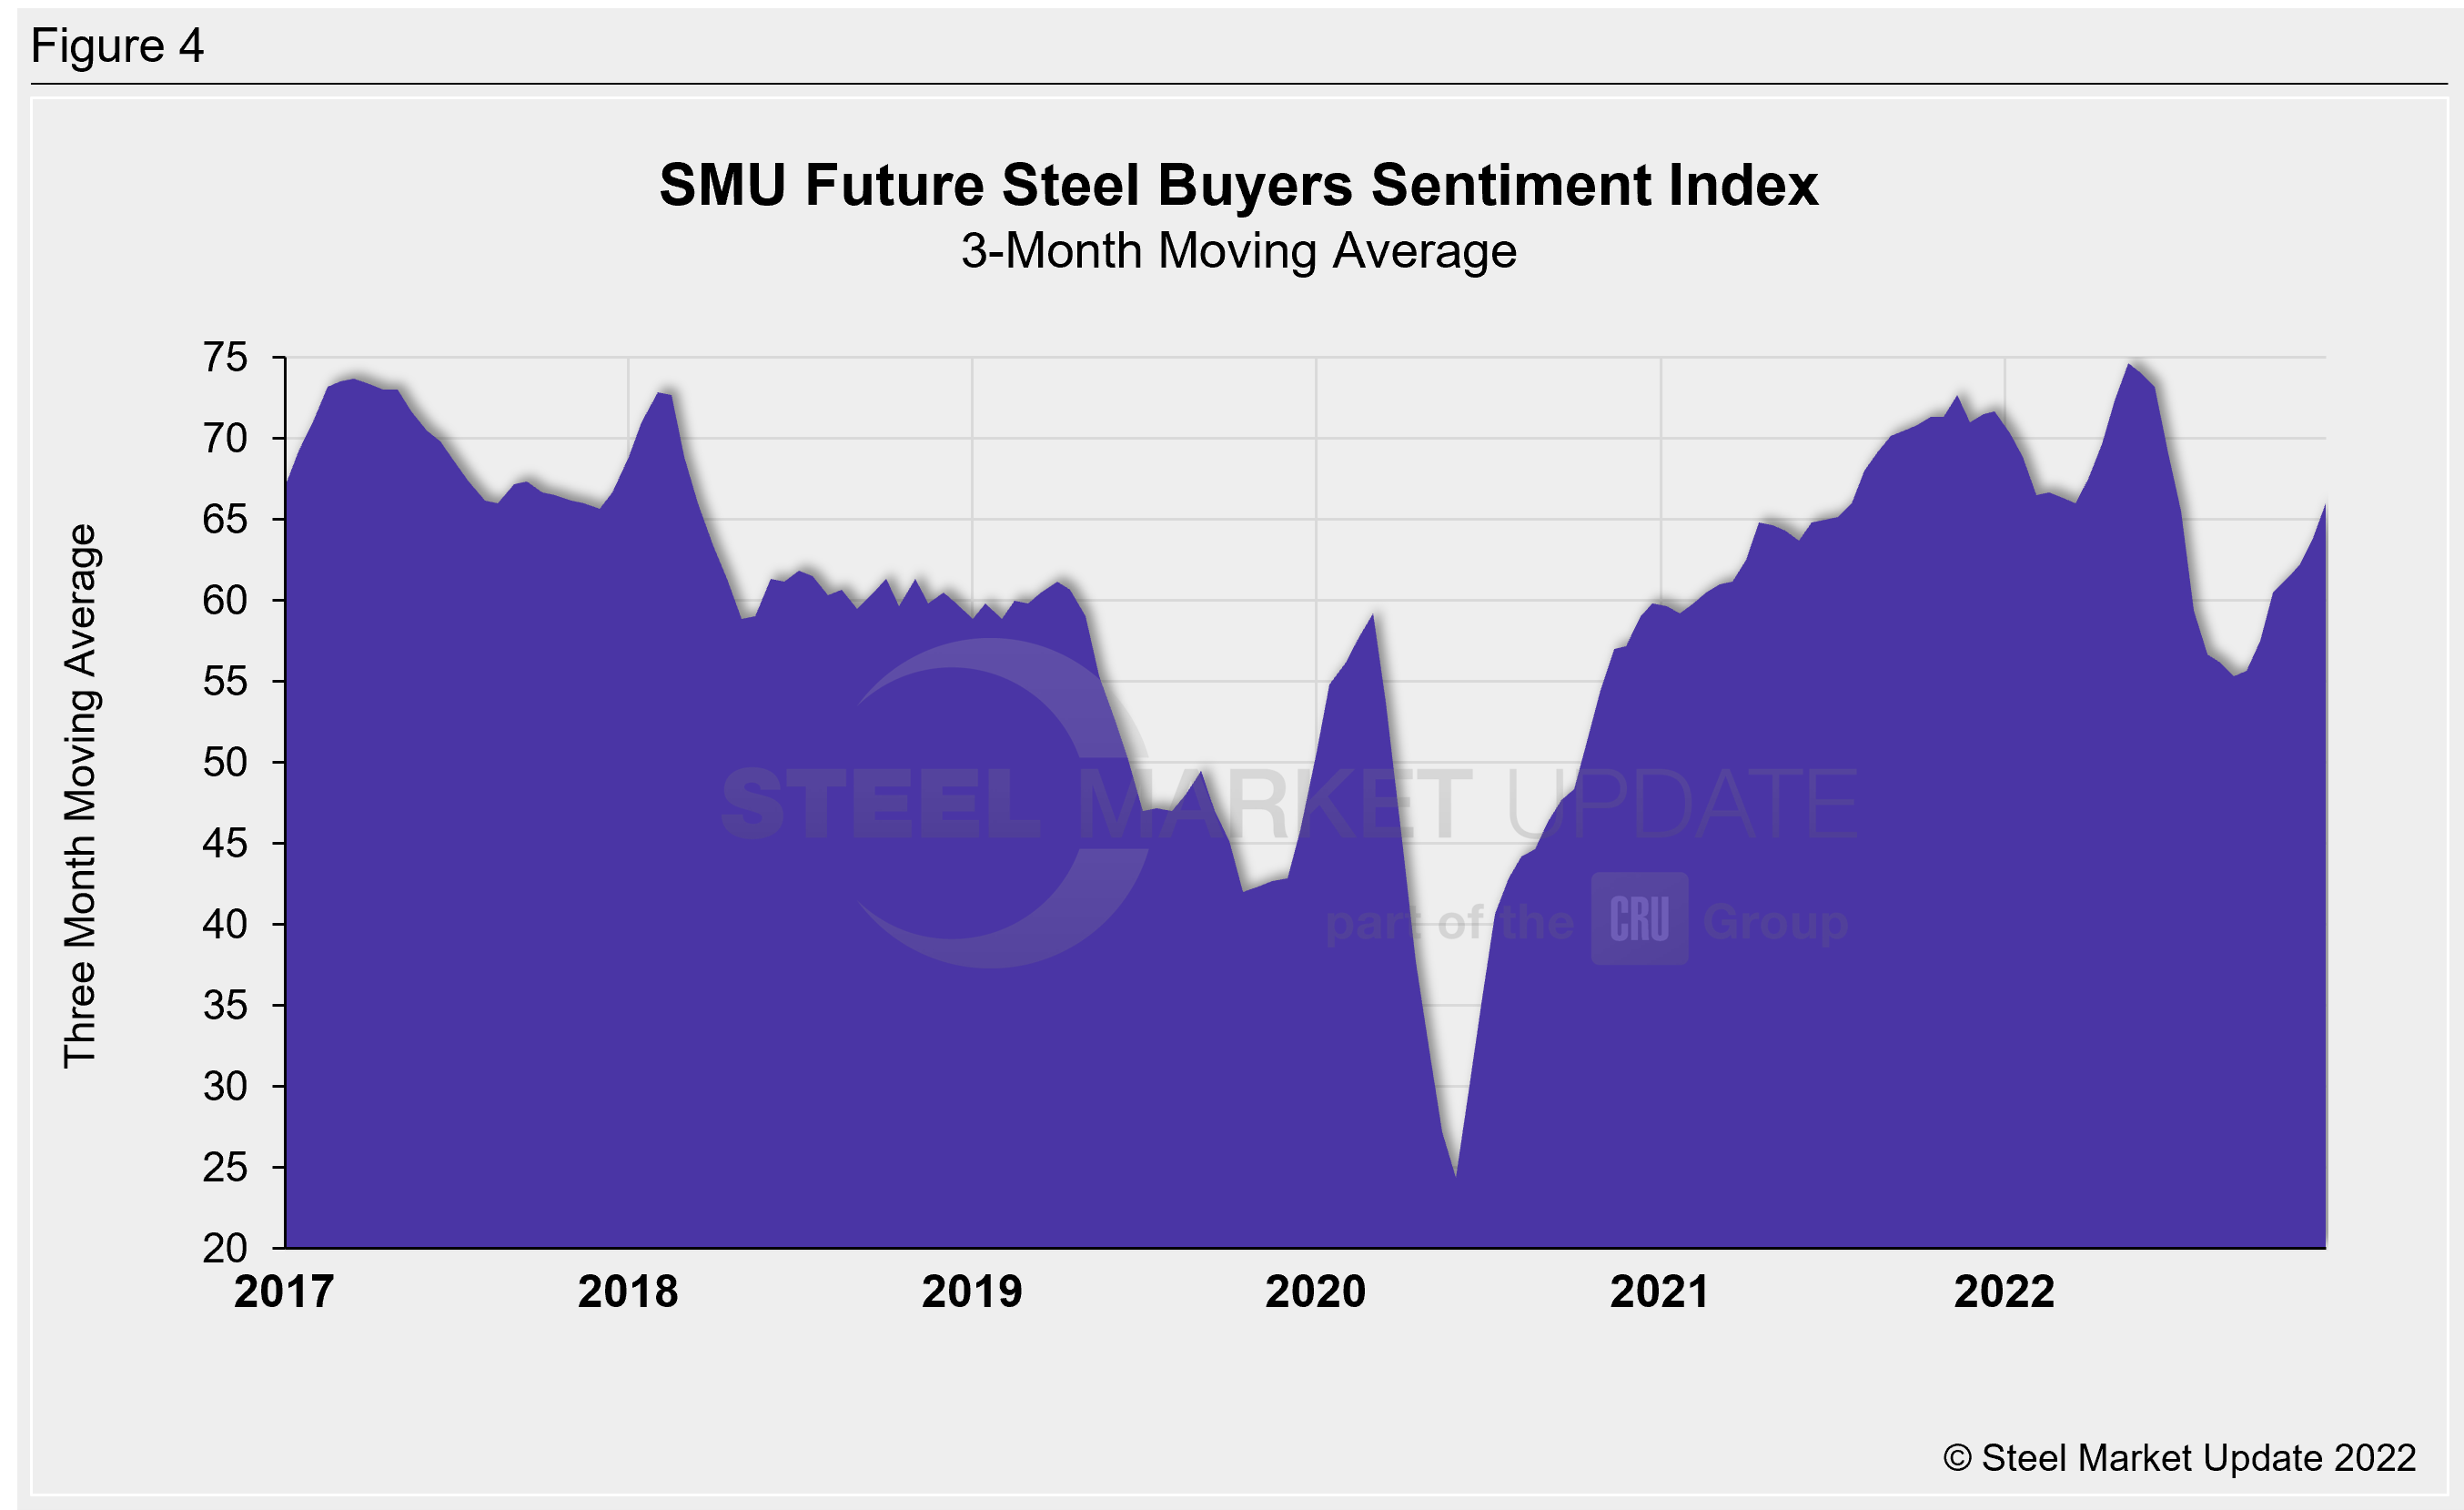
The Future Sentiment 3MMA increased again this week to +66.00, almost four points higher than one month prior and now at a five-month high (Figure 4). Unlike the Current Sentiment 3MMA, the Future 3MMA has shown signs of recovery over the last five surveys. The early September reading of +55.33 was the lowest seen since October 2020. The Future Sentiment 3MMA has risen in each survey since and is now at the highest level since mid-June. Recall that the Future Sentiment 3MMA had reached a record high of +74.67 in May, surpassing the previous record of +73.67 set in March 2017.
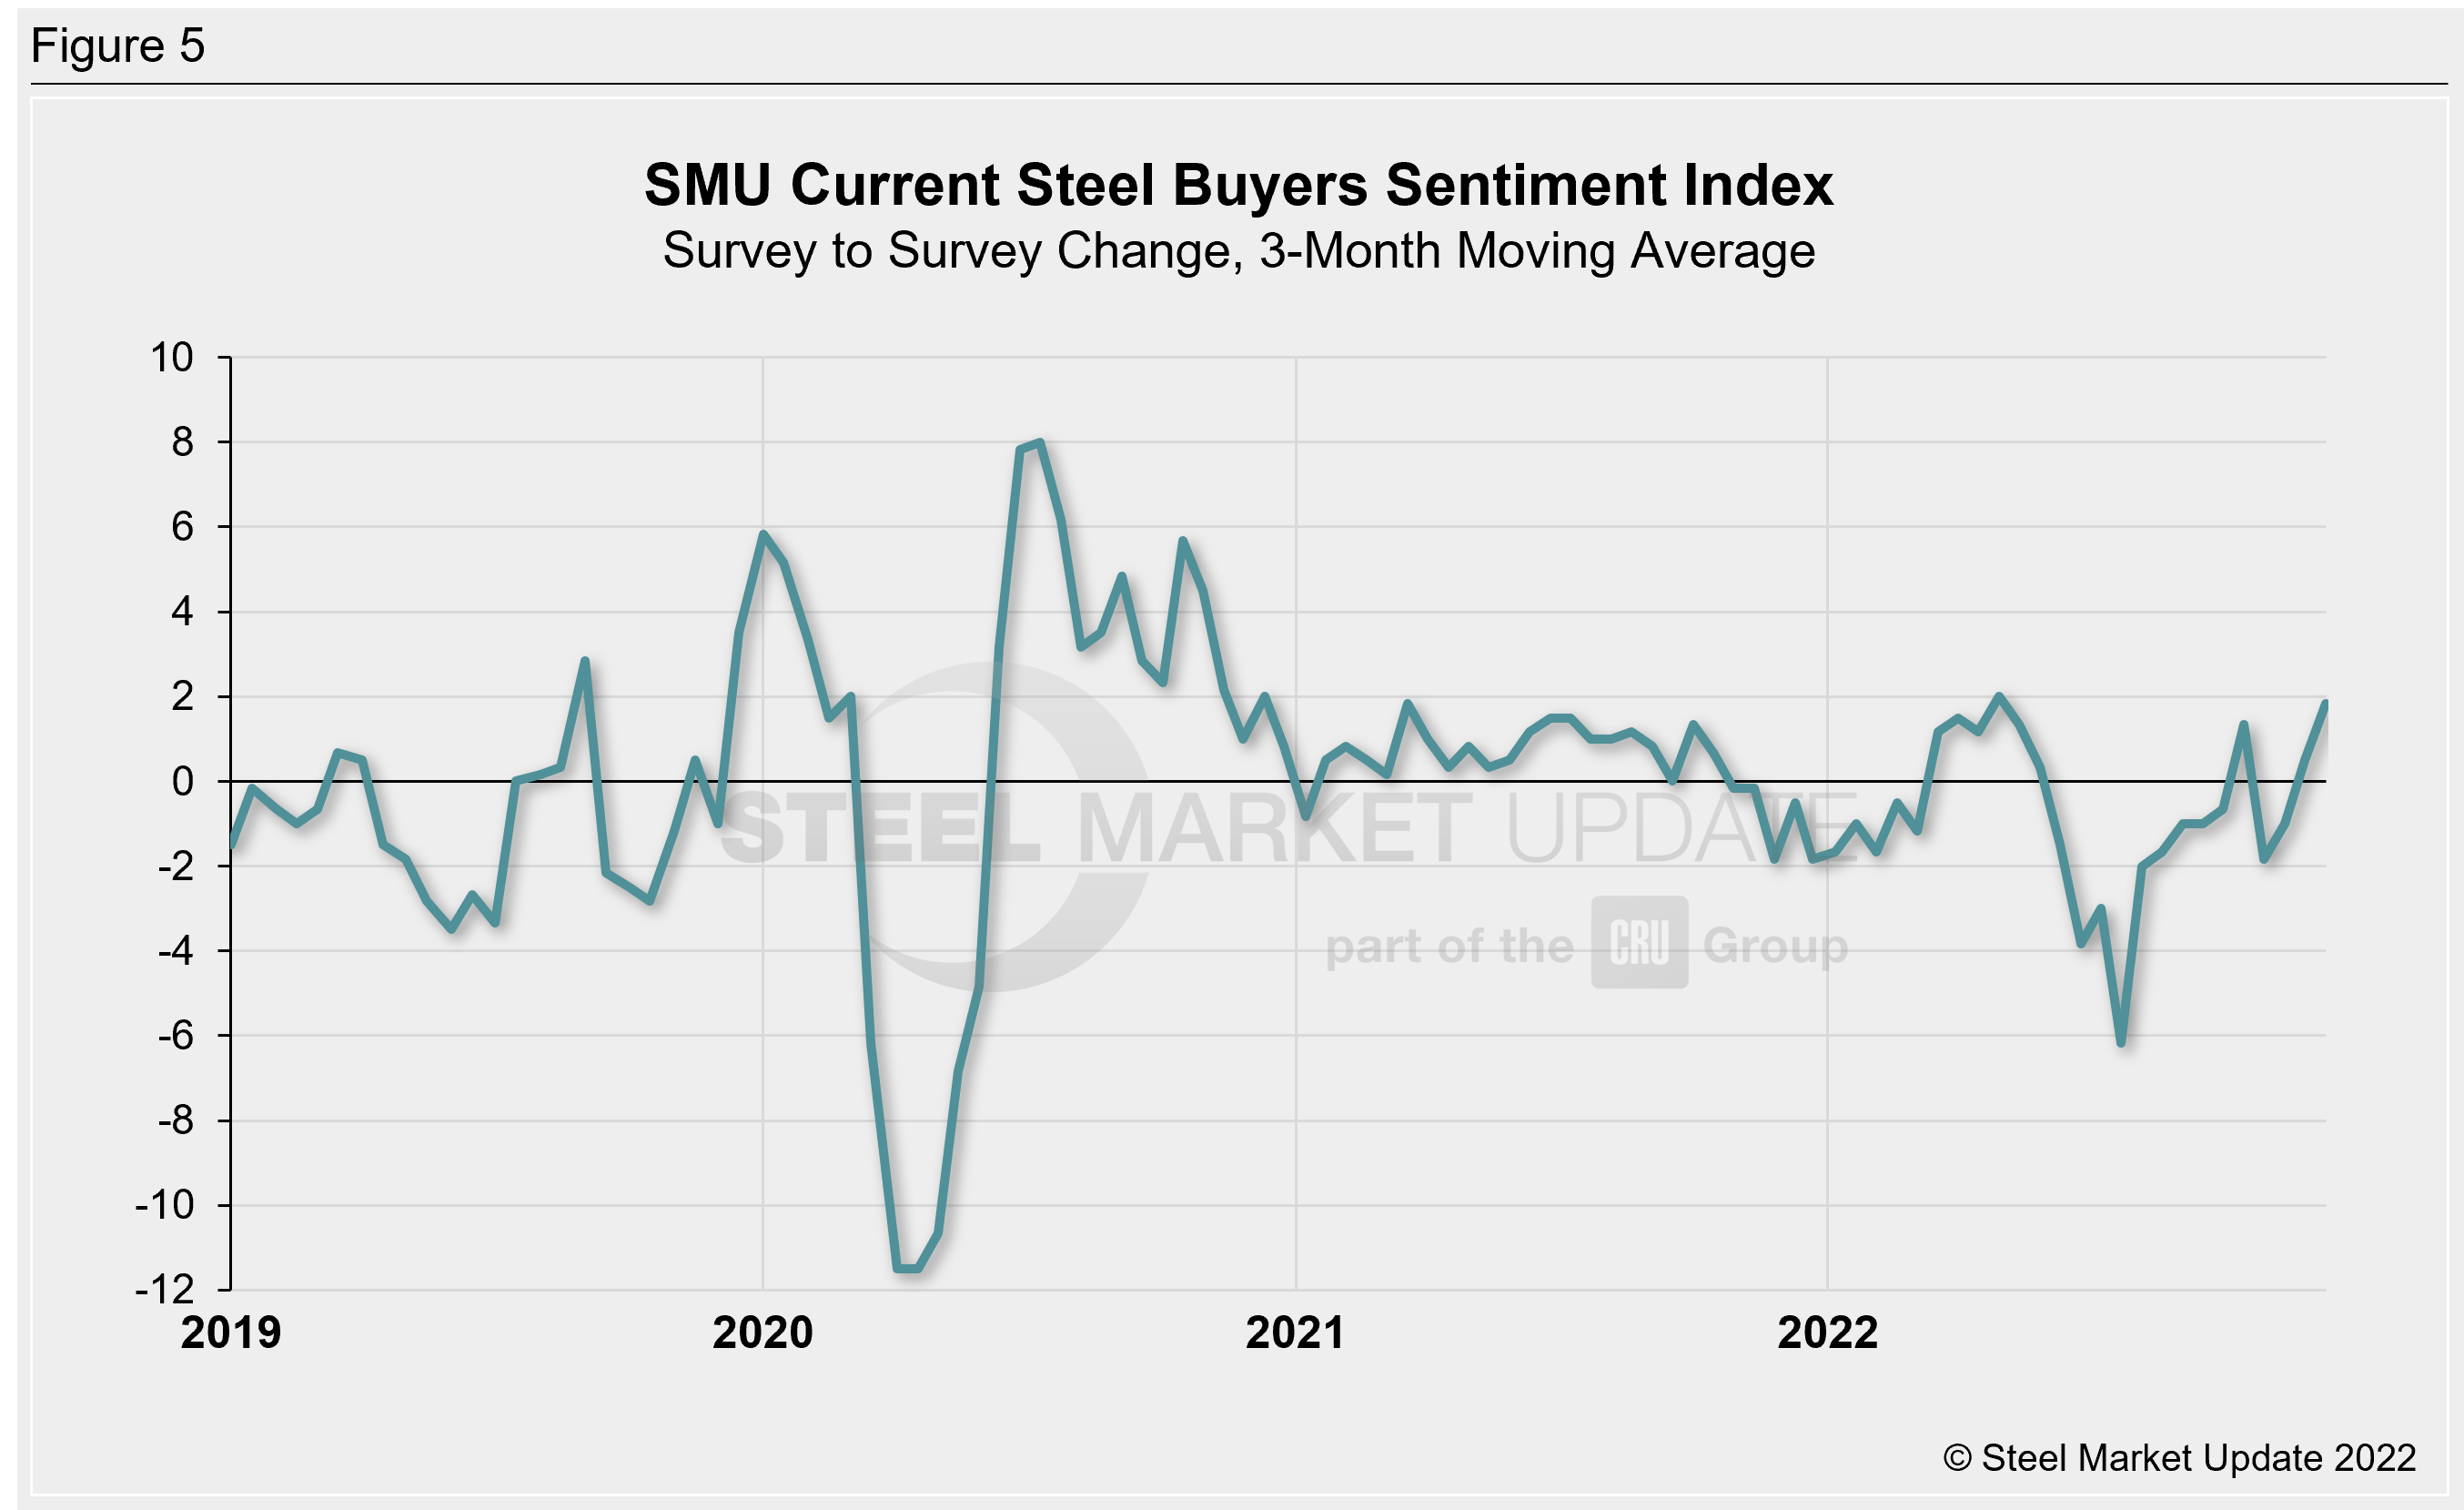
To measure the magnitude of Sentiment movements, we graphed the survey-to-survey change in the Current Sentiment Index (Figure 5). On a 3MMA basis through last week, the survey-to-survey change is up two points compared to two weeks prior. This is now one of the highest growth rates recorded since April. Prior to mid-November, we had seen negative growth rates in all but one survey since early June. In late July, we saw a six-point decline, which was the largest change seen since April 2020. Between November 2020 and June 2022, the survey-to-survey change in our 3MMA Sentiment reading was relatively stable, never exceeding two points. In late June of this year, it began to exceed that range and did so through July.
What SMU Survey Respondents Had to Say:
“With prices levelling off, forward planning becomes much easier.”
“Demand is notably soft, and competition is getting more aggressive for existing business.”
“Demand looks strong. However margins will be under pressure in q1 due to the lagging nature of our CRU-based contracts paired with higher cost steel.”
“Current steel inventory $ still too high for good performance.”
“Expect compressed margins as plate prices continue to decline.”
“Internal innovation is our key to prosperous growth.”
“Inventory is in a good position, and most customers have missed the bottom.”
“Backlog is solid.”
About the SMU Steel Buyers Sentiment Index
The SMU Steel Buyers Sentiment Index is a measurement of the current attitude of buyers and sellers of flat-rolled steel products in North America regarding how they feel about their company’s opportunity for success in today’s market. It is a proprietary product developed by Steel Market Update for the North American steel industry. Tracking steel buyers’ sentiment is helpful in predicting their future behavior.
Positive readings run from +10 to +100. A positive reading means the meter on the right-hand side of our home page will fall in the green area indicating optimistic sentiment. Negative readings run from -10 to -100. They result in the meter on our homepage trending into the red, indicating pessimistic sentiment. A reading of “0” (+/- 10) indicates a neutral sentiment (or slightly optimistic or pessimistic), which is most likely an indicator of a shift occurring in the marketplace. Sentiment is measured via SMU surveys that are conducted twice per month.
We send invitations to participate in our survey to more than 700 North American companies. Approximately 45% of respondents are service centers/distributors, 30% are manufacturers, and the remainder are steel mills, trading companies or toll processors involved in the steel business.
Click here to view an interactive graphic of the SMU Steel Buyers Sentiment Index or the SMU Future Steel Buyers Sentiment Index.
By Brett Linton, Brett@SteelMarketUpdate.com


