

Analysis
September 20, 2023
US Light-Vehicle Sales Slip in August, Still Better YoY
Written by David Schollaert
US light-vehicle (LV) sales rose to an unadjusted 1.33 million units in August, up 12.8% vs. year-ago levels, the US Bureau of Economic Analysis (BEA) reported. Despite the year-on-year (YoY) boost, domestic LV sales fell 4.5% month on month (MoM).
On an annualized basis, LV sales were 15 million units in August, down from 15.7 million units the month prior, and below the consensus forecast which called for a more modest decline to 15.4 million units.
Auto sales continue to be impacted by higher financing rates and high-priced inventory. And while production levels are roughly back at pre-pandemic levels, delivery rates are still running roughly two months – from the production line to dealers.
Production recovery continues to build, pushing days’ supply of light vehicles to rise to 38 in August, slightly higher than last month but still about 40% below the pre-pandemic average.
Retail incentives, though being pressured higher, up 96% YoY in August, are still just about half of what they were in August 2019 – before the global pandemic and semiconductor shortage cut auto assemblies.
Despite that, the average daily selling rate (DSR) was 49,205 – calculated over 27 days – up from August 2022’s 43,626 daily rate. And passenger vehicle sales increased YoY while sales of light-trucks ticked up by 18.4% over the same period. Light-trucks accounted for 80% of last month’s sales, roughly the same to its share of sales in August 2022.
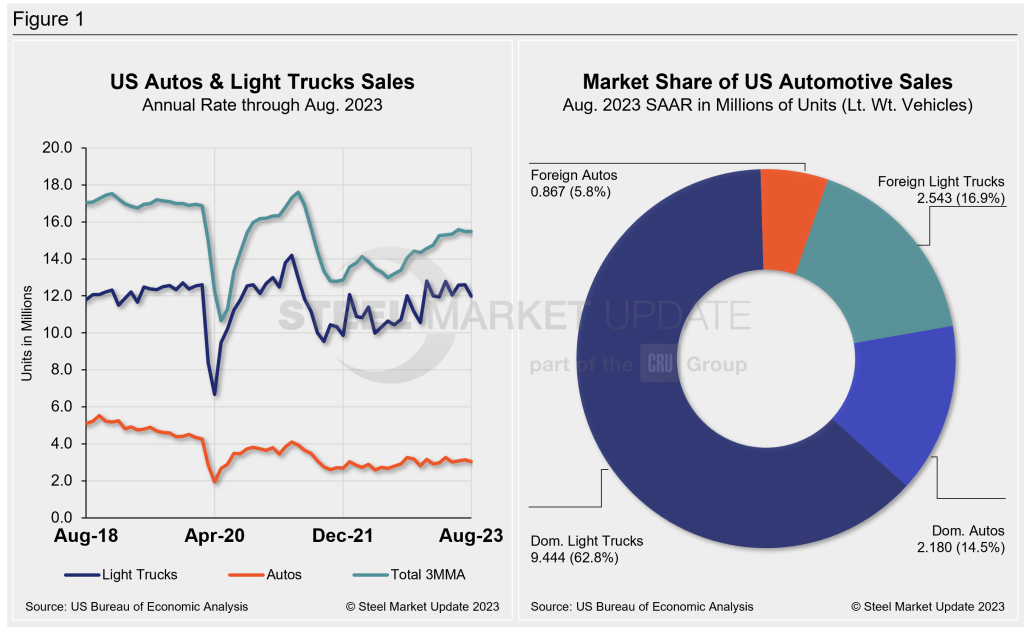
Below in Figure 1 is the long-term picture of sales of autos and lightweight trucks in the US from 2013 through August 2023. Additionally, it includes the market share sales breakdown of last month’s 15 million vehicles at a seasonally adjusted annual rate.
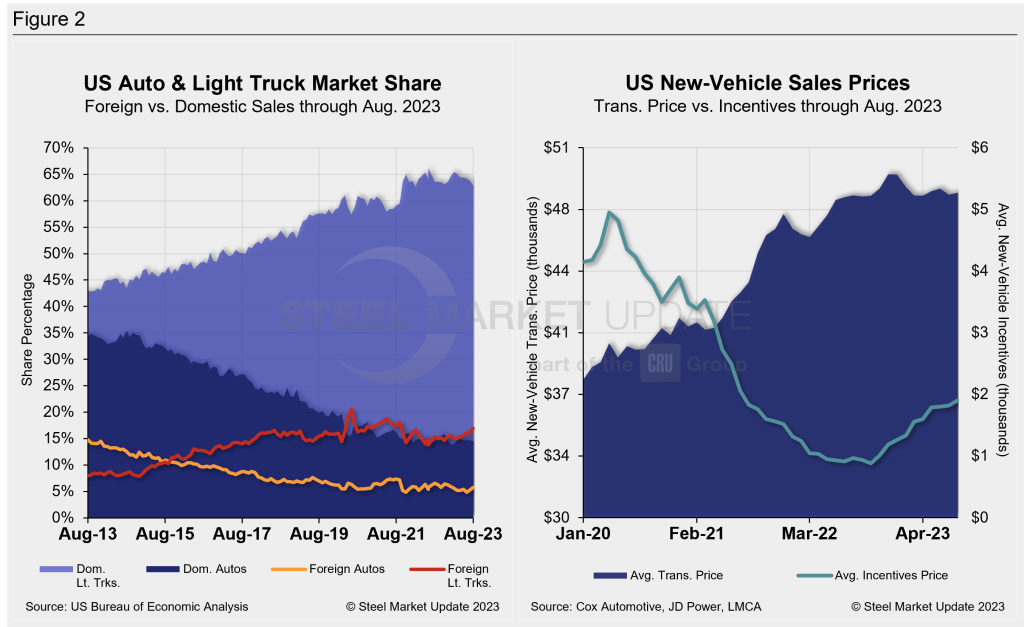
The new-vehicle average transaction price (ATP) was $48,451 in August, up just 0.2% from July. Last month’s ATP was also up 0.3% (+$150) above the year-ago period, according to Cox Automotive data.
Incentives increased again for the 10th straight month. Last month’s incentives were $1,902, up from $1,820 in July, and the highest total since June 2021. With the MoM increase, incentives are roughly 4% of the average transaction price. Incentives are up 96.3%, or $933 YoY.
In August, the annualized selling rate of light trucks was 11.988 million units, down 4.9% vs. the prior month but still nearly 14.8% better YoY. Auto annualized selling rates saw similar dynamics, down 3.1% but up 9.3%, respectively, in the same comparisons.
Figure 2 details the US auto and light-truck market share since 2013 and the divergence between average transaction prices and incentives in the US market since 2020.
Editor’s Note: This report is based on data from the US Bureau of Economic Analysis (BEA), LMC Automotive, JD Power, and Cox Automotive for automotive sales in the US, Canada, and Mexico. Specifically, the report describes light vehicle sales in the US.


