Analysis
November 7, 2024
US steel imports fall through September and October
Written by Brett Linton
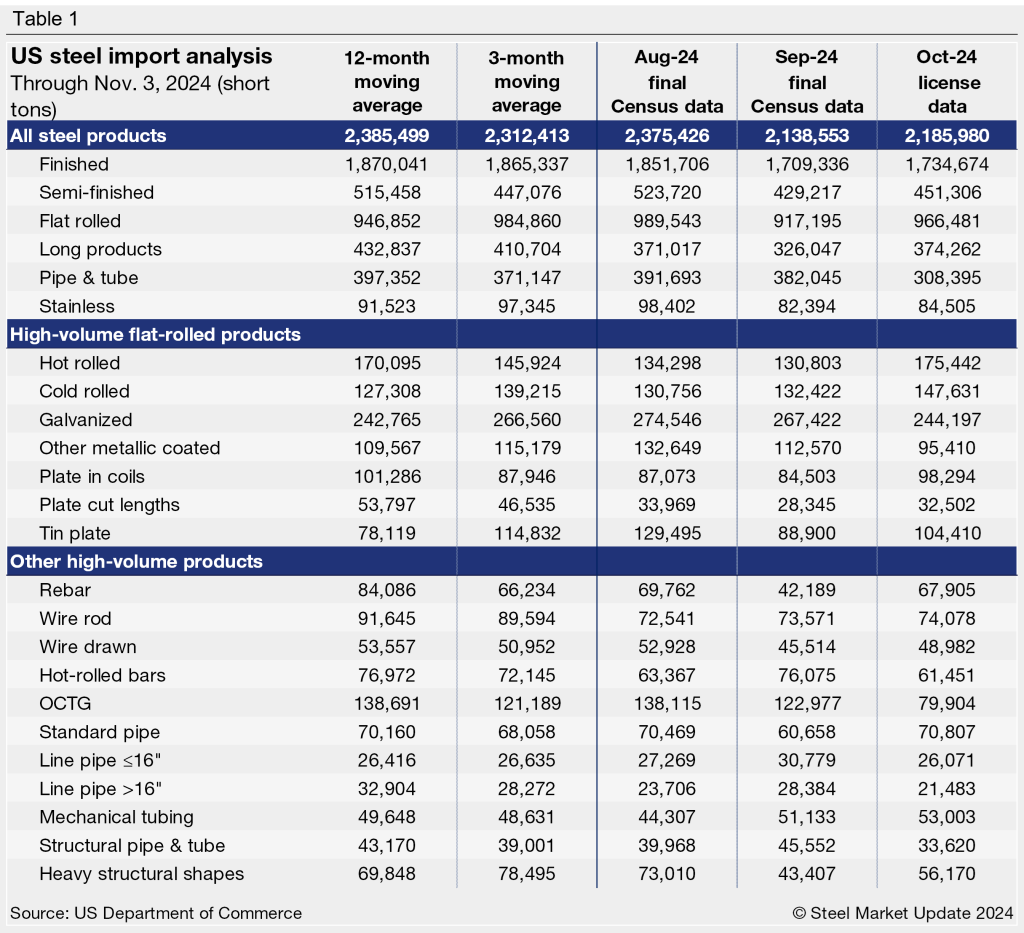
The volume of steel imported into the US totaled 2.14 million short tons (st) in September, according to final figures released earlier this week by the US Commerce Department. September imports were 10% less than August levels, marking the lowest monthly import rate seen this year. According to license data collected through Nov. 3, October licenses currently total 2.19 million st, a potential 2% increase from September. (Figure 1, left).
Nearly two-thirds of all of the steel entering the country in September came from just four countries: Canada (23%), Brazil (15%), South Korea (13%), and Mexico (12%). Four other significant contributors include Vietnam (6%), Taiwan (4%), Germany (4%), and Japan (4%). The combined volumes from these eight countries represent 82% of all imports in September.
Explore the International Trade Administration’s Steel Import Monitor to view imports by product or country in more detail.
Smoothing out the data
To smooth out the variability seen in monthly data, we can look at imports on a three-month moving average (3MMA) basis (Figure 1, right). From this perspective, final September imports fell to an eight-month low of 2.31 million st. Recall that back in May we saw the 3MMA near a two-year high of 2.73 million st. The 3MMA through October is currently down further to 2.23 million st.
For comparison, the average monthly import rate of 2023 was 2.35 million st, while the first 10 months of 2024 have averaged 2.45 million st.
Semi-finished vs. finished breakdown
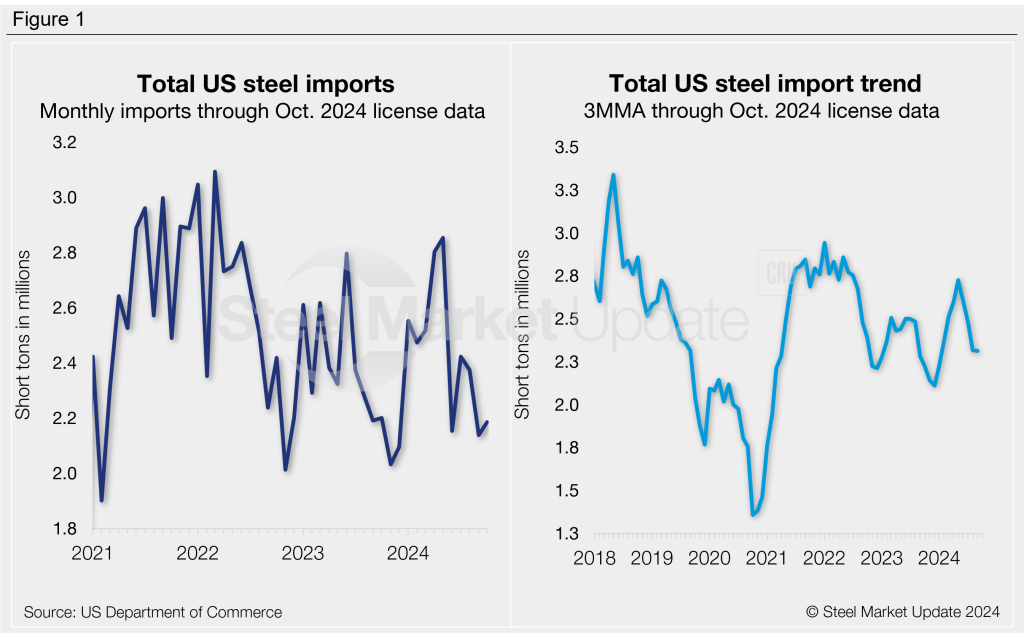
Imports of finished steel products totaled 1.71 million st in September, down 8% from August to the lowest monthly rate seen this year. The latest finished import tally through October is up 1% to 1.73 million st. For reference, finished imports had averaged 1.83 million st per month last year. The monthly average for the first 10 months of 2024 now stands at 1.91 million st.
Meanwhile, semi-finished steel imports (mostly slabs to be further processed at a mill) slipped 18% month over month (m/m) to 429,000 st September. This represents the third-lowest monthly rate seen this year (Figure 2). October licenses currently total 451,000 st, 5% higher than September. Semi-finished imports averaged 524,000 st per month in 2023, whereas we have seen a monthly average of 533,000 st across 2024 to date.
Imports by category
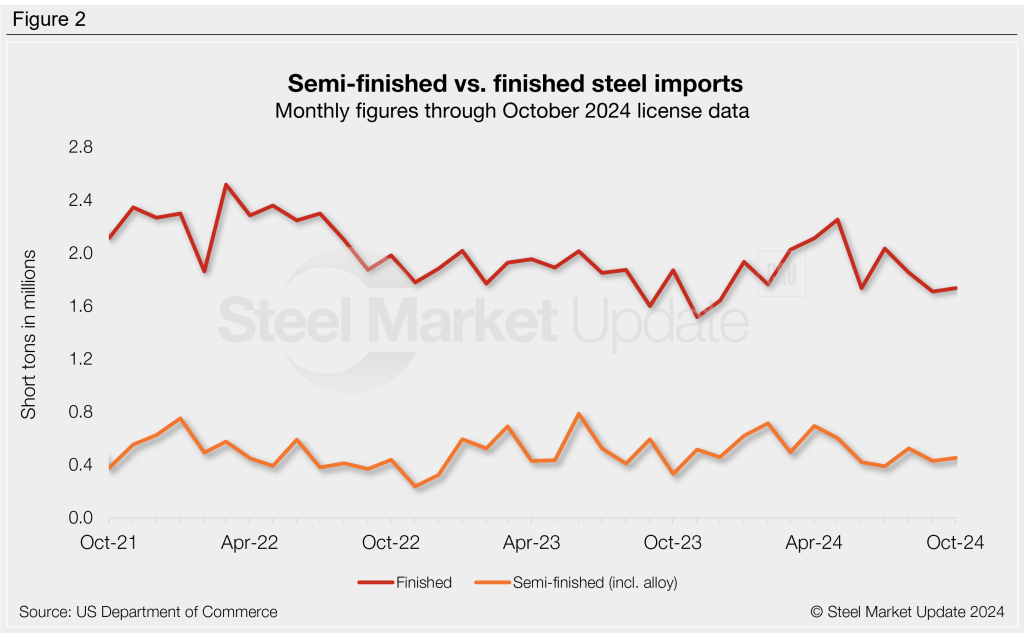
Figure 3 shows monthly imports by product category. Imports of flat-rolled steel products eased 7% m/m in September to a three-month low of 917,000 st. The latest license data shows a potential 5% recovery in October to 966,000 st.
Imports of long products fell 12% further in September following August’s 35% m/m decline, now at a one-year low of 326,000 st. October licenses are currently up 15% from September at 375,000 st.
Pipe-and-tube imports eased 2% to 382,000 st in September. October licenses are currently down 19% further to 308,000 st, a possible 11-month low.
Stainless imports fell 16% from August to a seven-month low of 82,000 st in September. October stainless projections are currently at 85,000 st, potentially up 3% m/m.
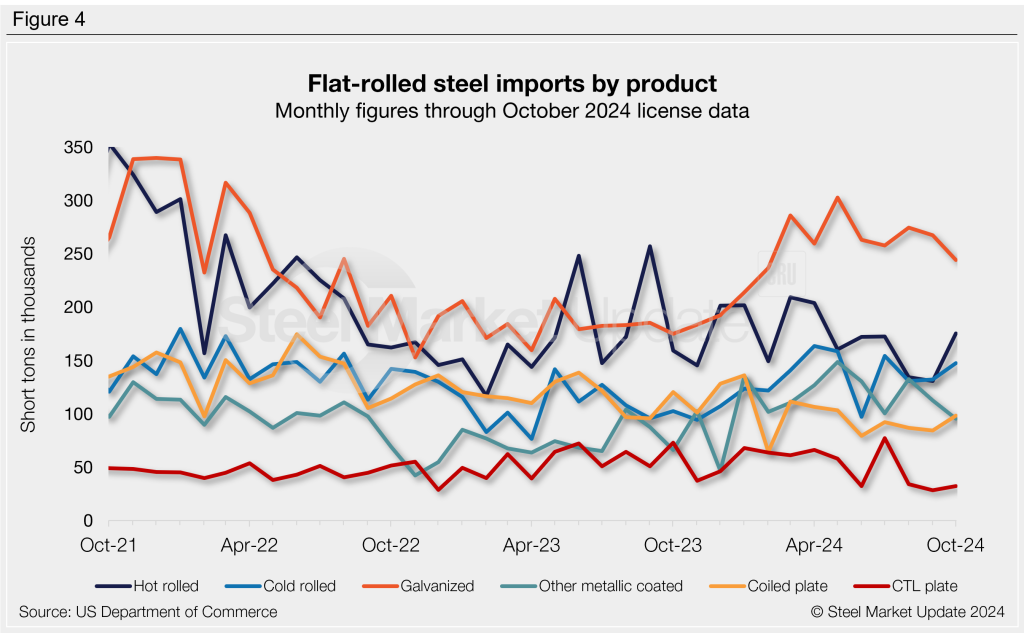
Flat rolled imports
Figure 4 shows flat rolled imports by popular products. The largest monthly mover from August to September was tin plate (-31%), followed by plate cut lengths (-17%) and other-metallic coated (-15%).
October licenses are up across most of the flat-rolled products we track aside from coated products. Current data indicates m/m increases in hot-rolled sheet (+34%), tin plate (+17%), plate in coils (+16%), plate cut lengths (+15%), and cold-rolled sheet (+11%). The two products expected to fall in October are other-metallic coated (-15%) and galvanized sheet (-9%).
Imports by product
Table 1 provides further detail into imports by product, highlighting high-volume steel products. Explore this steel trade data deeper on the Steel Imports page of our website.