

Market Data
December 12, 2024
Apparent steel supply remained near two-year low in October
Written by Brett Linton
The amount of finished steel entering the US market remained low in October, according to our analysis of recently released Commerce Department and the American Iron and Steel Institute (AISI) data.
Referred to as ‘apparent steel supply’, we calculate this volume by combining domestic steel mill shipments with finished US steel imports and deducting total US steel exports.
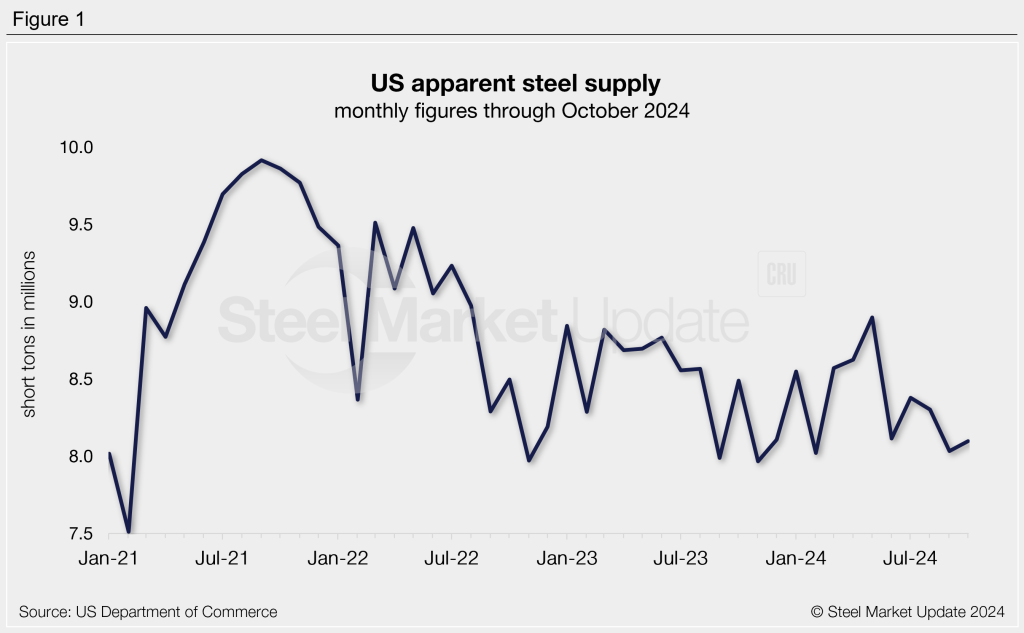
Total apparent supply for October was 8.10 million short tons (st), up just 1% from the seven-month low recorded one month prior. This is one of the lowest supply figures recorded in the past two years, with monthly rates fluctuating between 7.97-8.90 million st in that time.
Recall that earlier this year, supply had peaked at a 21-month high of 8.90 million st in May. This time last year, apparent supply was 8.49 million st. October’s supply was 3% less than the monthly average for 2024 to date.
Trends
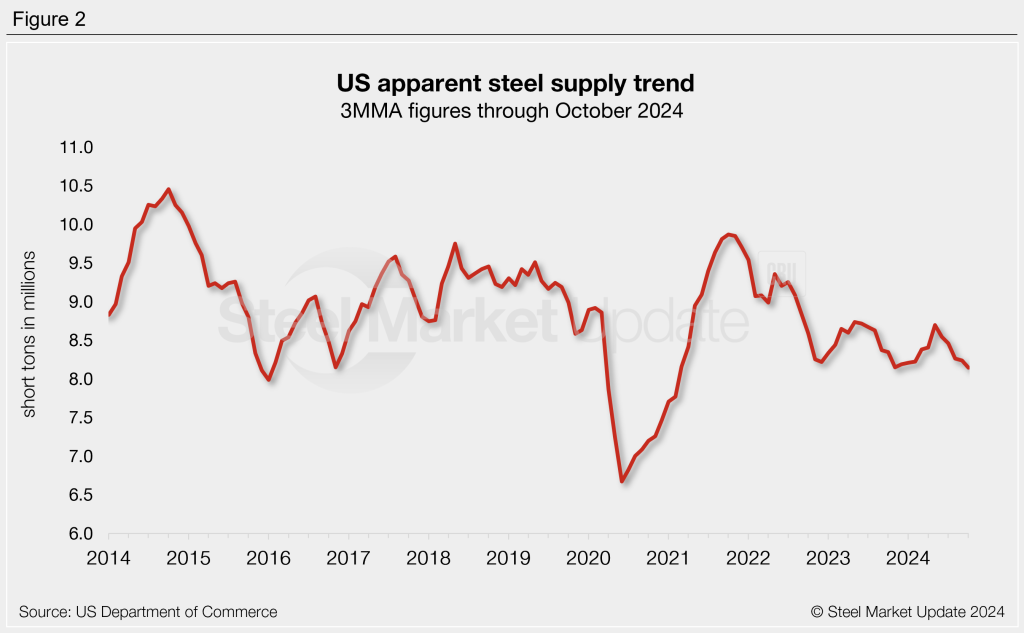
To better highlight patterns, supply can be assessed using a three-month moving average (3MMA) to smooth out monthly fluctuations (Figure 2). Supply on a 3MMA basis has trended lower across the past three years, following the late 2021 peak of 9.87 million st. The October 3MMA was down to a nearly four-year low of 8.14 million st. One year prior it was 8.35 million st. Two years ago it was significantly higher at 8.59 million st.
Looking at the four most recent months of data (July through October), the highest apparent supply rate occurred in July (Figure 3). Across those months, we saw a reduction in domestic shipments and exports in September and October. Finished imports bobbed up and down during that time.
The marginal increase in supply from September to October was primarily due to a 144,000 st (8%) increase in finished imports and a 16,000 (2%) decline in total exports. That gain was mostly negated by a 96,000 st (1%) drop in domestic shipments.
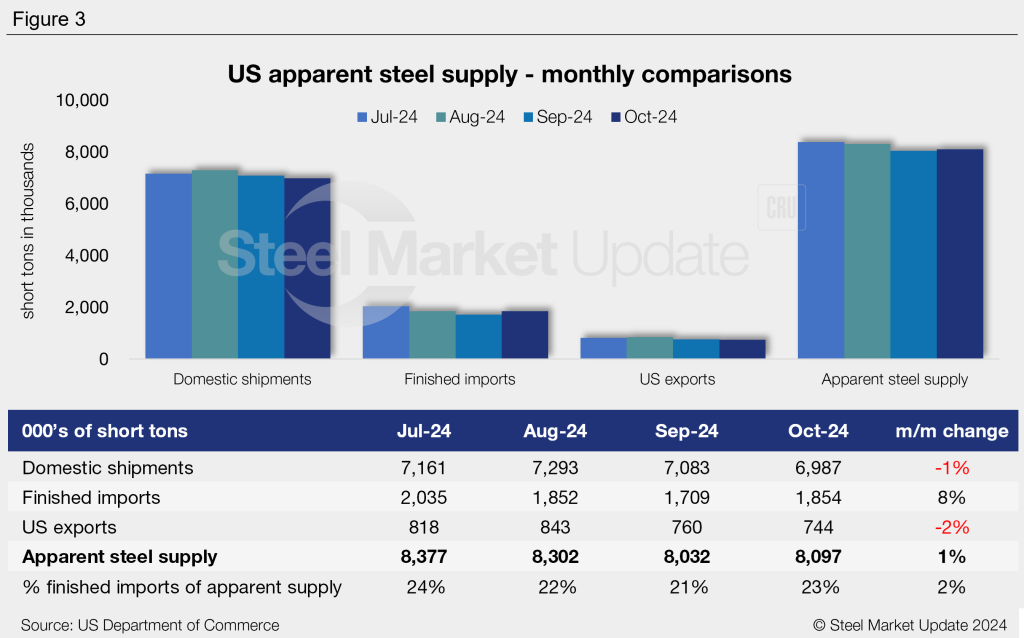
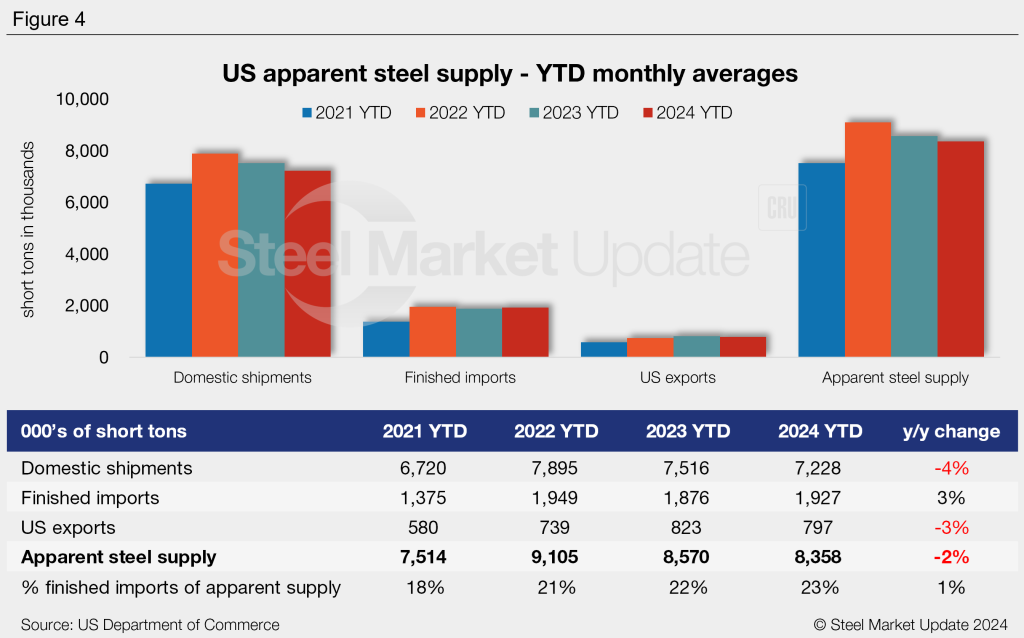
Figure 4 shows year-to-date (YTD) monthly averages for each statistic over the last four years. The average monthly supply level for the first 10 months of 2024 was 8.36 million st. This is 2% less than the same period last year and 8% lower than the 2022 YTD average. Overall, finished imports have strengthened in recent years, while domestic shipments and total exports have peaked and fallen.
To see an interactive graphic of our apparent steel supply history, click here. If you need any assistance logging into or navigating the website, contact us at info@steelmarketupdate.com.


