Analysis
April 8, 2025
US steel imports recede in February, stable through March
Written by Brett Linton
US steel imports returned to normal levels in February after climbing to a near three-year high in January, according to finalized trade data published by the US Commerce Department.
March license data suggests imports have stayed within typical range.
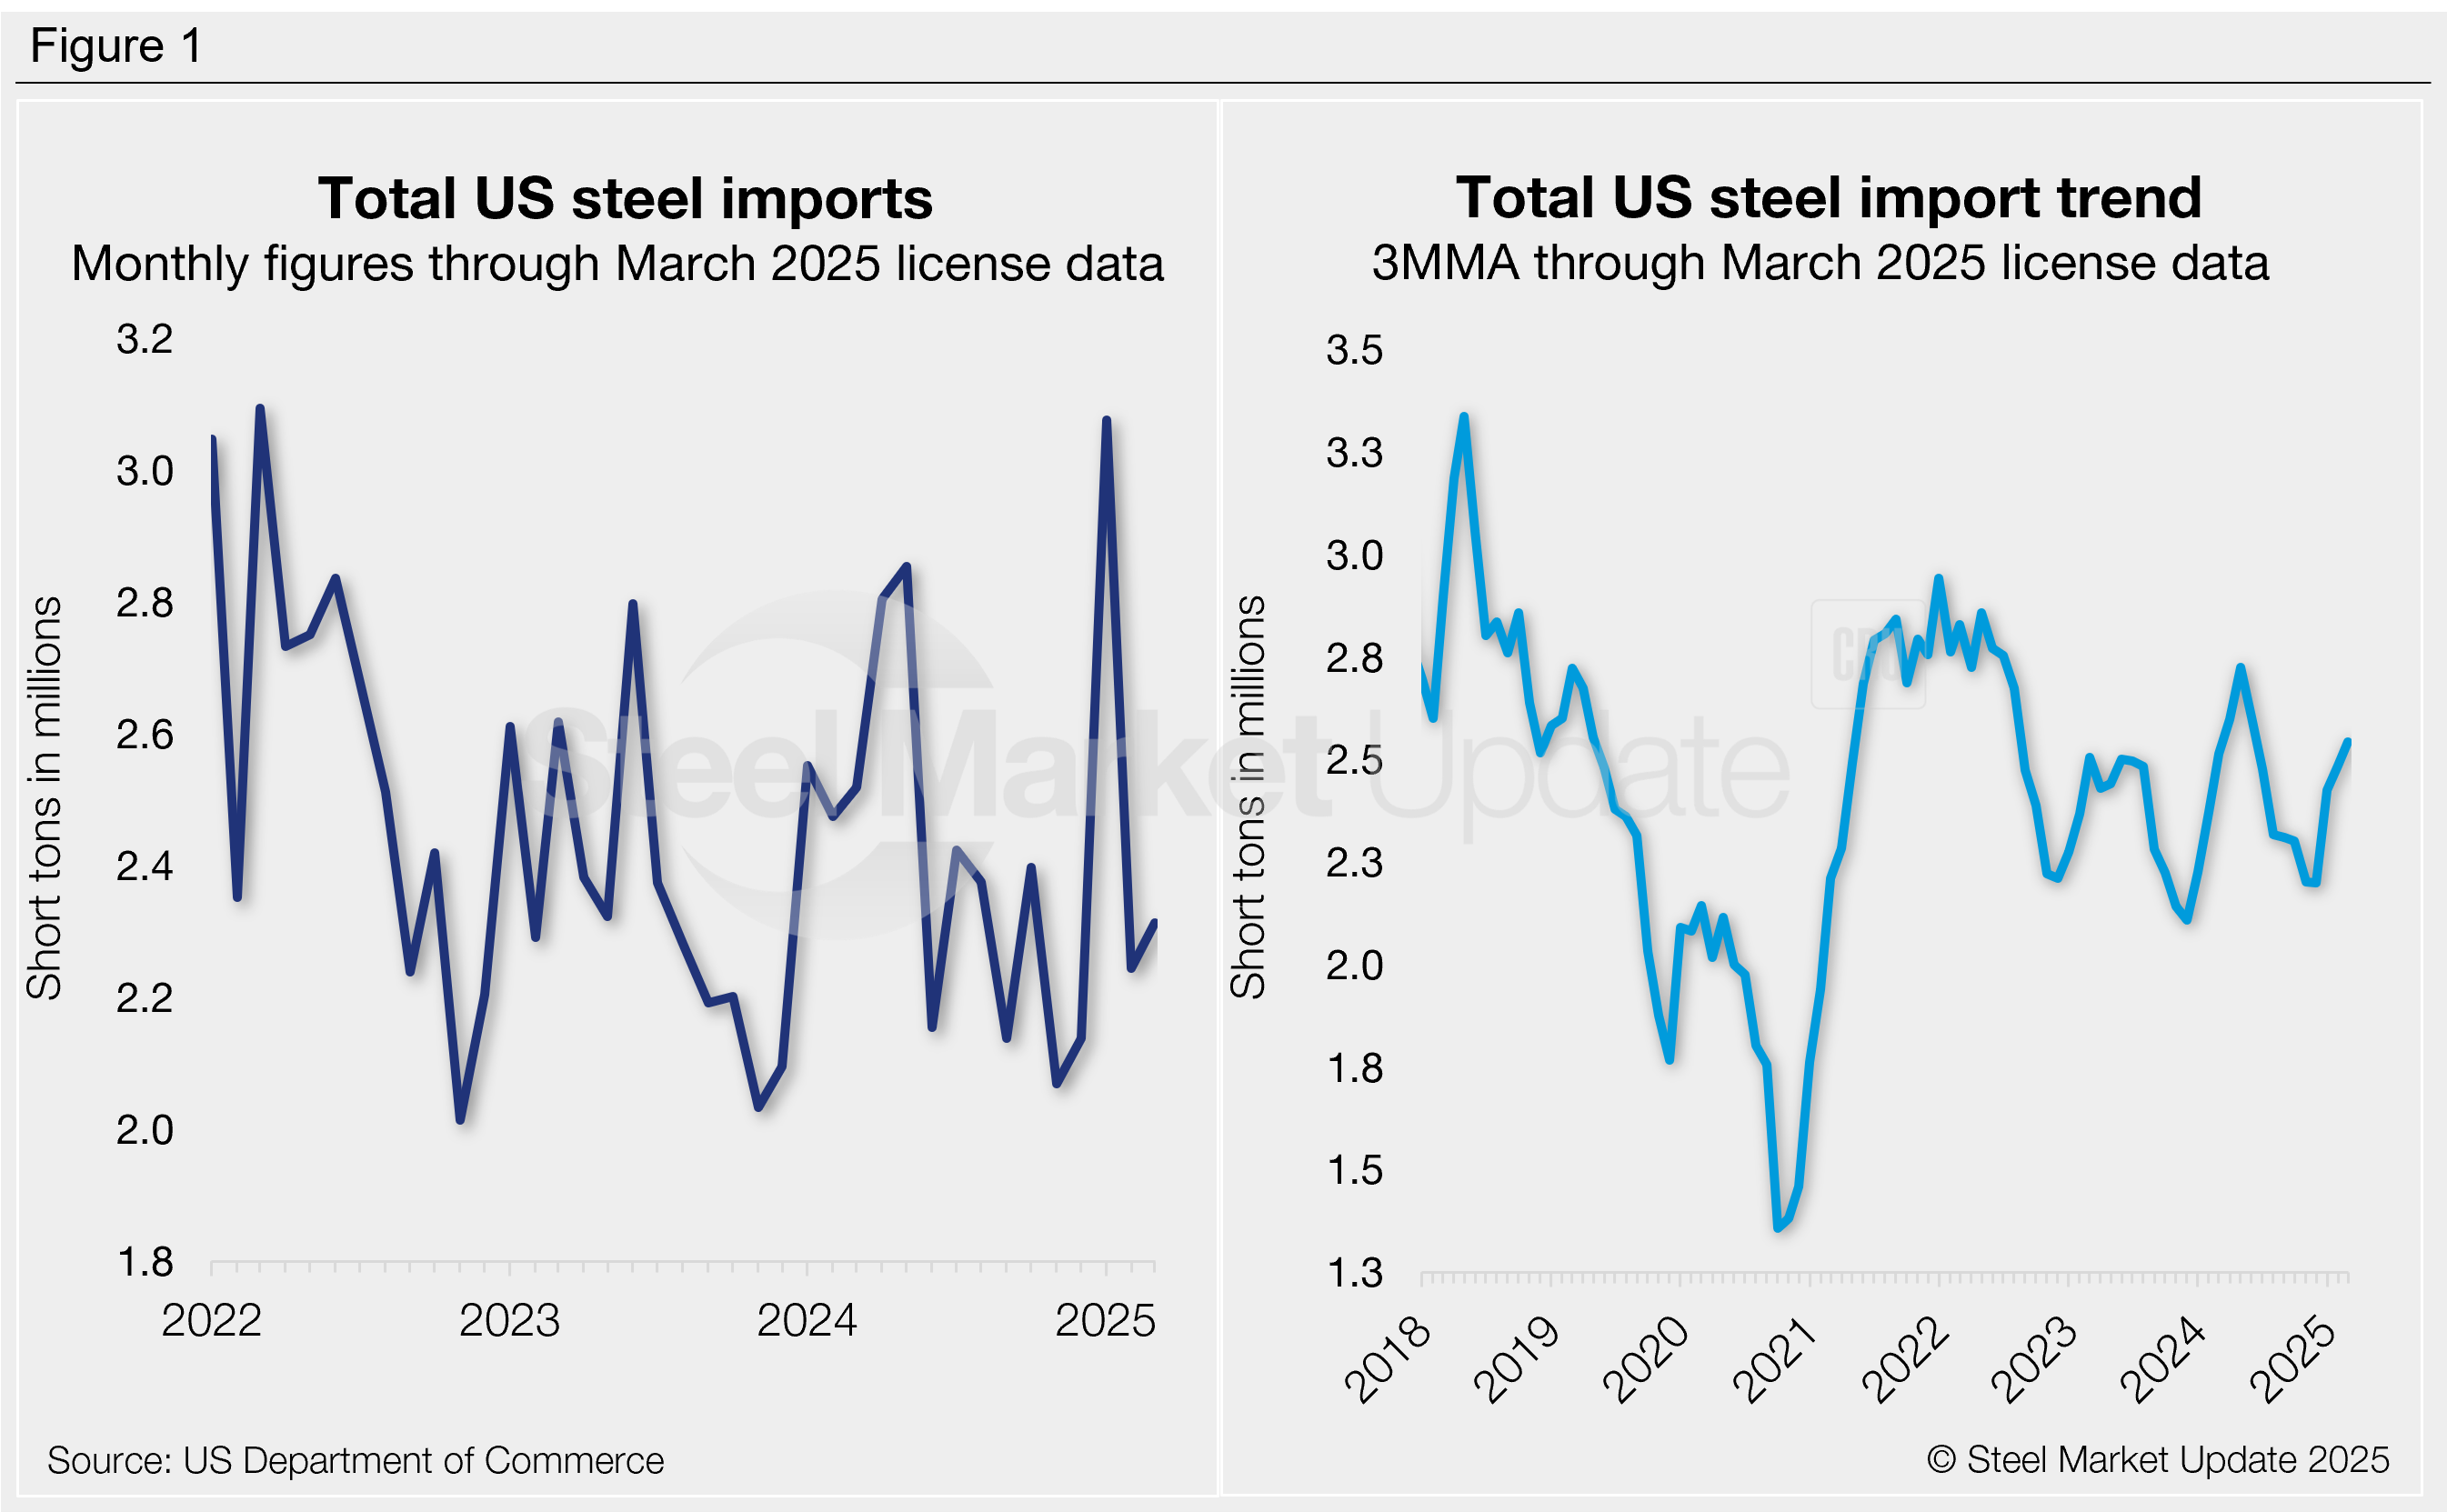
Recall that in January imports surged to 3.08 million short tons (st), the highest monthly volume seen since March 2022. Those gains were nearly erased in February. Final census data declined 27% month over month (m/m) to 2.24 million st.
March volumes are 3% higher m/m at 2.31 million st through April 1 license data. This puts import levels right back around those low levels seen in the second half of 2024 (Figure 1, left).
Nearly two-thirds of the steel that entered the country in February was exported from just four countries: Canada (21%), Brazil (20%), Mexico (12%), and South Korea (9%). Other key suppliers included Japan, Germany, Taiwan, Turkey, Romania, Vietnam, the United Arab Emirates, China, and the Netherlands, each supplying 2-5% of the monthly total. Combined shipments from these 13 countries accounted for 86% of February imports.
Visit the International Trade Administration’s Steel Import Monitor to explore steel import data by country, category, or specific product.
Import trends
Import data can be analyzed on a three-month moving average (3MMA) basis to better showcase long-term trends not seen m/m (Figure 1, right). From this view, imports increased to an eight-month high of 2.49 million st through February, quite a rebound from the 12-month low seen in December (2.20 million st). The March 3MMA has increased further to 2.54 million st. For comparison, imports averaged 2.41 million st per month in 2024 and 2.35 million st per month in 2023.
Finished vs. semi-finished imports
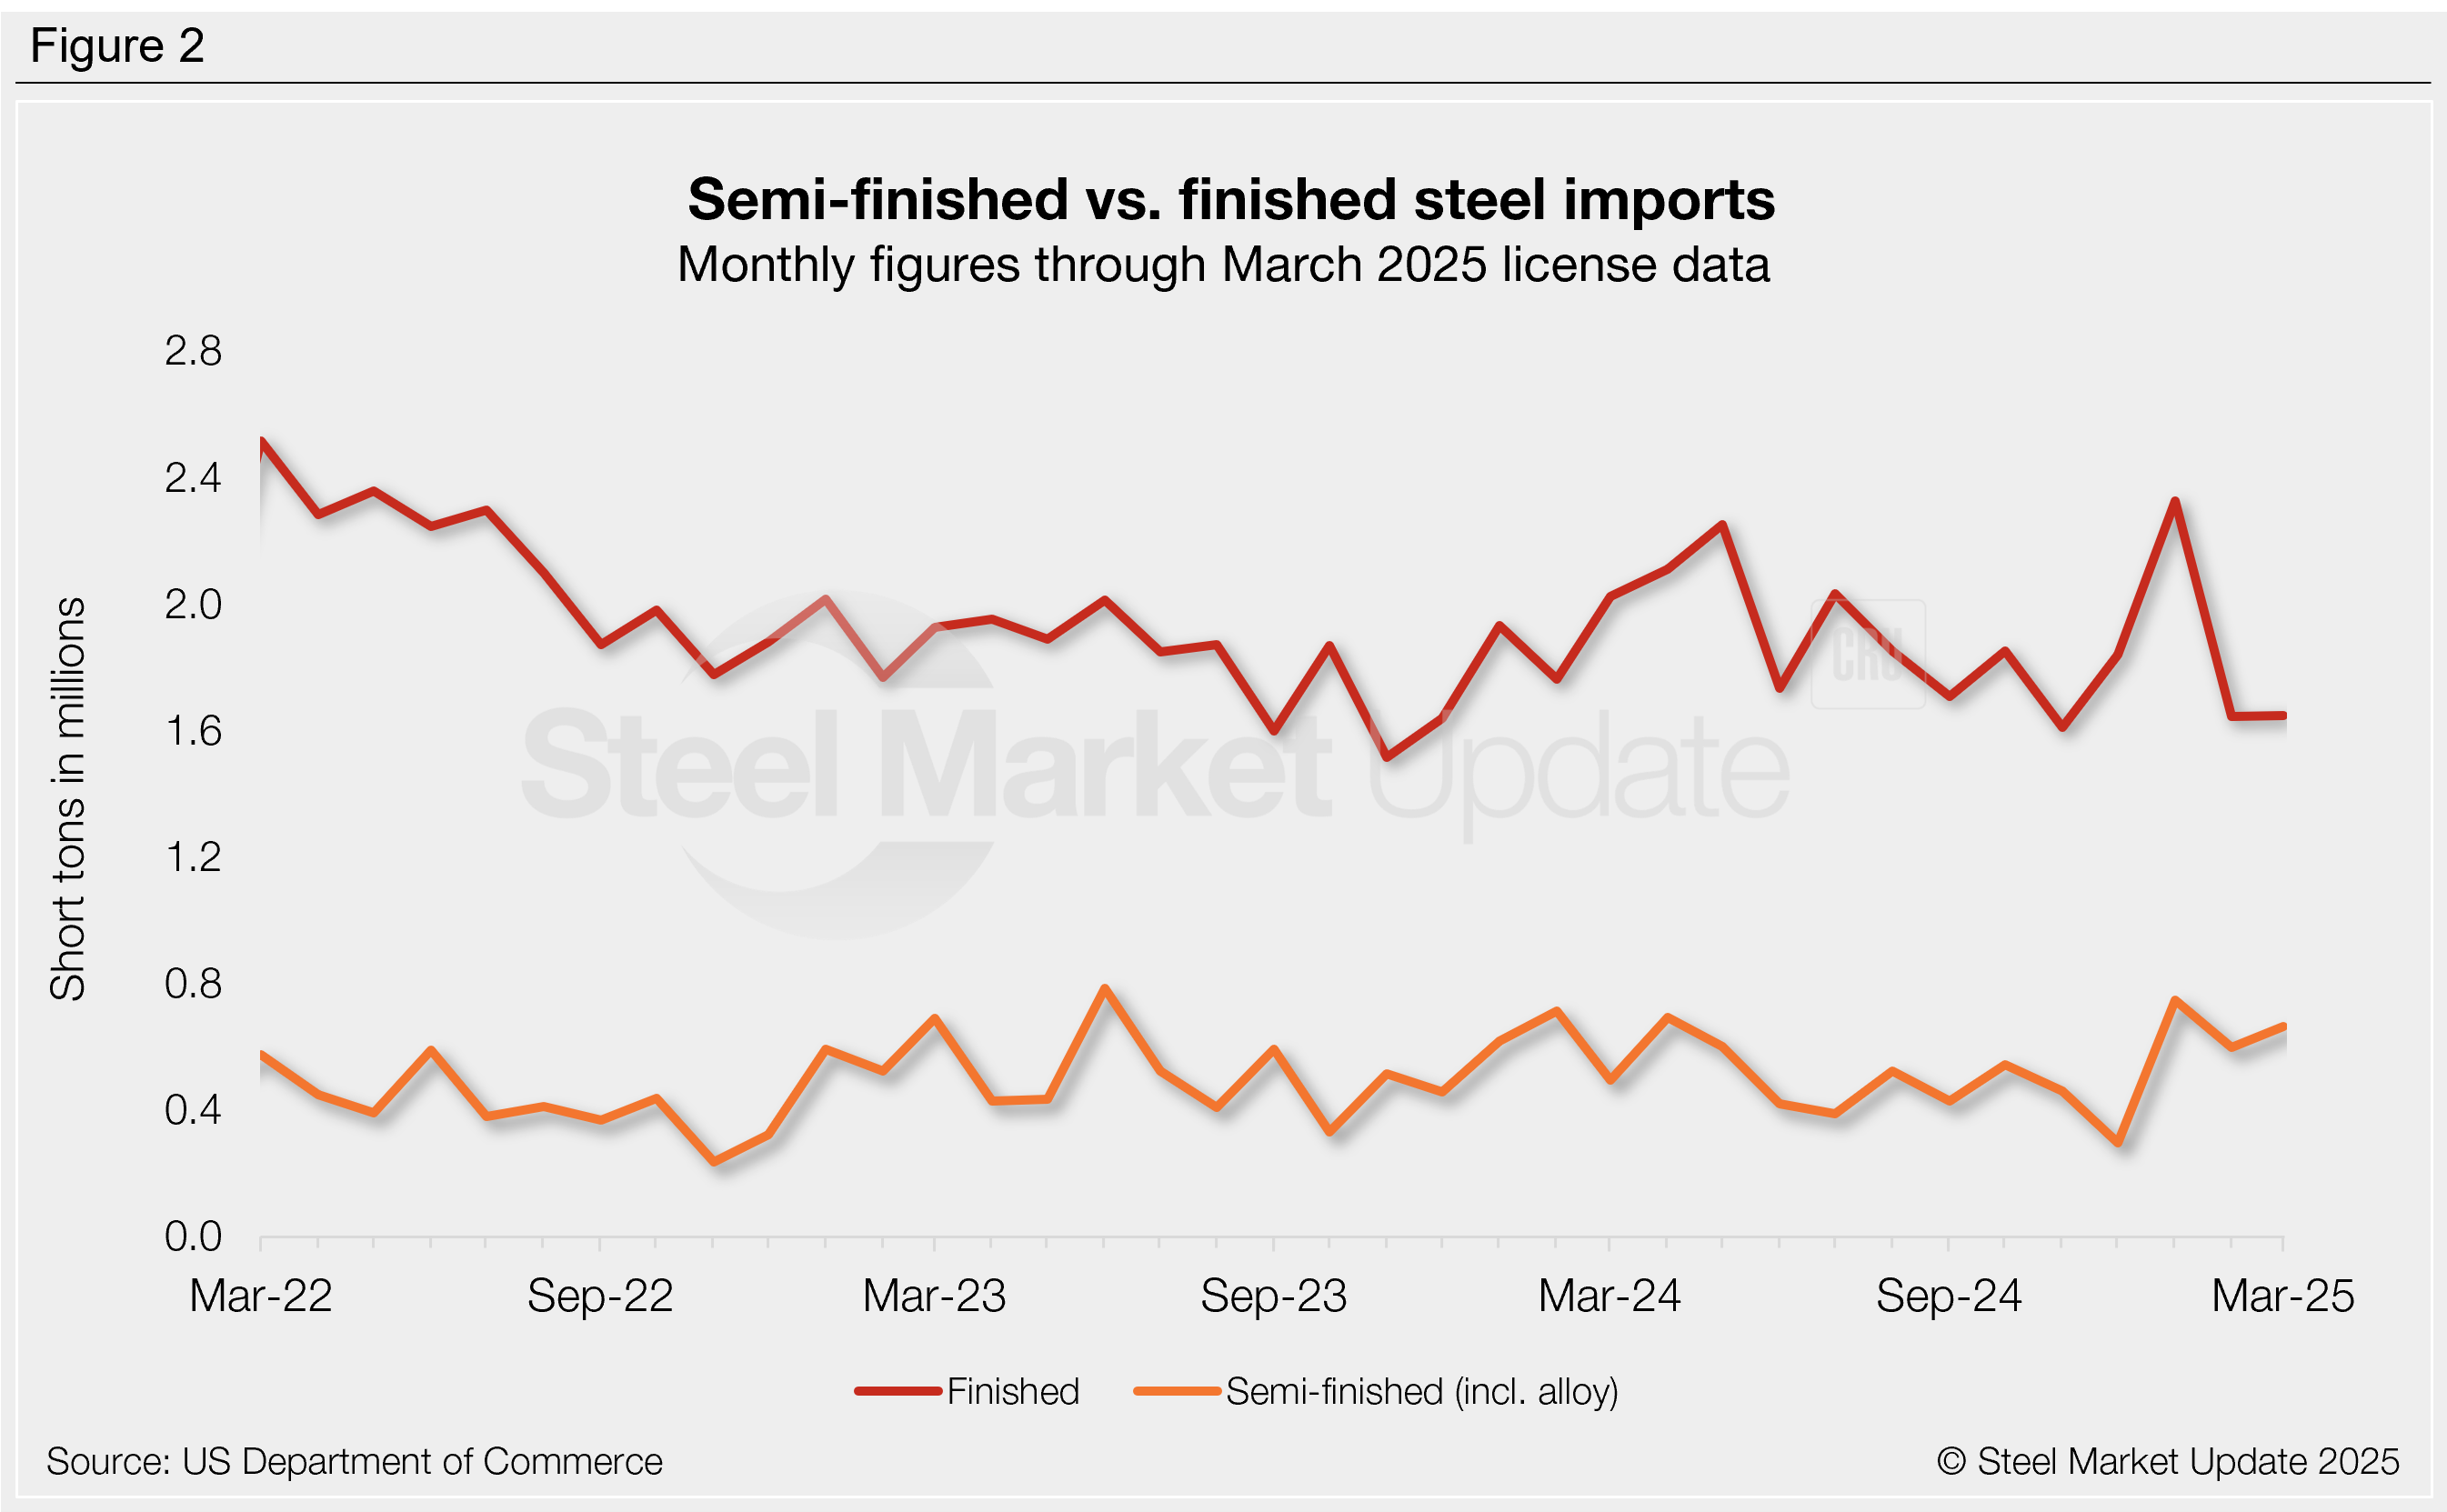
The decline in imports from January to February was mostly seen in finished product rather than semi-finished. Finished steel imports fell 683,000 st or 29% m/m from January’s 32-month high, totaling 1.64 million st (Figure 2). This is the second-lowest monthly rate seen in the past 14 months. March finished import licenses are currently in line with February levels.
Meanwhile, semi-finished steel imports (mostly slabs to be further processed by a mill) fell 149,000 st or 20% in February to 599,000 st. This follows a 19-month high seen one month prior. (Recall that December semi-finished imports had fallen to a two-year low). March licenses currently show an 11% m/m rebound.
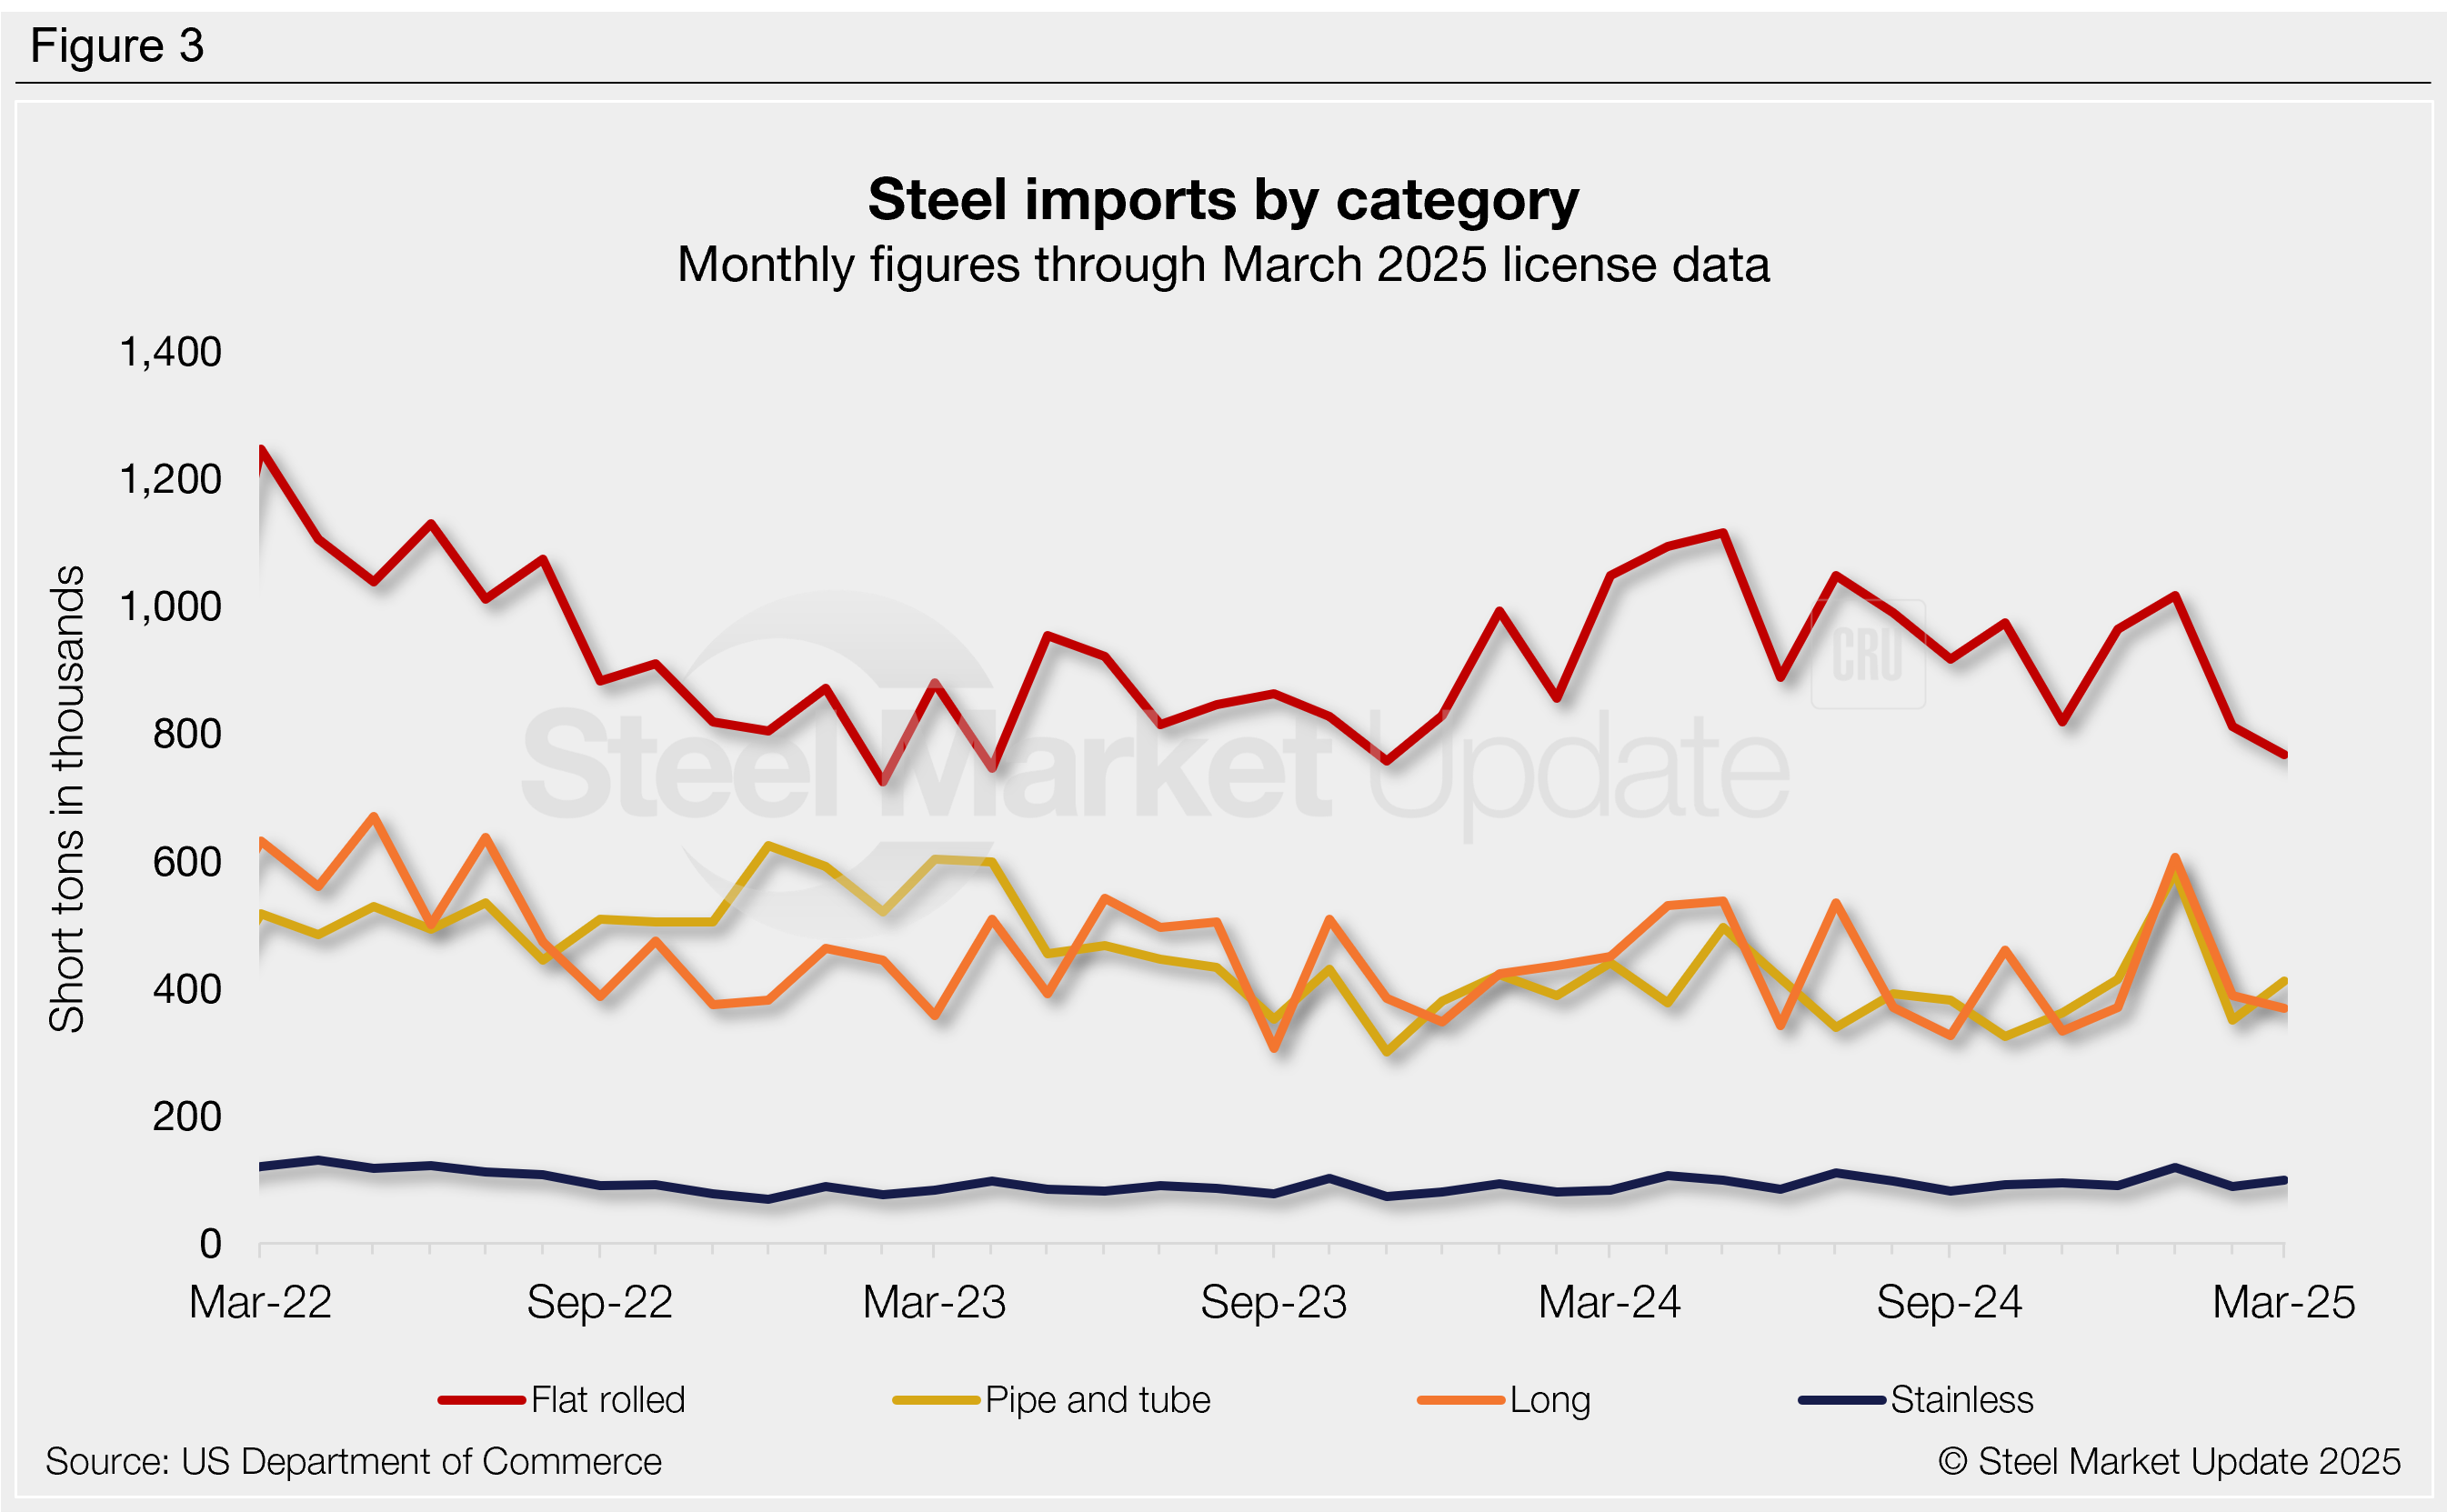
Imports by category
Figure 3 shows monthly imports by popular steel product categories. Noteworthy mentions by category include:
- Flat-rolled imports fell 20% m/m in February, with March licenses down another 5%.
- Imports of long products fell 36% m/m in February following January’s two-and-a-half-year high. March licenses are currently down another 5%.
- Pipe and tube imports dropped 40% m/m in February, erasing the 41% gain seen in January (which had brought imports to a 21-month high.) March licenses are currently up 17% m/m.
- February stainless imports fell 25% m/m from January’s six-month high. March projections are currently up 11% m/m.
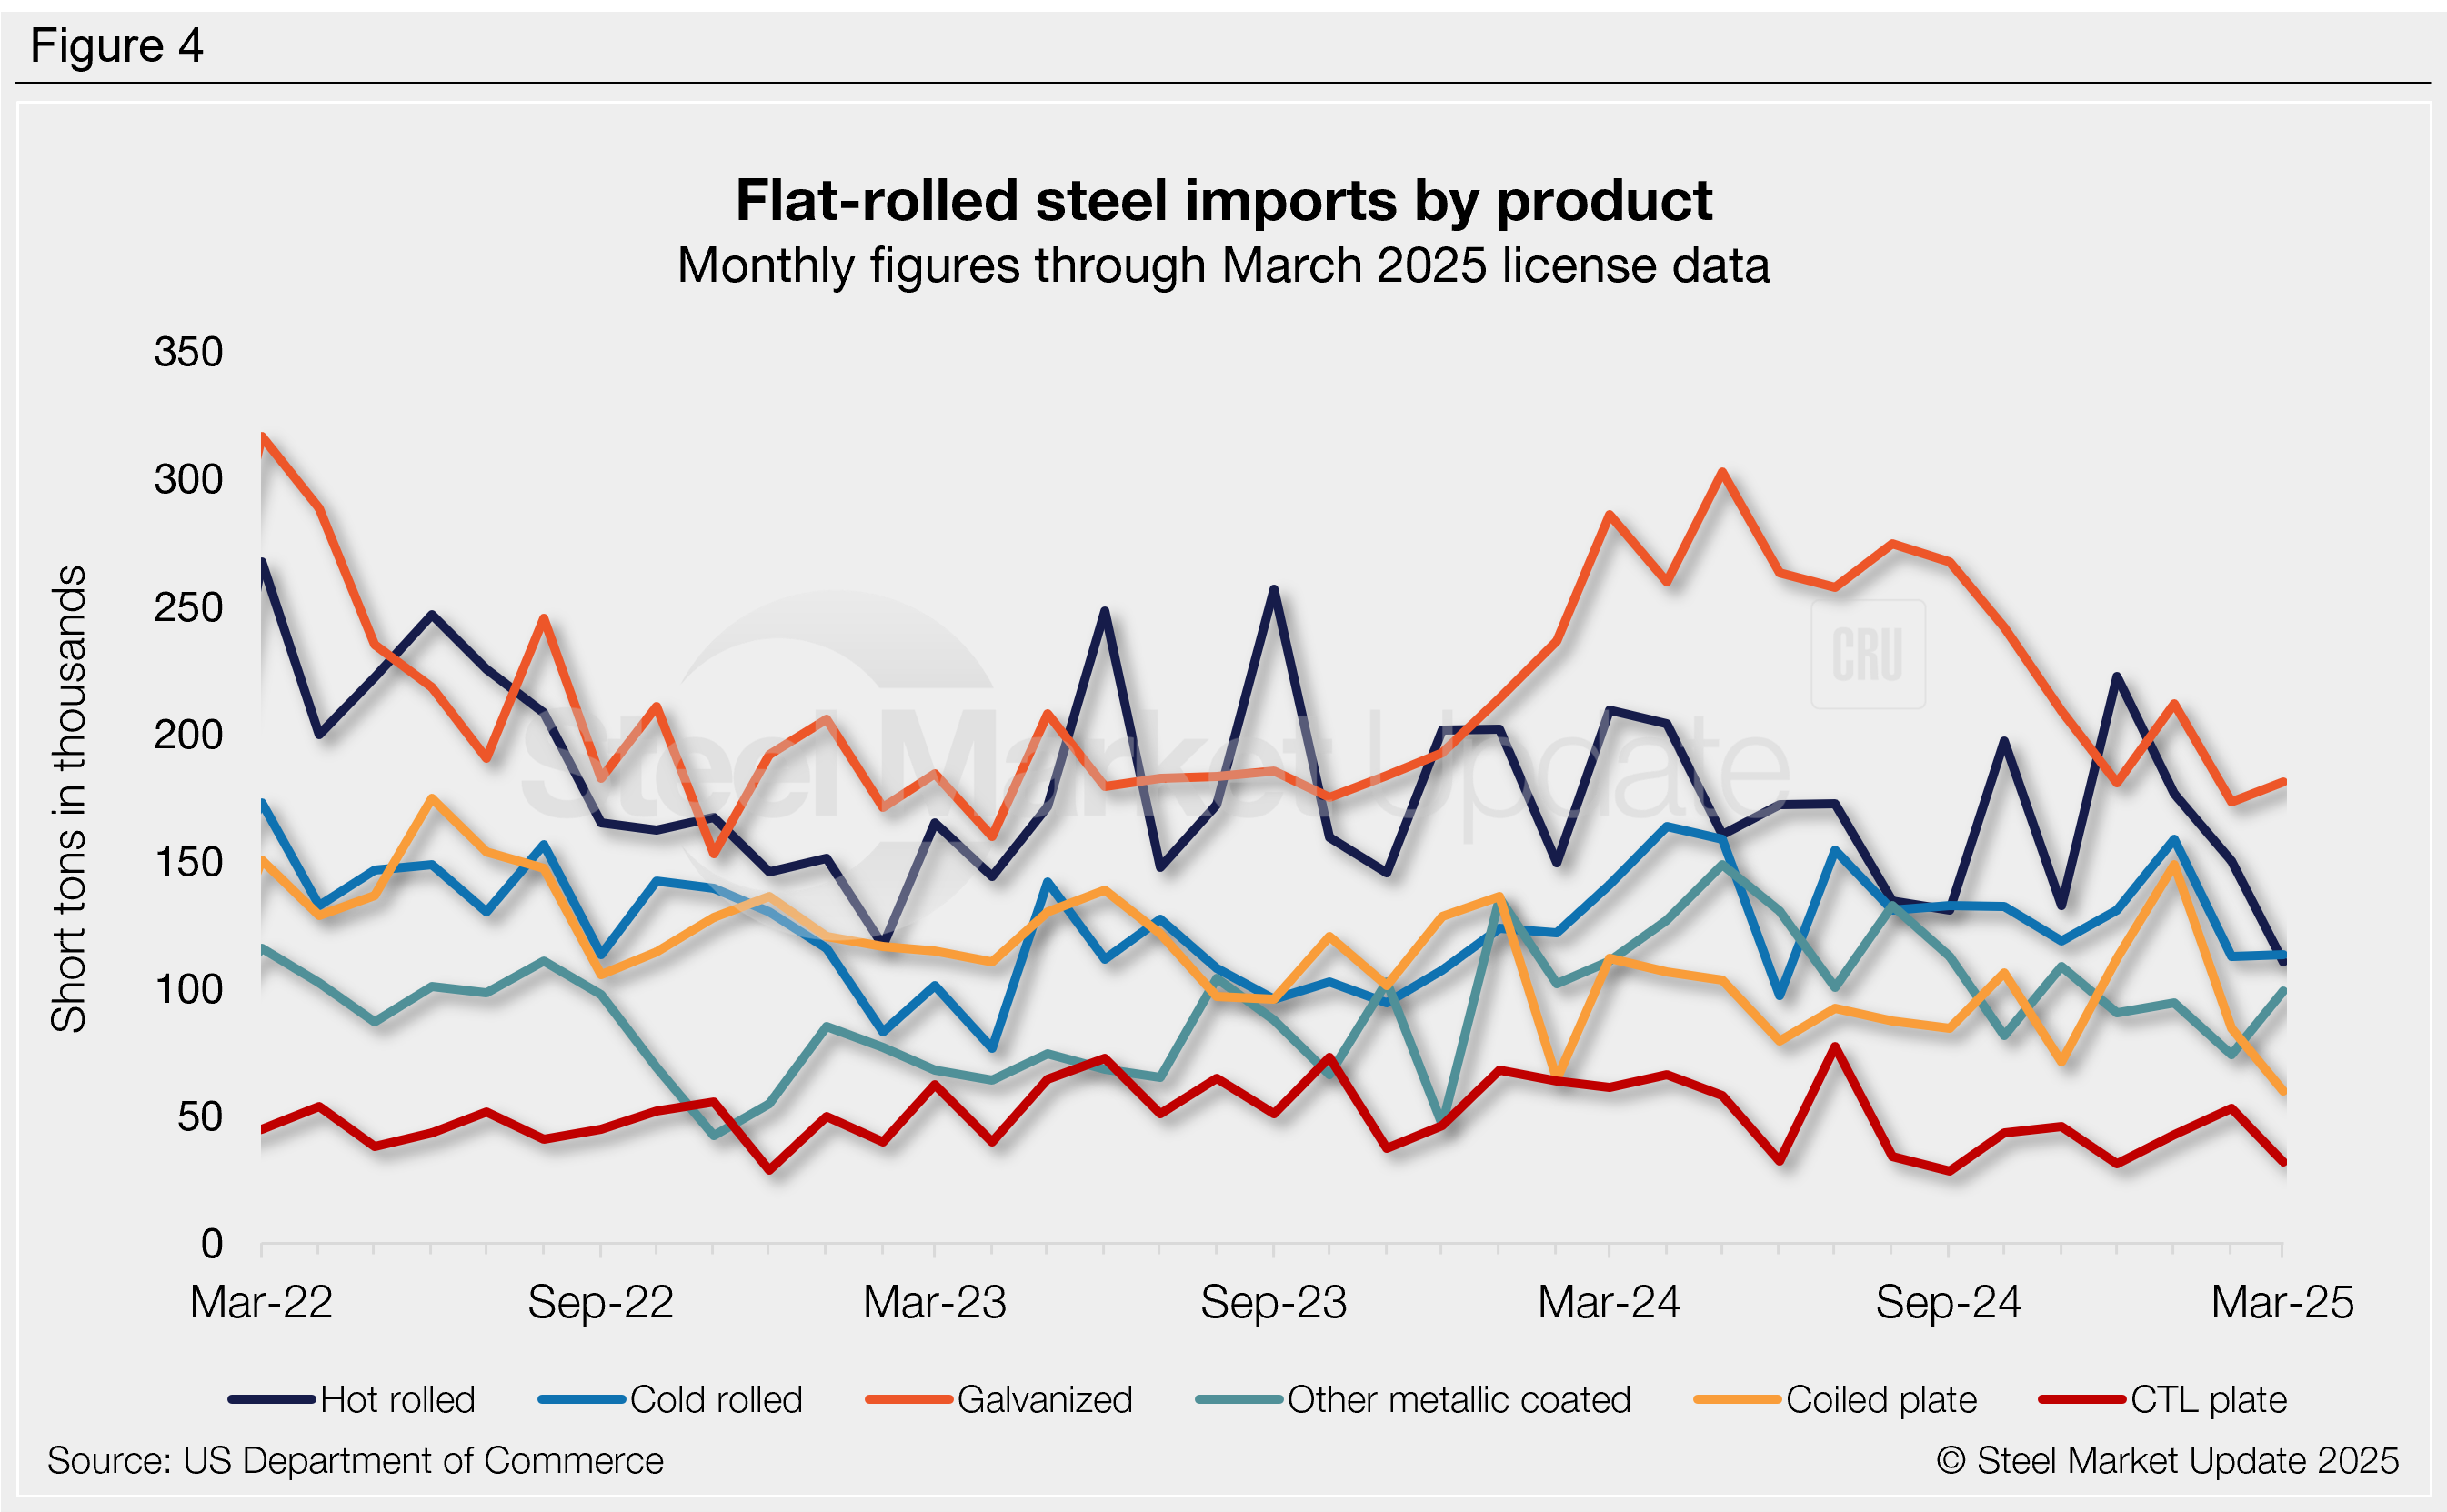
Flat-rolled imports
Figure 4 shows flat-rolled imports by popular products. Six of the seven select products declined from January to February, with only cut-to-length (CTL) imports increasing. March license data is mixed across these products, with three higher and three lower than February. Key highlights:
- Hot-rolled coil imports fell 15% m/m in February following December’s 15-month high. March levels are down another 26% to a potential four-year low.
- Cold-rolled coil imports declined 29% m/m in February to an eight-month low. License data through March shows a 1% m/m increase.
- Galvanized imports fell 18% m/m in February to a 22-month low, while March licenses have recovered 5%.
- Other-metallic coated imports fell 21% m/m in February to a 13-month low. March licenses are currently up 33%.
- Coiled plate imports fell 43% m/m in February from January’s two-and-a-half-year high. March licenses are down another 29% to a potential four-year low.
- CTL plate imports recovered 24% m/m in February to a seven-month high. March licenses are currently back down 40%.
- Tin plate imports fell 1% m/m in February, and March licenses are down another 6% m/m.
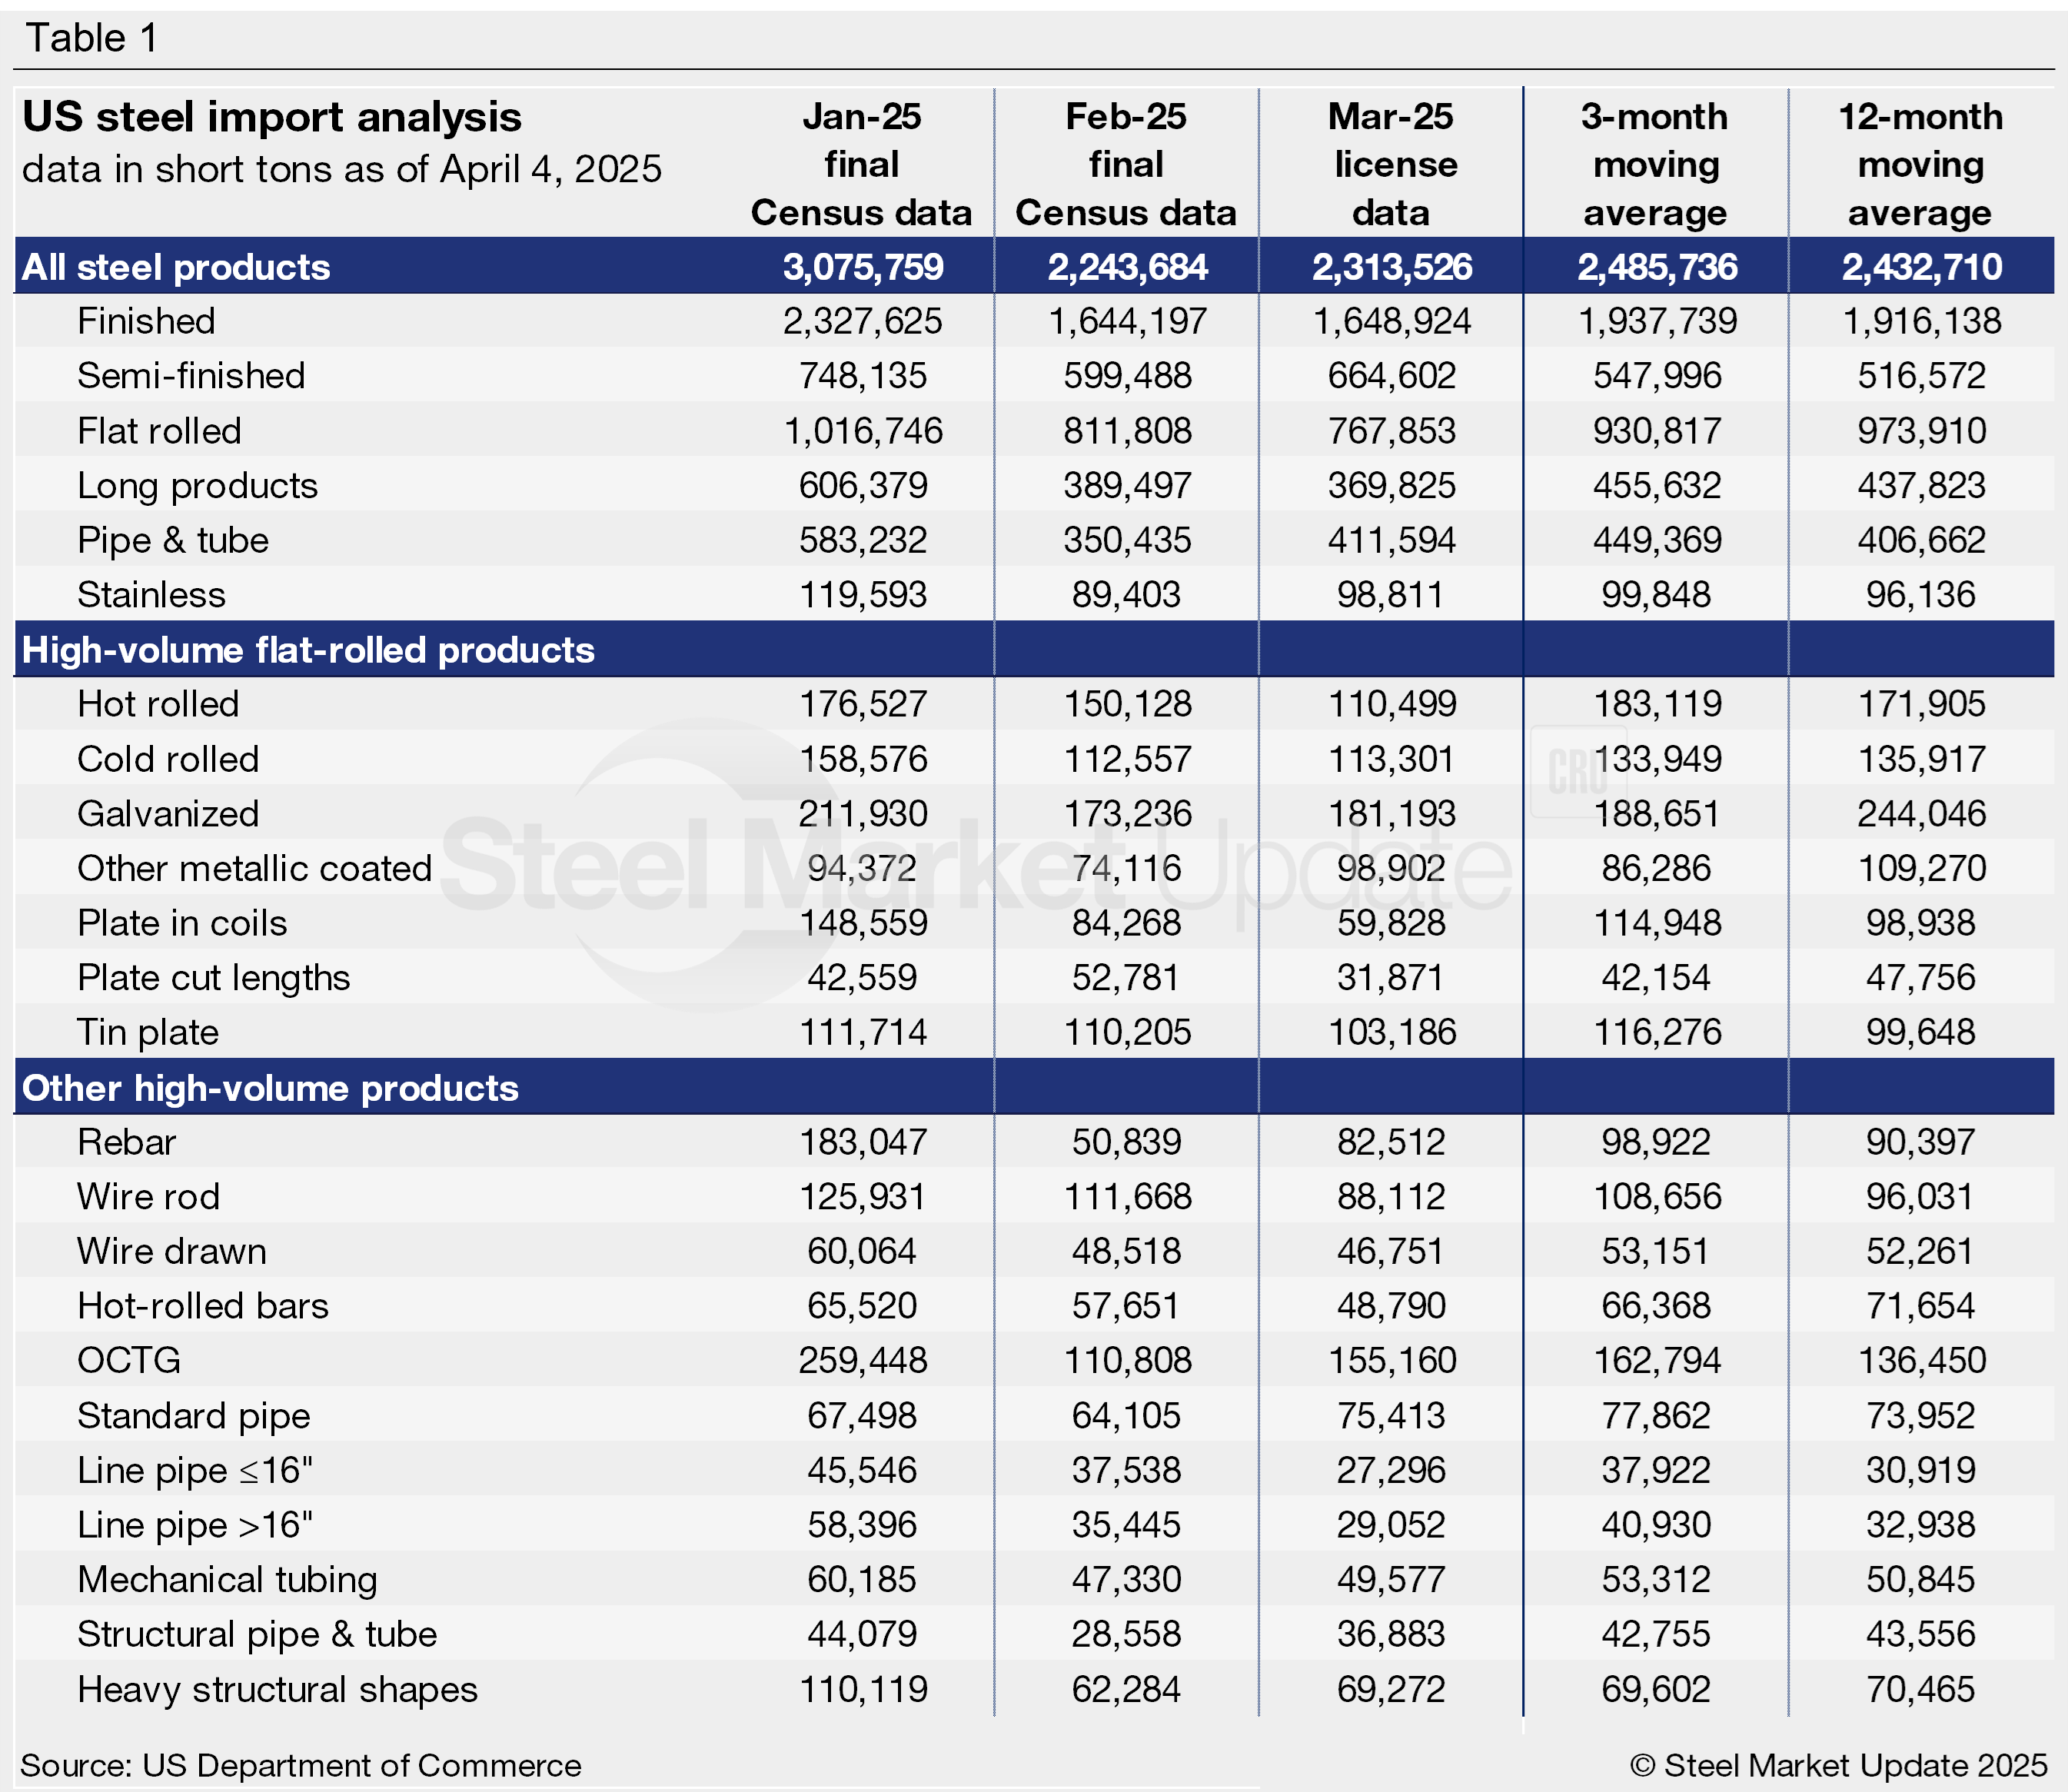
Imports by product
Table 1 provides further detail into imports by product, highlighting high-volume steel products (click to expand). Explore this steel trade data deeper on the Steel Imports page of our website.