Analysis
June 5, 2025
US steel imports slumped in April, recovered in May
Written by Brett Linton
Following a modest rebound in March, US steel imports plummeted to a five-month low in April, according to recently released US Commerce Department data.
In fact, April represented the third-lowest monthly import rate in nearly two and a half years, with several product categories falling to multi-year lows.
May license data indicate a partial recovery. But import volumes remain on the low side compared to recent years.
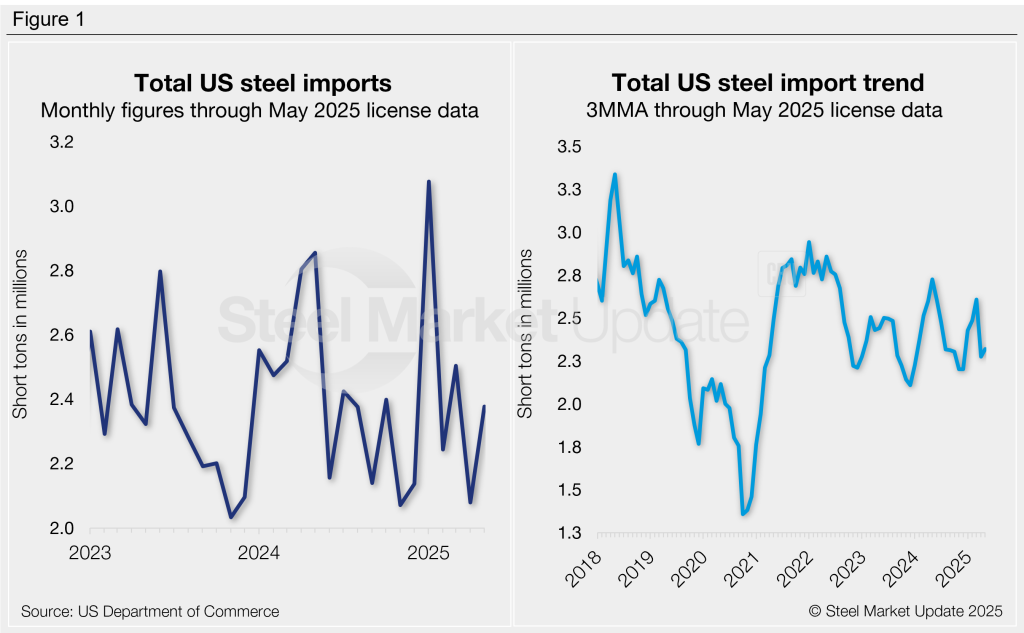
Recall that imports spiked up to 3.08 million short tons (st) in January of this year, the highest monthly rate seen since April 2022. Imports have trended lower since then, with April volumes falling 17% month over month (m/m) to 2.08 million st. May license data suggests a potential 14% recovery, bringing imports back to levels seen in late 2024 (Figure 1, left).
Over half of the steel that entered the US in April was exported from just four countries: Canada (21%), Brazil (14%), South Korea (9%), and Mexico (8%). Other key suppliers included Germany, Taiwan, Romania, Japan, Vietnam, India, the Netherlands, Algeria, China, and Austria, each supplying 2-5% of the monthly total. Combined April shipments from these 14 countries accounted for 84% of all imports.
Visit the International Trade Administration’s Steel Import Monitor to explore steel import data by country, category, or specific product.
Import trends
Import data can be analyzed on a three-month moving average (3MMA) to smooth out monthly fluctuations and better highlight trends (Figure 1, right). On this basis, 3MMA imports touched a ten-month high of 2.61 million st in March, a steep climb from December’s 12-month low of 2.20 million st. The 3MMA declined to 2.28 million st in April, then slightly recovered to 2.32 million st through May licenses. For comparison, imports averaged 2.41 million st per month in 2024 and 2.35 million st per month in 2023.
Imports by product
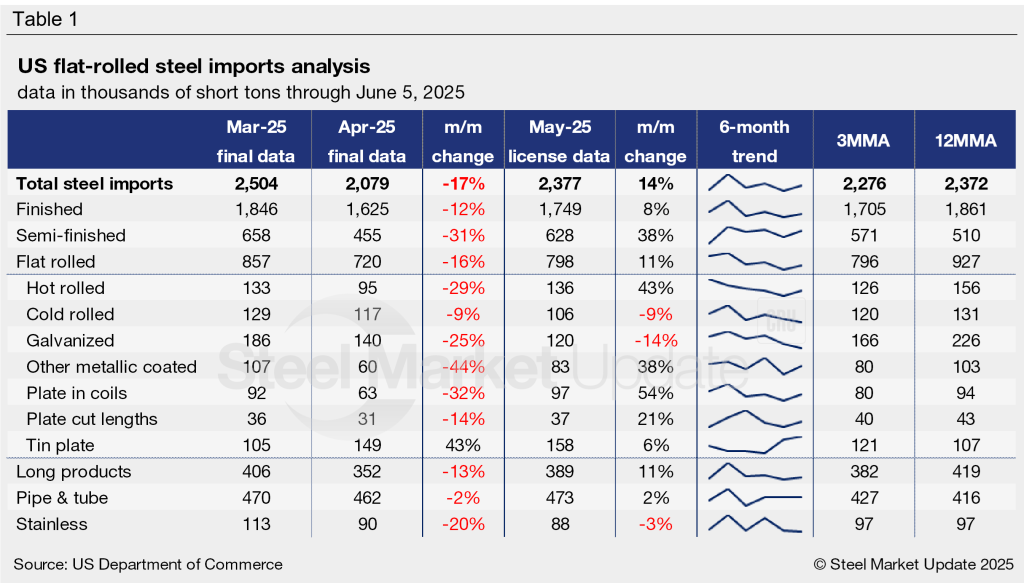
Table 1 provides further detail on imports by product, highlighting high-volume steel products (click to expand). Explore this steel trade data deeper on the Steel Imports page of our website.
Finished vs. semi-finished imports
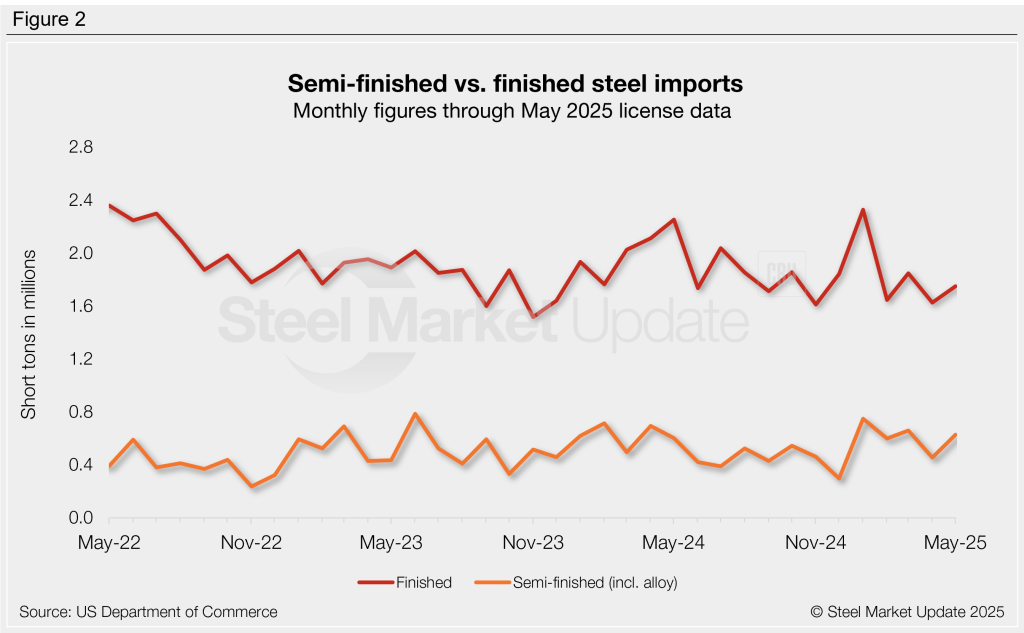
Finished steel products accounted for 78% of April imports, falling to a five-month low of 1.62 million st (Figure 2). That’s down 12% from March’s 1.85 million st rate, when finished steel represented 74% of the mix. May finished steel licenses are currently at 1.75 million st (74% of total imports). In 2024, finished products represented 79% of total imports, up from 78% in 2023, but down from 83% in 2022.
Semi-finished imports (mostly slabs to be further processed by a mill) totaled 455,000 st in April, down 31% m/m and one of the lower rates seen in recent months. May licenses are currently up to 628,000 st. Semi-finished imports averaged 515,000 st in 2024 and 524,000 st in 2023.
Imports by category
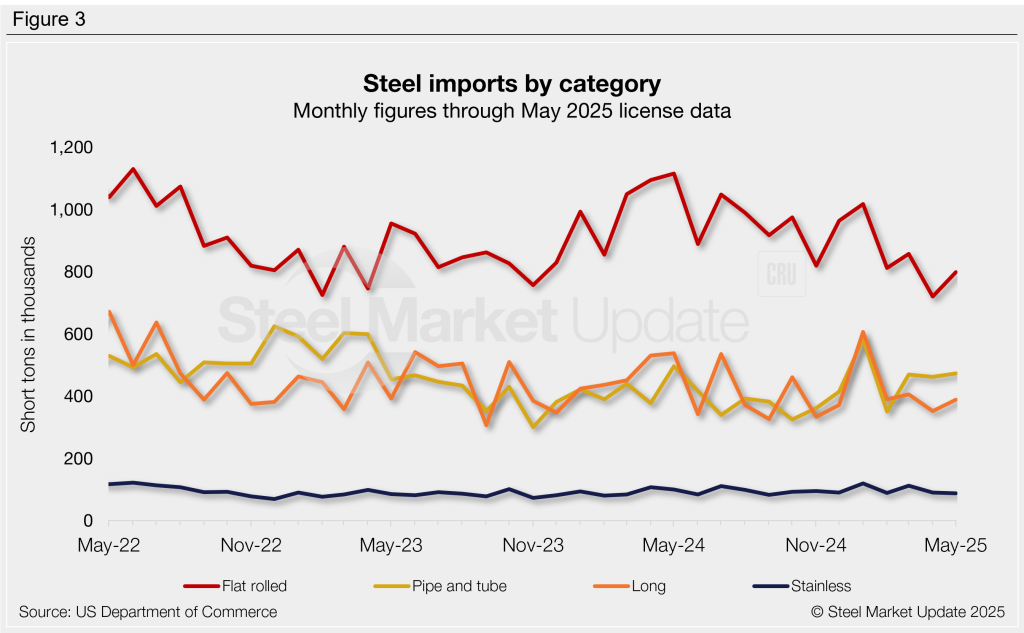
Figure 3 shows monthly imports by popular steel product categories. Noteworthy mentions by category include:
- Flat-rolled imports fell 16% m/m in April to a four-year low, then rebounded 11% in May.
- Long products declined 13% in April to a five-month low, recovering 11% in May.
- Pipe and tube slipped 2% in April then bounced back 2% in May to one of the highest rates seen in two years.
- Stainless fell 20% in April and declined another 3% in May to an eight-month low.
Flat-rolled imports
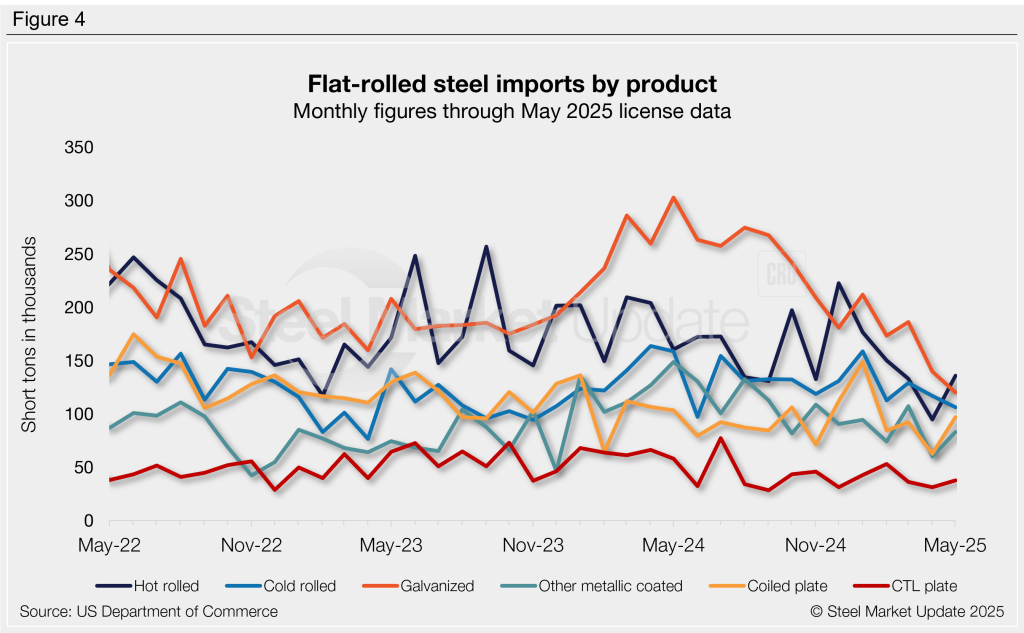
Figure 4 tracks flat rolled imports for six popular sheet products. All but one of these products decreased from March to April, and then all but two recovered in May. Key highlights:
- Hot-rolled coil imports fell 29% m/m in April to the lowest level seen since 2009. May licenses are back up 43%.
- Cold-rolled coil fell 9% in April and another 9% in May, hitting an 11-month low.
- Galvanized declined 25% in April then fell another 9% in May to a 12-year low.
- Other-metallic coated receded 44% in April to a 16-month low. May licenses are currently back up 38%.
- Coiled plate declined 32% in April to a four-year low, then recovered 54% in May to a five-month high.
- CTL plate declined 14% in April to a seven-month low, rebounding 21% in May.