

Prices

August 14, 2025
HR Futures: Plummeting open interest shows complacent buyers ignoring '26 risk
Written by David Feldstein
David Feldstein is the president of Rock Trading Advisors. Rock Trading Advisors is a National Futures Association Member Commodity Trade Advisory. It provides commercial clients with price risk solutions in ferrous, energy, and interest rate derivatives markets.
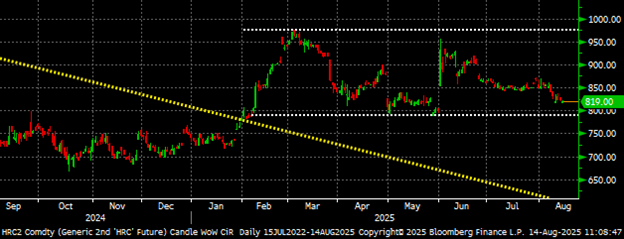
There is not much to report with respect to the CME Midwest HRC futures. Trading volume across the HRC futures curve plummeted to 330,000 tons in July, down from 628,000 tons in June. The rolling 2nd-month HRC future broke above its three-and-a-half-year downtrend at the end of January.
In February, the 2nd-month future spiked in response to President Trump’s 25% Section 232 tariff on steel imports and then drifted back down in March, April and May. The 2nd month future spiked again in June following Trump’s 50% S232 tariff on steel, having drifted back down on light volume since.
HRC futures have been rangebound for the past six months. Now, I could end this article right here and now, except there is just one thing: “Brevity is one of David Feldstein’s strongest skills,” said no one, ever.
Rolling 2nd month CME HRC future $/st
We live in the age of information and you expect not only informational value here, but maybe a little entertainment? Plus, it is a slow day in August, so I hope I don’t get in trouble with the boys at SMU taking the long way home. In fact, let’s not think about it as the long way, but rather the scenic route. There will be charts.
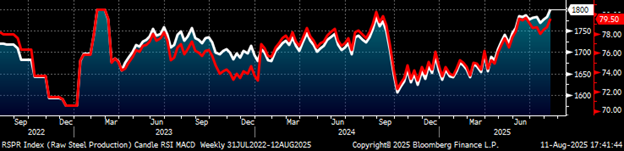
The AISI Raw Crude Steel Production Index rose to 1.8 millions tons last week, its highest week’s production since February 2023.
AISI raw crude steel production
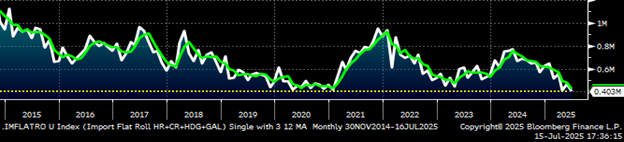
Clearly, domestic mills have benefited from the steel import tariff taking market share from their international competition as flat rolled imports have fallen dramatically.
How dramatically have the fallen?
First-half imports of HRC, CRC, HDG and Galvalume were down 1.25 million short tons (st) year over year (y/y). Annualized, that is roughly the same annual production capacity of Nucor’s Crawfordsville, Ind., facility.
Now, if Nucor Crawfordsville were to suddenly come offline for the next six months, then the steel market would go crazy! Instead, the decline in imports has been more of a slow creep, with the consequences not yet fully known. However, it is clear that a material improvement in domestic mill production and capacity utilization rates has been one of the consequences.
Imports – 4 flat-rolled sheet (HR, CR, HDG & Galv)
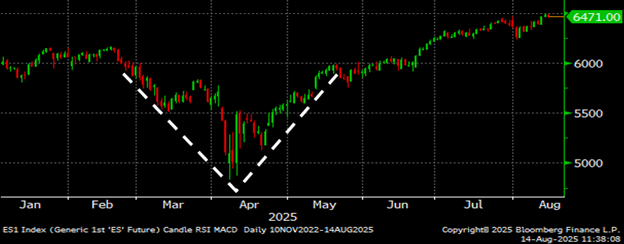
It is widely accepted that the stock market is a leading indicator, that the stock market discounts the future cash flows of the listed firms and, collectively, the US economy’s performance. Shortly after President Trump announced his 25% steel and aluminum tariffs while also promising more tariffs to come, the S&P 500 began to sell off.
The sell-off accelerated in April following “Liberation Day.” Then it rebounded, having returned to where it started from by mid-May. This created a V-shaped recovery. The S&P 500 has continued to climb ever since, making new high after new high.
S&P 500
Yesterday, the CRU Midwest HRC Index printed $838. On Aug. 14, 2024, the CRU Midwest HRC Index printed $658. Thus, the Index is up $180 or 27.3% y/y . While the price is dramatically higher today than it was a year ago, the steel market feels sluggish. The buying community can be characterized as apathetic.
August’s ISM Manufacturing PMI was below 50 for the sixth straight month in August. The ISM is an example of a soft sentiment reading. It is a survey that asks participants if things were better, the same or worse than they were the month before. Sentiment can be defined as a thought, opinion, or attitude influenced by emotion rather than logic. However, evidence is building that sentiment has been improving. The S&P 500 is one example.
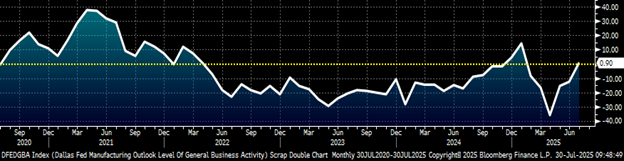
The Dallas Fed’s Manufacturing Outlook is another example of a V-shaped recovery in sentiment. Since it is a “gut” feeling after all, it can change quickly. The key is that demand can change much more rapidly than supply.
Dallas Fed Manufacturing Index
There are several “hard” data points that indicate the economy is performing much better than the “gut feeling” felt by consumers and business folks. Industrial production specific to manufacturing only was up 0.8% y/y in June, marking its sixth straight month of y/y growth. July’s auto sales came in strong.
How strong were they?
At a 16.4-million seasonally adjusted annual rate (SAAR), they were the best for the month of July since July 2019, while also beating expectations they would increase to a 16M SAAR. Now, June’s auto sales were brutal at down 4.3% y/y.
June was also a rough month for the steel business. Not only are auto sales a major “driver” for the steel industry, but they are also a barometer of manufacturing in general. The point is July was much improved vs. June for both auto sales as well as the steel and manufacturing industries.
Is manufacturing in a V-shaped recovery like what we saw in the S&P 500 and the Dallas Fed Index? If the answer is yes, then will it also continue higher following a similar path to the S&P 500?
US Wards Auto Sales SAAR
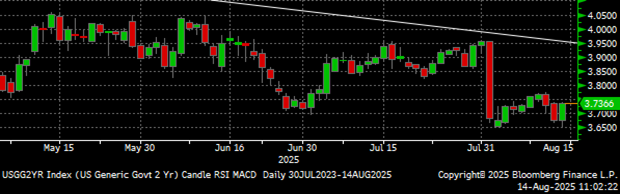
On July 30, the Federal Reserve concluded its July meeting, announcing no change to the Fed funds rate. Two days later on Aug. 1, July’s US labor report was released with the Bureau of Labor Statistics’ 258,000-job downward revision to May and June’s combined payrolls shocking markets.
However, there is a silver lining to the report that was released. Bond markets reacted to the news buying up bonds and sending rates sharply lower. The two-year Treasury rate dropped from 3.95% to 3.67%. The unemployment rate ticked up to a solid 4.2% with NSA jobs of 159.2 million at their sixth-highest for any month on record. Is this not a Goldilocks scenario?
As Maximus said in Gladiator: “Are you not entertained?”
US 2-year Treasury rate
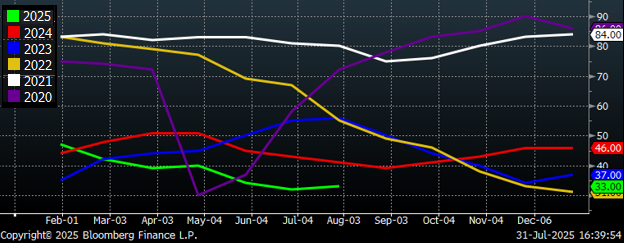
Indices like the ISM PMI, Architectural Billings Index, and the NAHB Home Builders Market Index are diffusion indices that indicate growth above 50, contraction below 50, and recession if the index remains at or below 42 for a 3-month period. At 33 in July, and below 35 for the past 3 months, the NAHB Home Builders Index is in a depression.
National Association of Home Builders Market Index
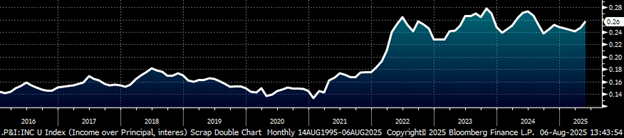
This chart takes US median income and divides it by the median annual US principal and interest (mortgage) payment. This shows the percentage of the average American’s income going to their housing payment has increased from roughly 14-18% before the pandemic to 23-28% since the Fed started raising interest rates in early 2022.
The ratio for the percentage of median income needed to make the median annual rent payment climbs from 16-18% pre-pandemic to 20-24% since 2022.
This is largely due to the Fed driving interest rates higher into restrictive territory in order to fight inflation. However, the unintended consequences of the Fed’s policy have had both direct and indirect effects.
New homes have become largely unaffordable, while existing homes are in a shortage situation due to current mortgage rates around 6.75% vs. 30-year mortgage rates around 3.5% that homebuyers received during 2020 and 2021. This existing home shortage, the last of the Covid-19 supply shortages, as I like to call it, has held home values up. This has weighed on consumers and put upwards pressure on inflation readings. In a perplexing way, higher interest rates are prolonging this period of elevated inflation.
US median principal and interest as a percentage of median Income
The Goldilocks scenario is that jobs are still plentiful with an unemployment rate at 4.2%, but finally some relief appears to be coming as the jobs data finally looks to have convinced the Fed, or at least the bond market, to back off the currently restrictive rates.
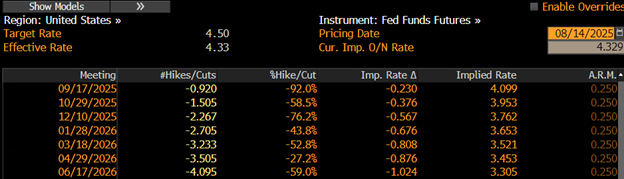
Bloomberg derives implied forward values for the Fed funds rate with the probability of a 25% rate cut at September’s meeting going from 67% just before the Federal Open Market Committee (FOMC) meeting, to 40% after the meeting, to 90% after the jobs report, to 92% today – even after the stronger than expected PPI reading.
What is even more important is that the expectations are for additional rate cuts, with the implied Fed funds rate to be down 80 basis points from where it is today by the Fed’s March 18 meeting.
A deep cut in rates will be extremely stimulative and helpful to the economy, but even more so to the very weak residential housing market. Nonresidential construction would benefit as well. The list of industries that lower rates will help is long, but the bottom line is if interest rates decline as indicated below, the steel industry will see a V-shaped recovery like the one seen in the S&P 500 above.
While all of this information is useful, what does it have to do with HRC futures?
Open interest is the number of outstanding futures contracts, or tons in this case, across a product’s curve. Open interest exploded following February’s 25% tariff announcement, climbing to a high of 831,000 tons. However, there was a sharp drop-off in open interest in the months after the June future. With the July future having just expired, open interest has tanked to 454,000 tons as of Wednesday night.
Rolling 2nd month CME HRC future $/st & open interest (red) (22-day MA yellow)
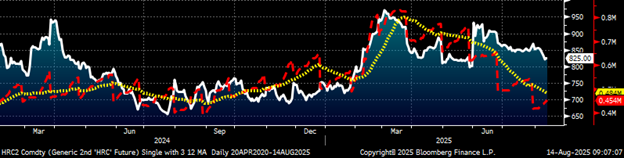
Commercial futures market participants held a high of 363,000 long tons on March 18, and still held 314,000 tons of longs on May 27.
As of Aug. 5, commercial participants’ collective long futures position fell to only 158,000 tons. This information is a canary in the coal mine telling us that steel buyers’ interest in fixed priced deals via the futures market has plummeted. The behavior seen in the futures market is an insight into manufacturing firms’ short-term focused steel supply purchasing strategy. There is tremendous risk embedded in this strategy given the relatively tighter supply.
There are 11 days until the SMU Steel Summit and 140 days until Jan. 1. The first quarter is coming up on the horizon and 2026 could be surprisingly strong if the drop-in interest rates indicated above materialize, and results in a boost to construction, auto sales, consumer sales, mortgage refinancing, etc. Demand can move much faster than supply. The US economy’s horsepower has tremendous potential.
Run, horse. Run, horse, run!
The last thing I am going to say here is based on a quote from “”Ferrous” Bueller: “The steel market moves pretty fast. If you don’t stop and look around once in a while, you could miss it.”
Disclaimer
The content of this article is for informational purposes only. The views in this article do not represent financial services or advice. Any opinion expressed by Mr. Feldstein should not be treated as a specific inducement to make a particular investment or follow a particular strategy, but only as an expression of his opinion. Views and forecasts expressed are as of date indicated, are subject to change without notice, may not come to be and do not represent a recommendation or offer of any particular security, strategy or investment. Strategies mentioned may not be suitable for you. You must make an independent decision regarding investments or strategies mentioned in this article. It is recommended you consider your own particular circumstances and seek the advice from a financial professional before taking action in financial markets.


