Analysis

December 19, 2025
SMU Mill Order Index falls in November
Written by David Schollaert
Steel Market Update is pleased to share this Premium content with Executive members. Contact info@steelmarketupdate.com for information on how to upgrade to a Premium-level subscription.
SMU’s Mill Order Index (MOI) tumbled in November after surging the month prior. The fall came as service center intake levels sharply declined, supported by a cut in shipments, according to our latest service center inventories data.
The decline in intake and new order entries in November at a sharp rate underscored the result. The drop comes as service centers likely worked to right-size inventories after capitalizing on recent bottom-dollar prices in October.
In fact, intake was down more than 30% month on month (m/m), while new order entries were down by nearly 50% in November vs. October. Both were at their lowest totals since the pandemic.
Key highlights remain the continued efforts to maintain learner inventories. This is noted by a 4% cut in inventory totals despite a sharp decline (-24%) in shipments m/m in November. The dynamic is an attempt to keep the service center supply in balance with demand.
Cautious buying remains at the forefront, as the downstream marketplace buys on an as-needed basis. Service centers’ daily shipping rates – down 3% from October – were heavily impacted by the slower holiday season, as average shipping days totaled 18, down from 23 days in October, and a year-to-date (YTD) average of 21.5 days.
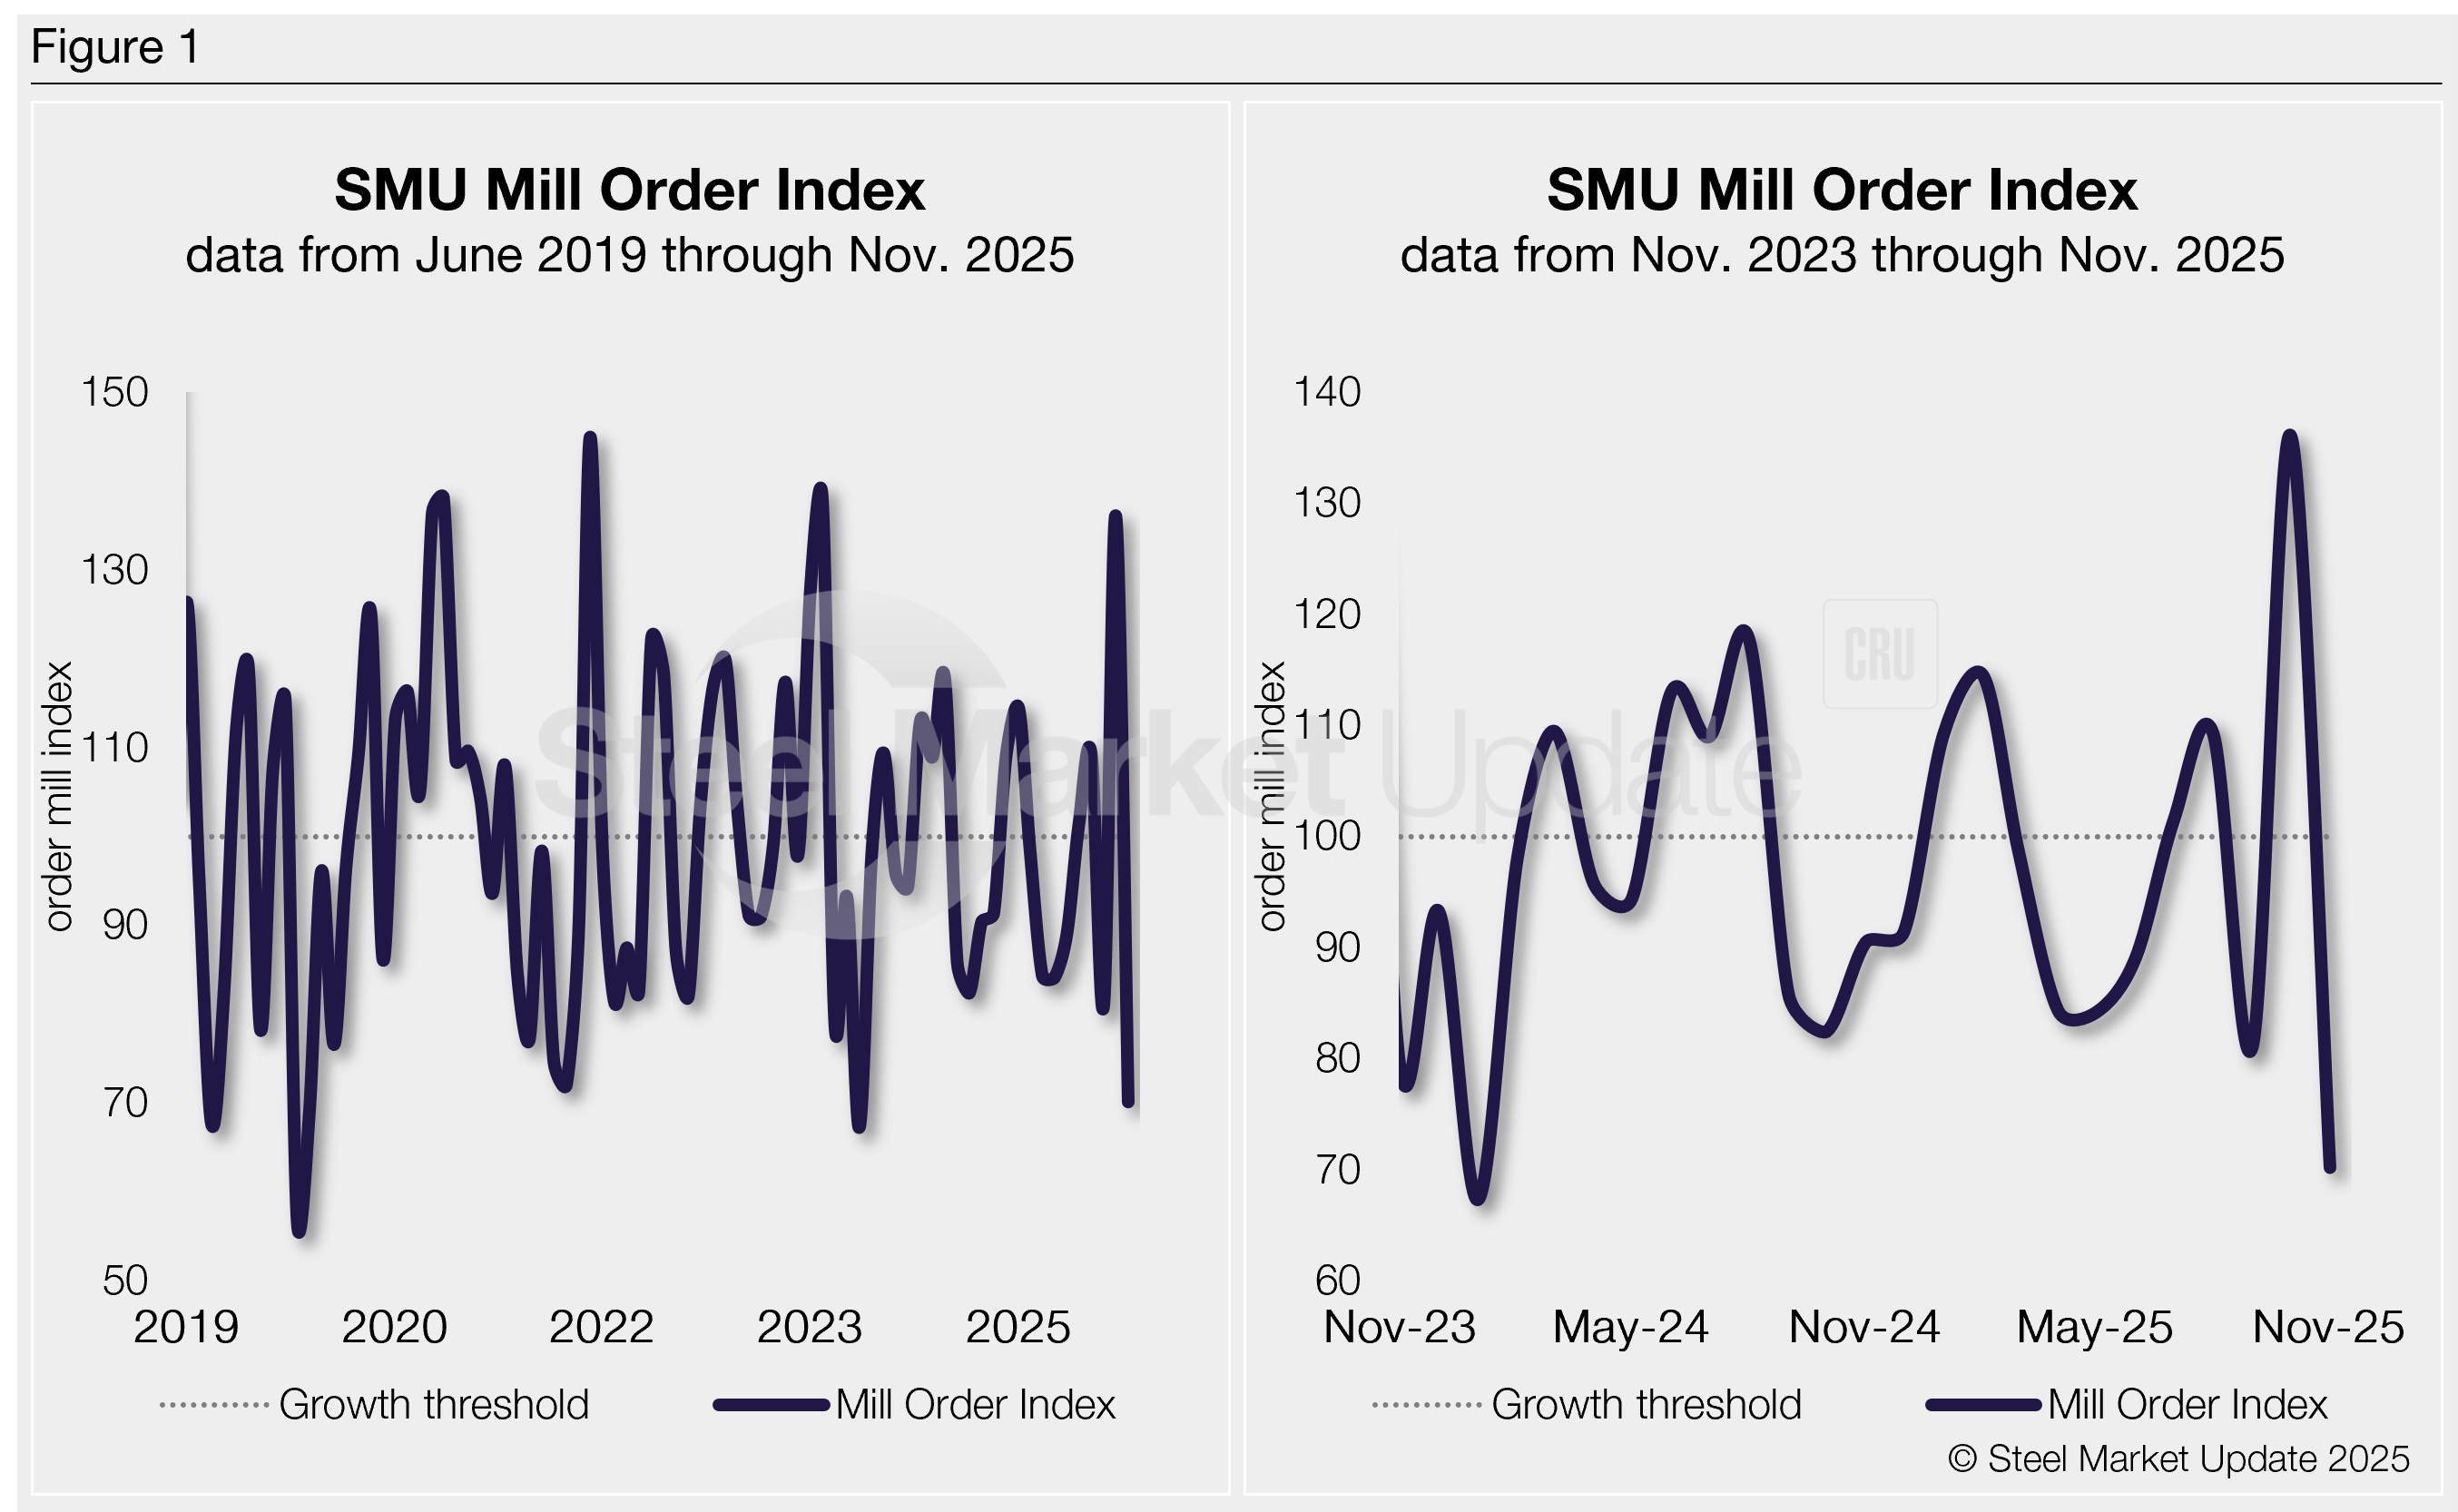
The MOI now stands at 70.1, down nearly 49% from 136.1 in October. It’s the lowest reading since January 2024, and comes on the heels of the highest reading in two years. This is another note to suggest service centers might have timed the market bottom correctly.
Methodology
SMU derives its MOI — a relative index that evaluates the latest change in service center mill order entries — from our monthly service center inventories data. This index is a good indicator of current service center buying patterns, displaying perceived demand and lead times. This stands out because lead times typically signal upcoming moves in steel prices.
The MOI uses a base period, presently 2022-24, to establish a reference point for measuring service centers’ mill orders over time. This base period is assigned an index value of 100. Subsequent MOI values are then calculated relative to this base.
An index score above 100 indicates an increase in buying, and a score below 100 indicates a decrease.
Figure 1 shows the nearly six-year history of the index on the left and provides a closer look at the MOI readings of the past two years on the right (100 = 2022-2024 average).
Background
Although there were brief price surges — sparked by sudden mill increases following tariff announcements — overall market conditions stayed relatively stable and at times sluggish. And were largely held back by stagnant end‑use demand (see the right‑side chart in Figure 1).
Intake volumes climbed through most of Q1, driven by downstream buyers accelerating purchases in anticipation of tariff‑related price hikes. The resulting jump in service‑center orders quickly pushed mill prices higher.
Since reaching a high point in mid‑to‑late March, however, the market has been steadily softening, a trend reflected in the flat-to-declining intake volumes observed since May. The only exception is October, when service centers appear to have timed the market bottom.
The skinny
Intake volumes continued to taper off once the tariff-driven buying rush faded. With downstream customers tightly managing inventories and prioritizing contract fulfillment, service‑center shipments showed no meaningful lift through Q3. And after a notable increase October — new order entries reached a two-year high — they declined by more than 30% in November to their lowest total since April 2020.
Data would indicate that the bump in October was indeed opportunistic buying at bottom-dollar prices and not a fundamental shift in demand. Mills, meanwhile, are holding firm and aiming to sustain — or even raise — prices as 2026 contract negotiations unfold.
SMU’s MOI will likely fluctuate somewhat in December and into early Q1’26. The general expectation is for inventories to rise modestly, with most of that excess typically clearing in January and February — a familiar seasonal pattern.
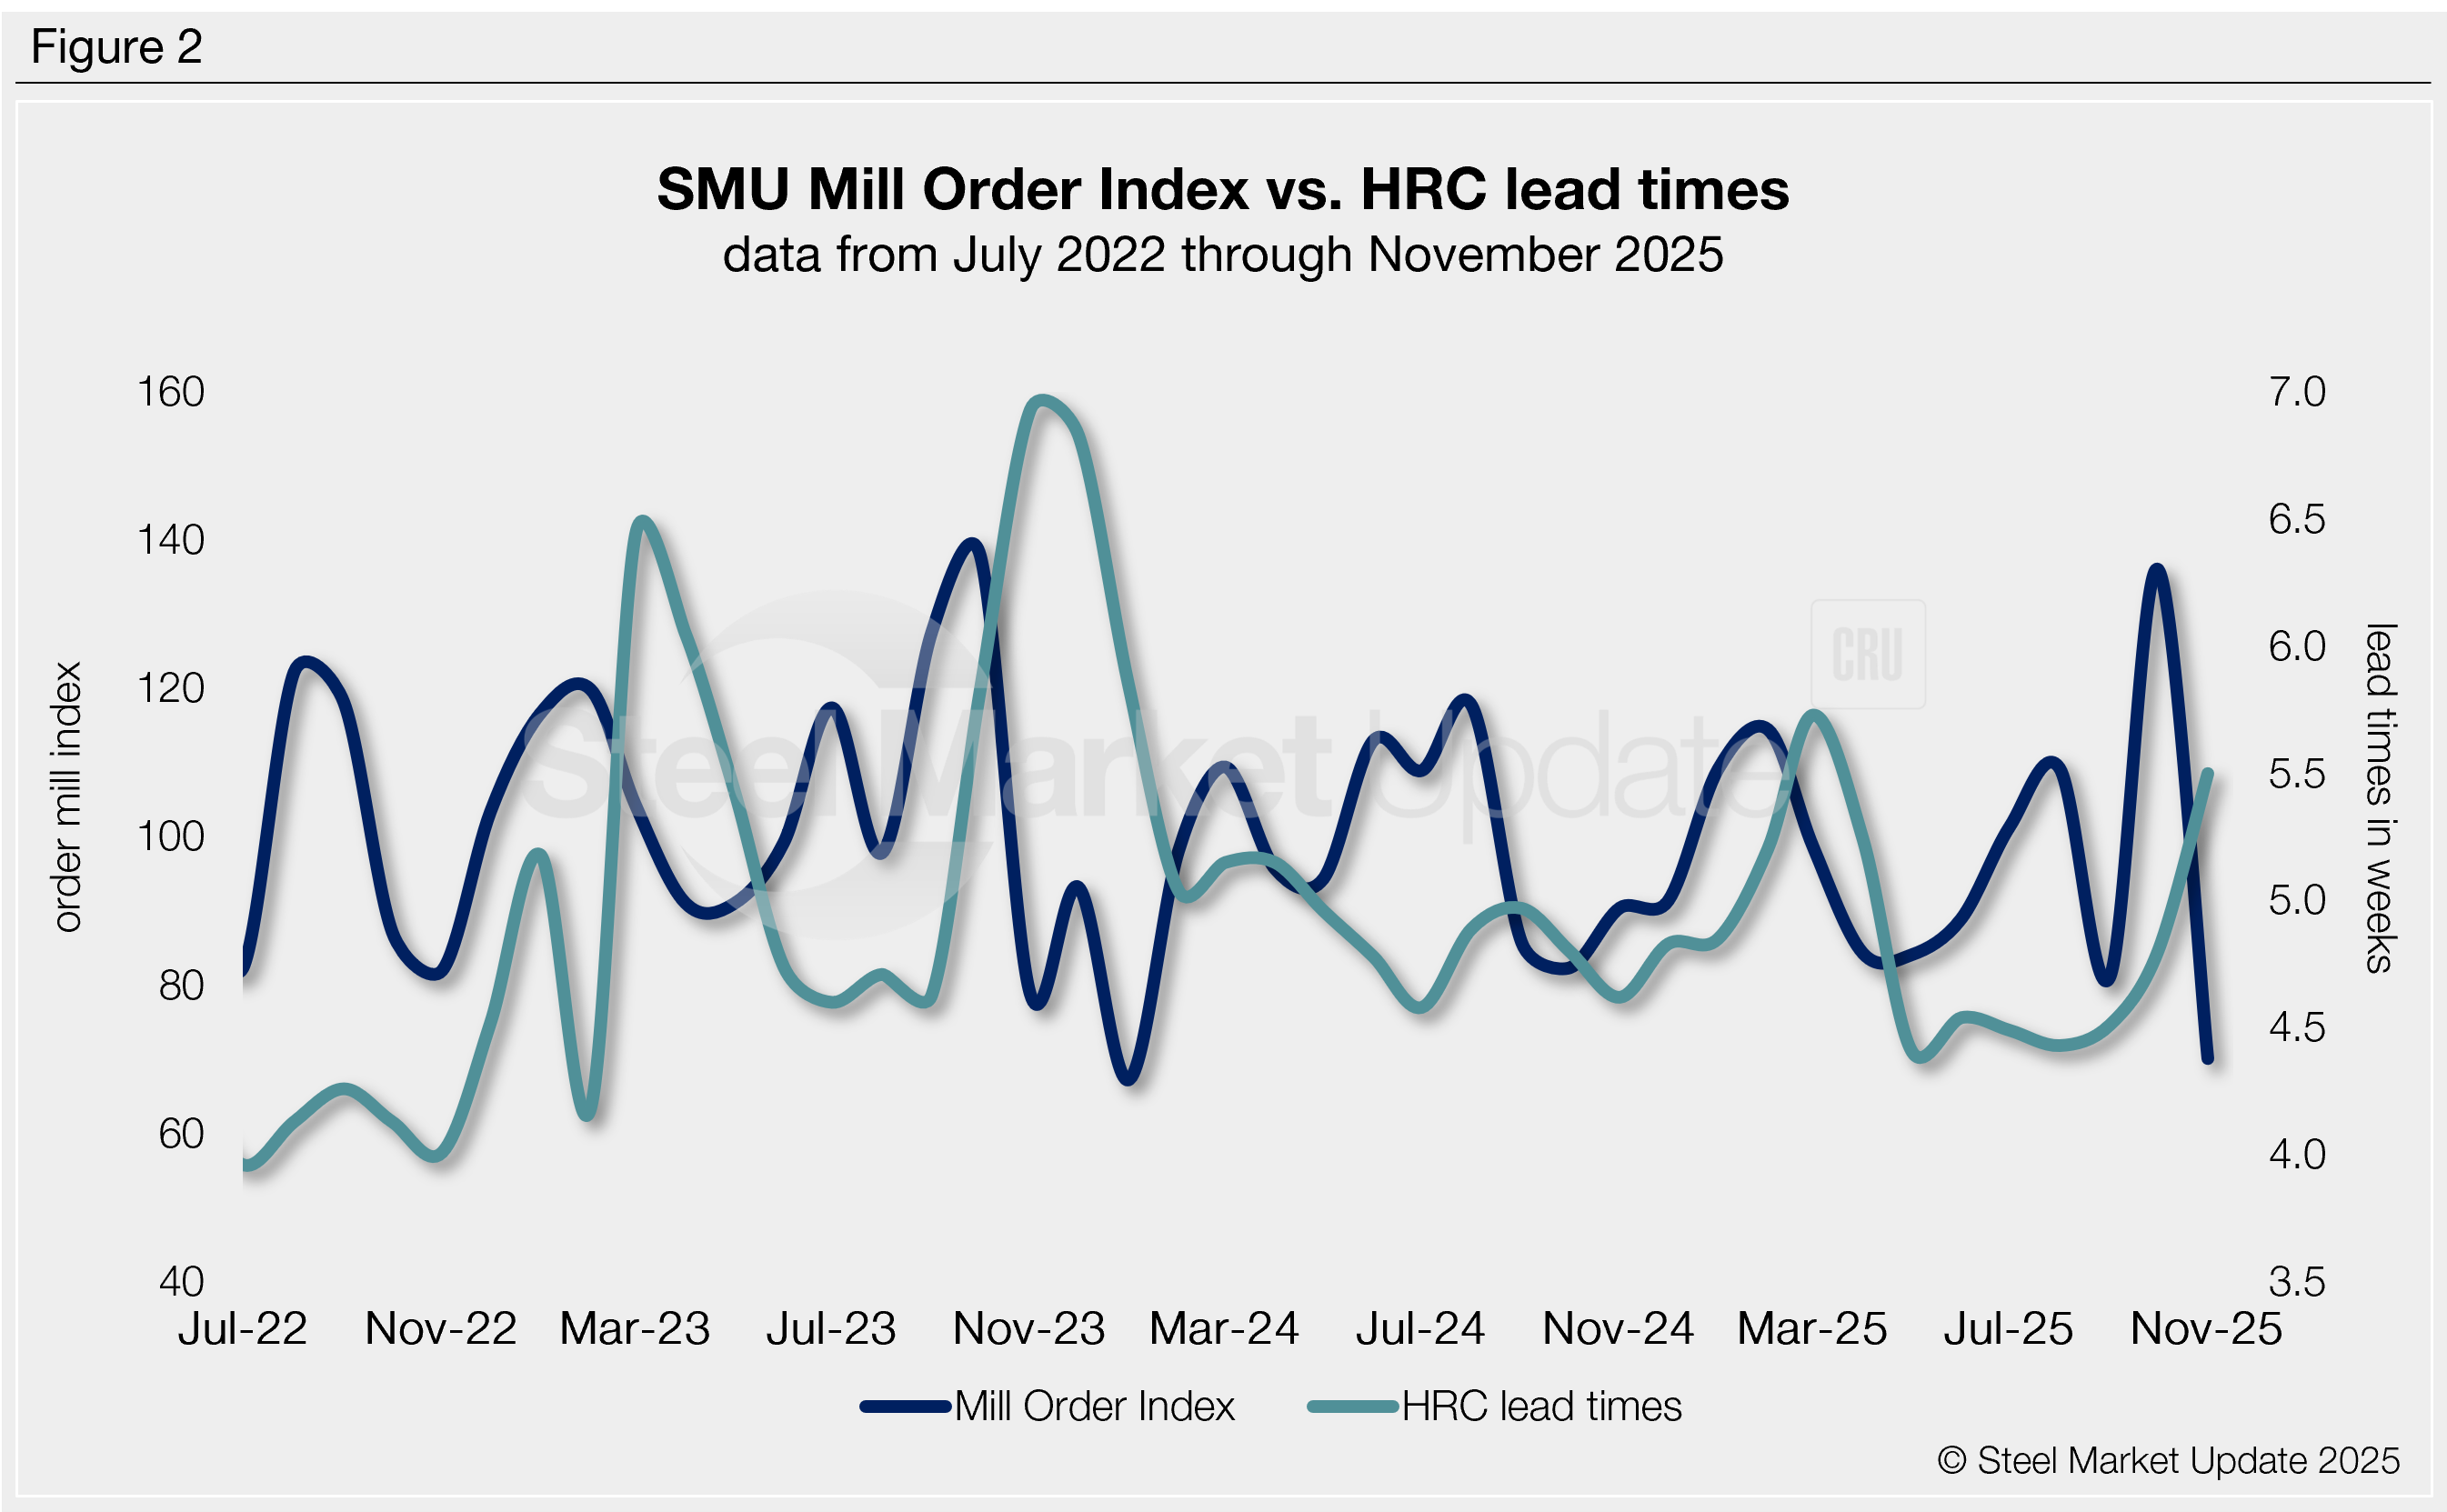
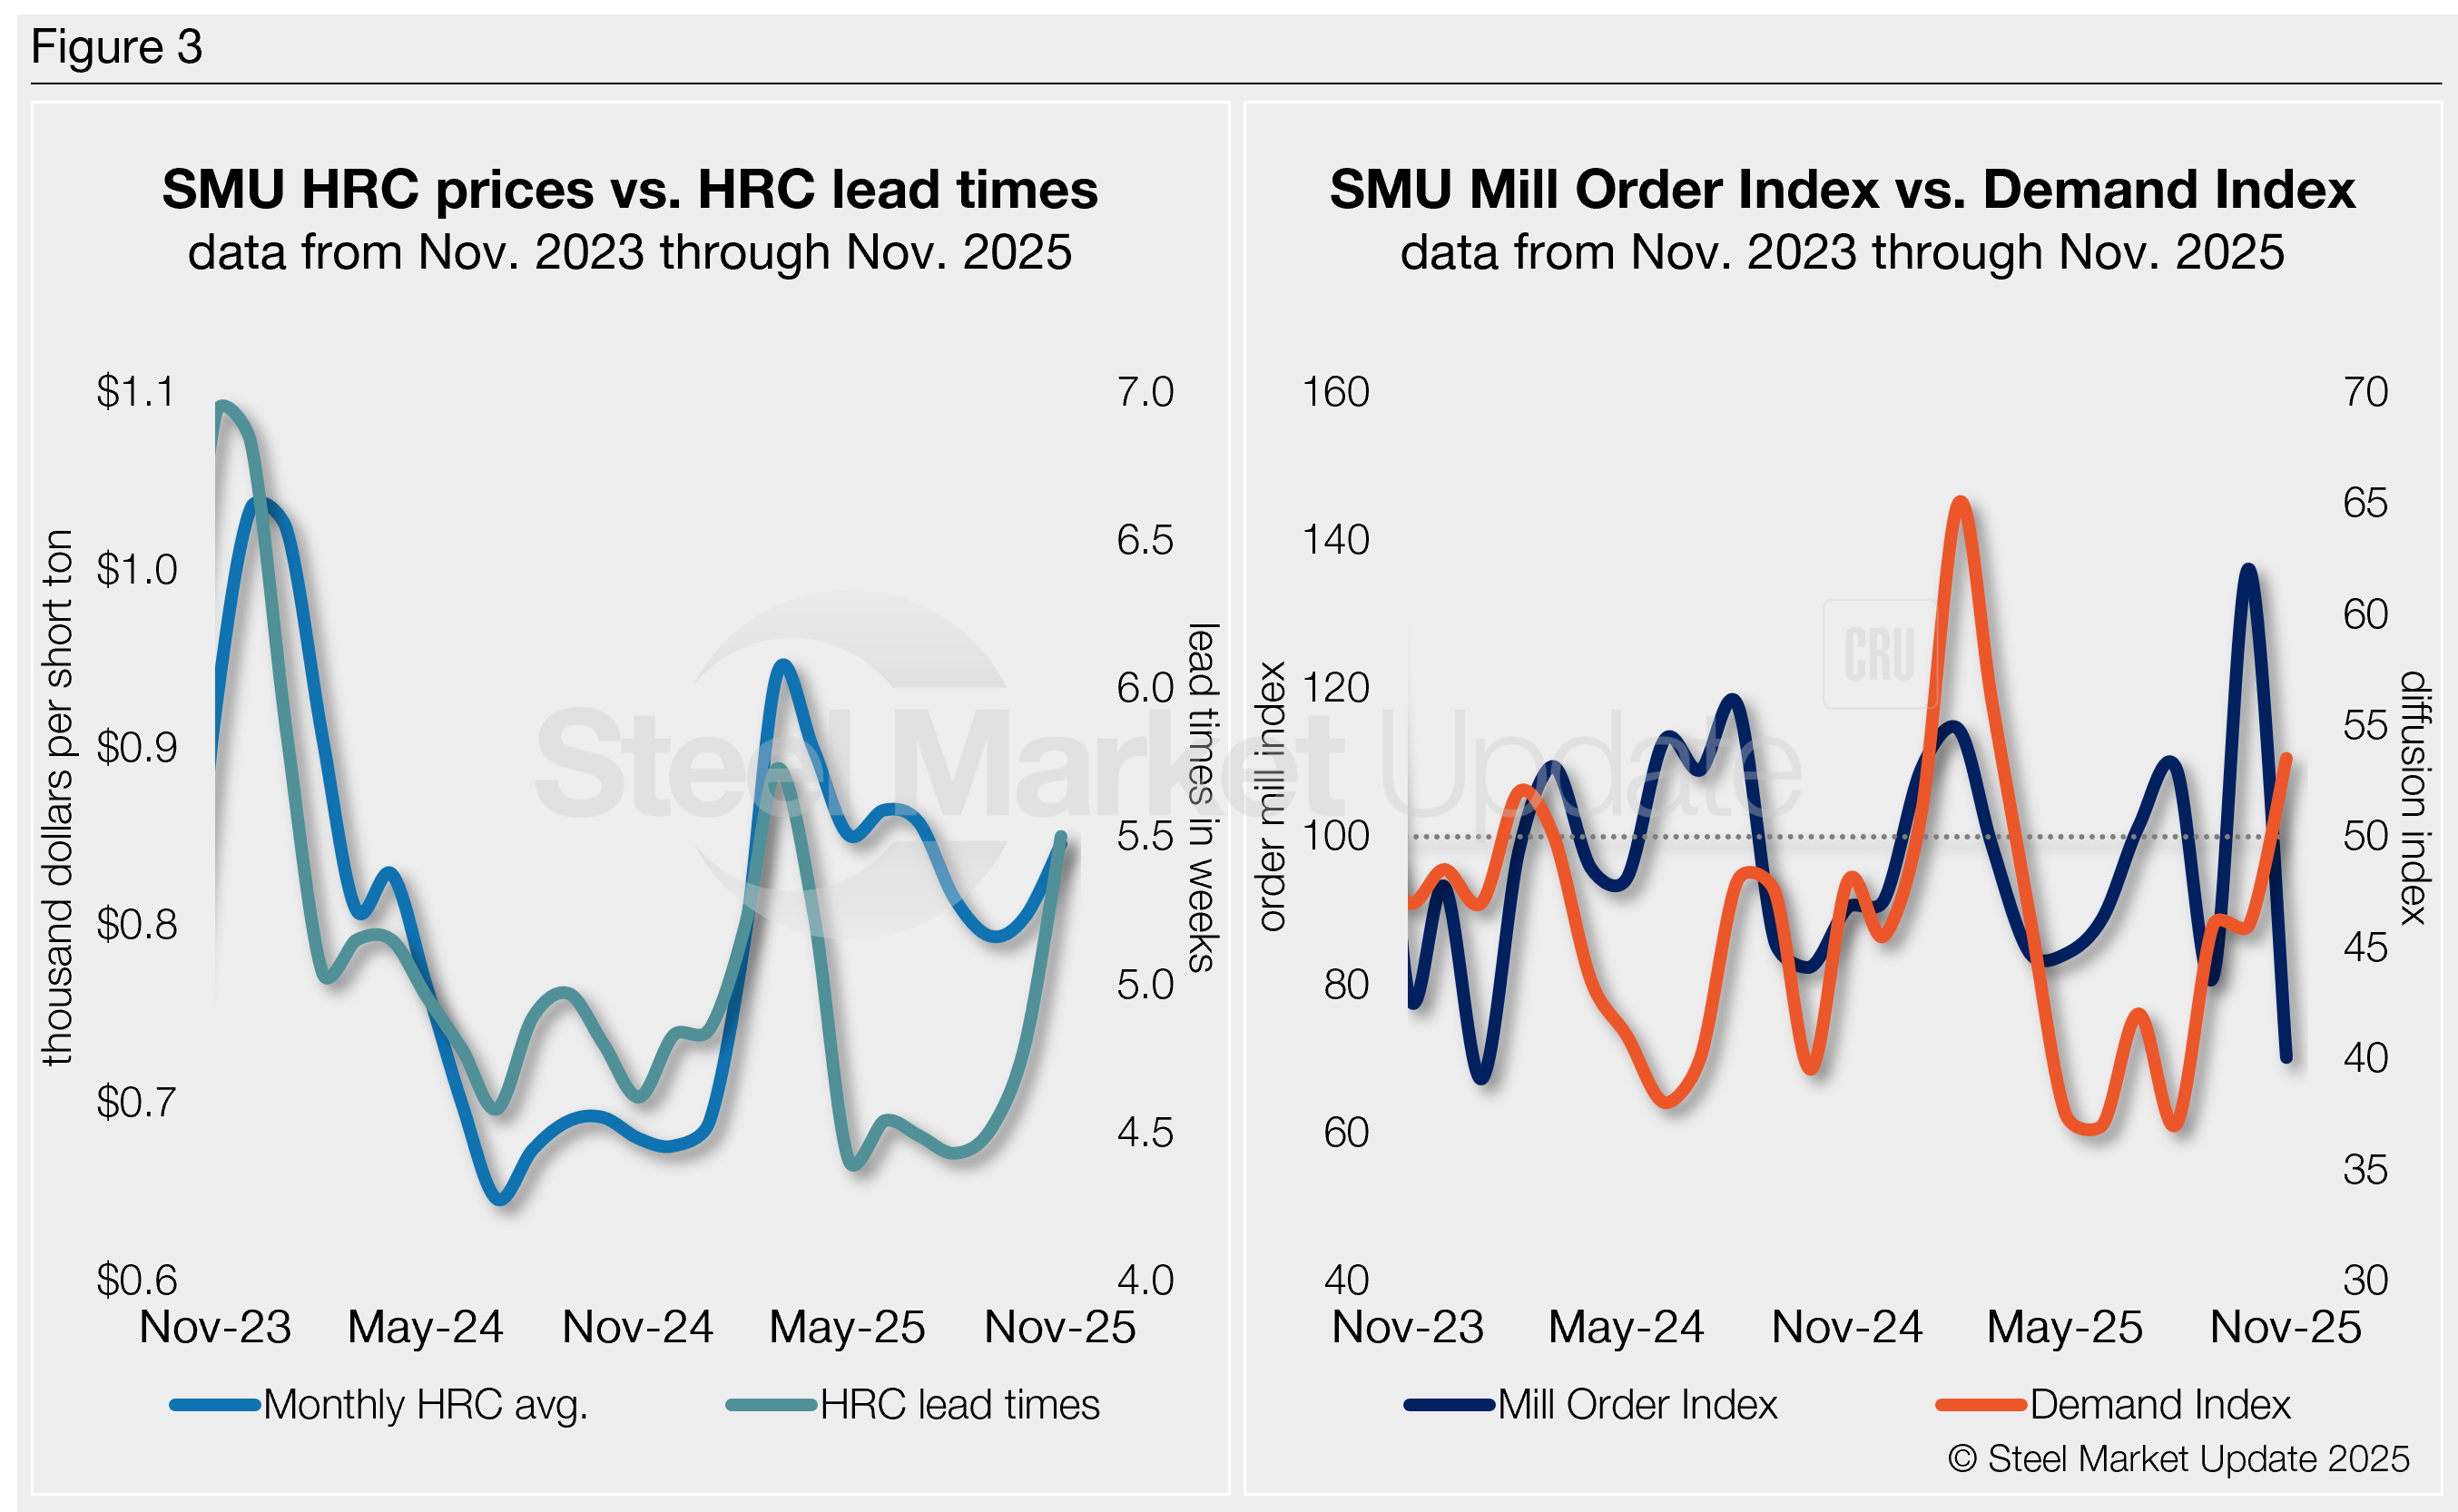
SMU’s MOI pairs well with — and has for the past five years proceeded — moves in mill lead times (Figure 2), though the latest results would indicate a divergence. And SMU’s lead times have also been a leading indicator of flat-rolled steel prices, particularly for HRC (see left-side chart in Figure 3).
Our MOI also pairs well with our Steel Demand Index (see right-side chart in Figure 3), which, for nearly a decade, has preceded moves in mill lead times. But, again, the latest data denotes a disagreement.
How it shakes out
Prices have been on the rise, now up $125 per short ton (st) since late September. And variable-based contracts still incentivize new orders at mills placed to close out the year. Tack on some opportunistic buying in October that coincided with maintenance outages, and price increases might have spilled over into December as a result.
But the downstream supply chain appears to be full — and some might say inventories appear well matched to demand in November and into the new year.
This is likely why the mill order index is trending down, rather sharply in November, even as lead times and our Demand Index are still pointing up.
Maintenance schedules tightened supply, but market dynamics were also helped by Canadian mills pulling out of the US market. All the while, overseas imports dried up, aided by 50% tariffs. This would typically be a recipe for a very sharp price escalation — think three-to-four times $125/st.
We haven’t seen that play out. And potentially that could be an indication that demand is indeed not as robust as some might believe.
We’ll be tracking any changes closely as we move through December and into 2026.