Market Data

January 13, 2026
Steel imports remain muted through December
Written by Brett Linton
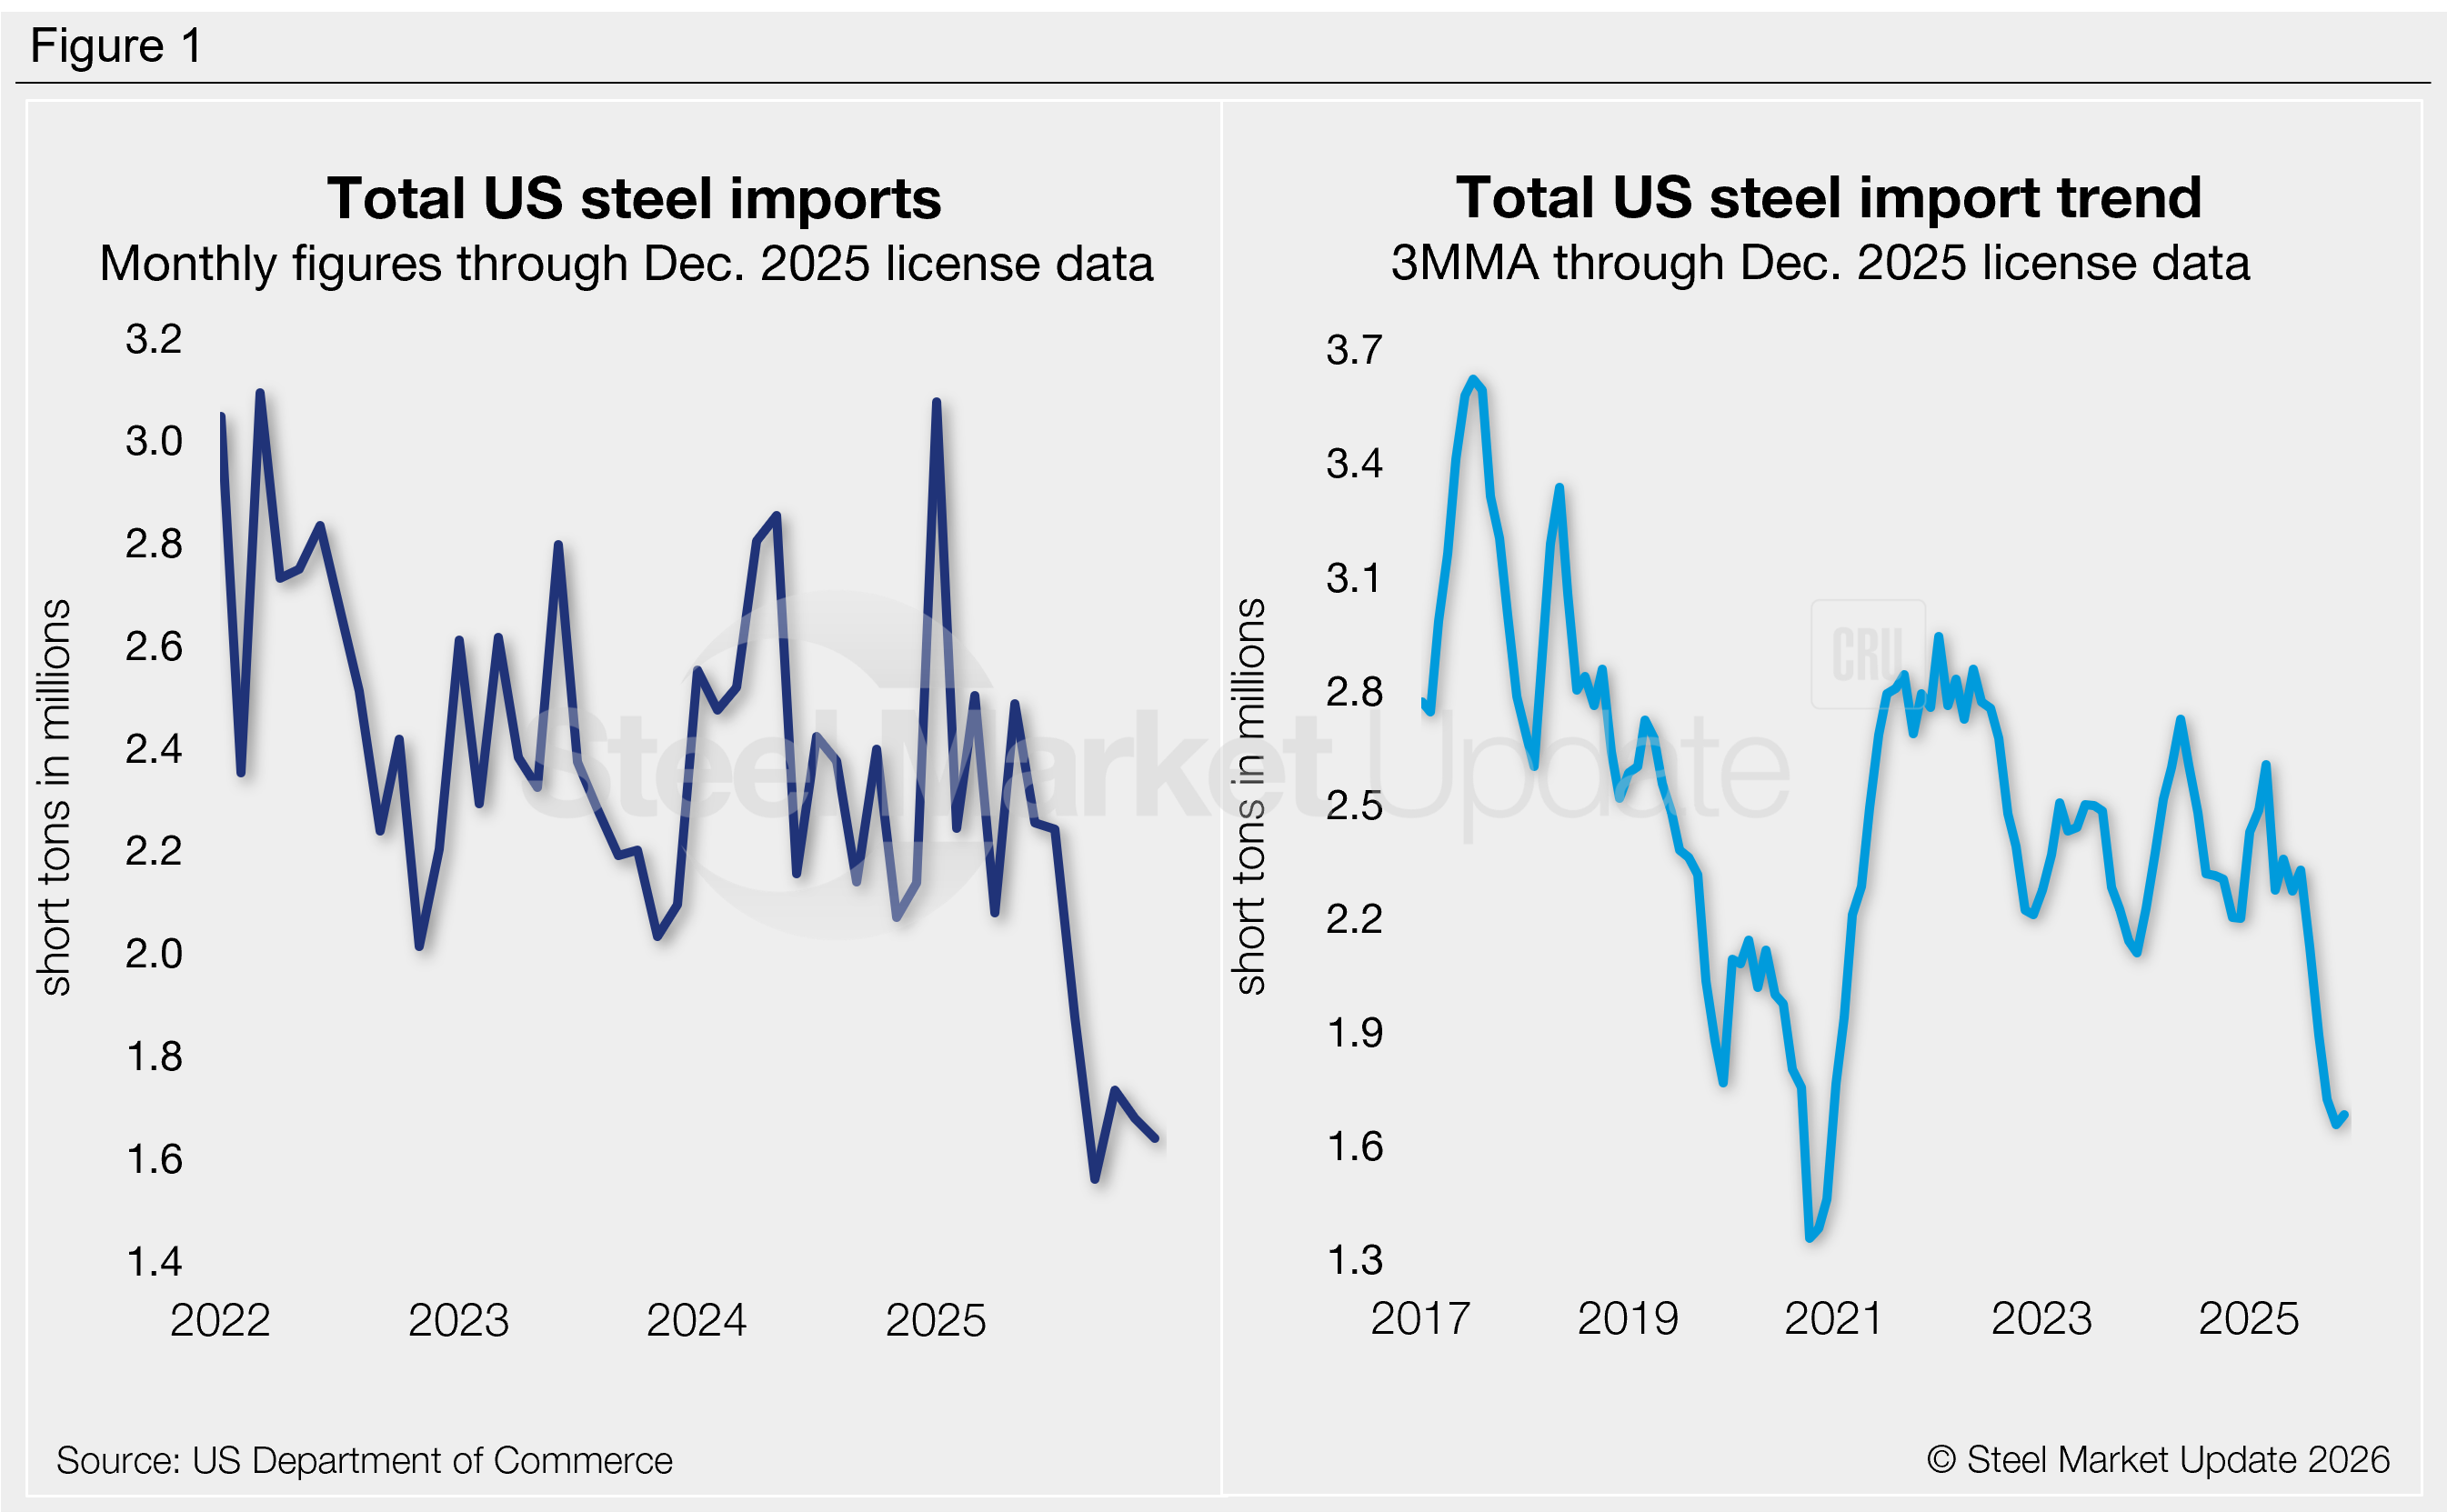
According to recently released final US Commerce Department data, US steel imports rebounded 11% month on month (m/m) in October 2025 after falling to a multi-year low one month earlier. The latest license figures suggest imports eased back by 3% in November and by another 2% in December, with trade again nearing historical lows.
The total volume of steel products that entered the country in October was 1.73 million short tons (st). This comes just one month after total imports fell to 1.56 million mt, the lowest rate witnessed since December 2020. The latest license data shows 1.68 million st of material was imported in November and 1.64 million st in December, potentially the second and third-lowest monthly totals recorded since 2020.
Recall that imports spiked to a two-and-a-half-year high of 3.08 million st in January. Trade balanced out for the remaining first half of the year, then significantly slowed after July (Figure 1, left).
Shifting trade
Two-thirds of the steel that entered the country in October came from just seven countries: Canada (18%), Brazil (17%), Mexico (11%), South Korea (9%), Taiwan (6%), Vietnam (6%), and Japan (6%). Other major suppliers included Turkey, Germany, the Netherlands, the United Arab Emirates, India, Greece, China, and Indonesia, each contributing 2-4% of the total. Combined, these 15 countries accounted for 89% of all October imports.
Compared to the same month of the previous year, we see noticeable shifts in the export volumes from Canada and Mexico:
- In October 2024, Canada exported 545,000 st of steel to the US. This amount shrank by 233,000 st, or 43% year over year (y/y), to 312,000 st in October 2025. In the fourth quarter of 2024, Canada supplied 23% of total US imports. In the same quarter of 2025, that rate was down to 15%.
- Mexico also saw a substantial annual shift, with trade easing from 361,000 st one year earlier to 155,000 st this October, down 206,000 st or 57% y/y. Mexico accounted for 16% of US imports in the fourth quarter of 2024. That rate declined to 10% in the final quarter of 2025.
To explore steel import data by country, category, or specific product, visit the International Trade Administration’s Steel Import Monitor.
Import trends
To better highlight trends, import data can be analyzed as a three-month moving average (3MMA) to smooth out monthly variations (Figure 1, right). On this basis, 3MMA imports trended lower across most of 2025 following March’s 10-month high of 2.61 million st. The 3MMA fell to 1.72 million st in October, the lowest rate since December 2020. The 3MMA is down even further through license data, currently at 1.66 million st through November and 1.68 million st through December.
For comparison, the average monthly import rate of 2025 is set to average 2.15 million st (including November and December license data). This is down 11% from the 2024 average rate of 2.41 million st per month and down 9% from the 2023 rate of 2.36 million st per month.
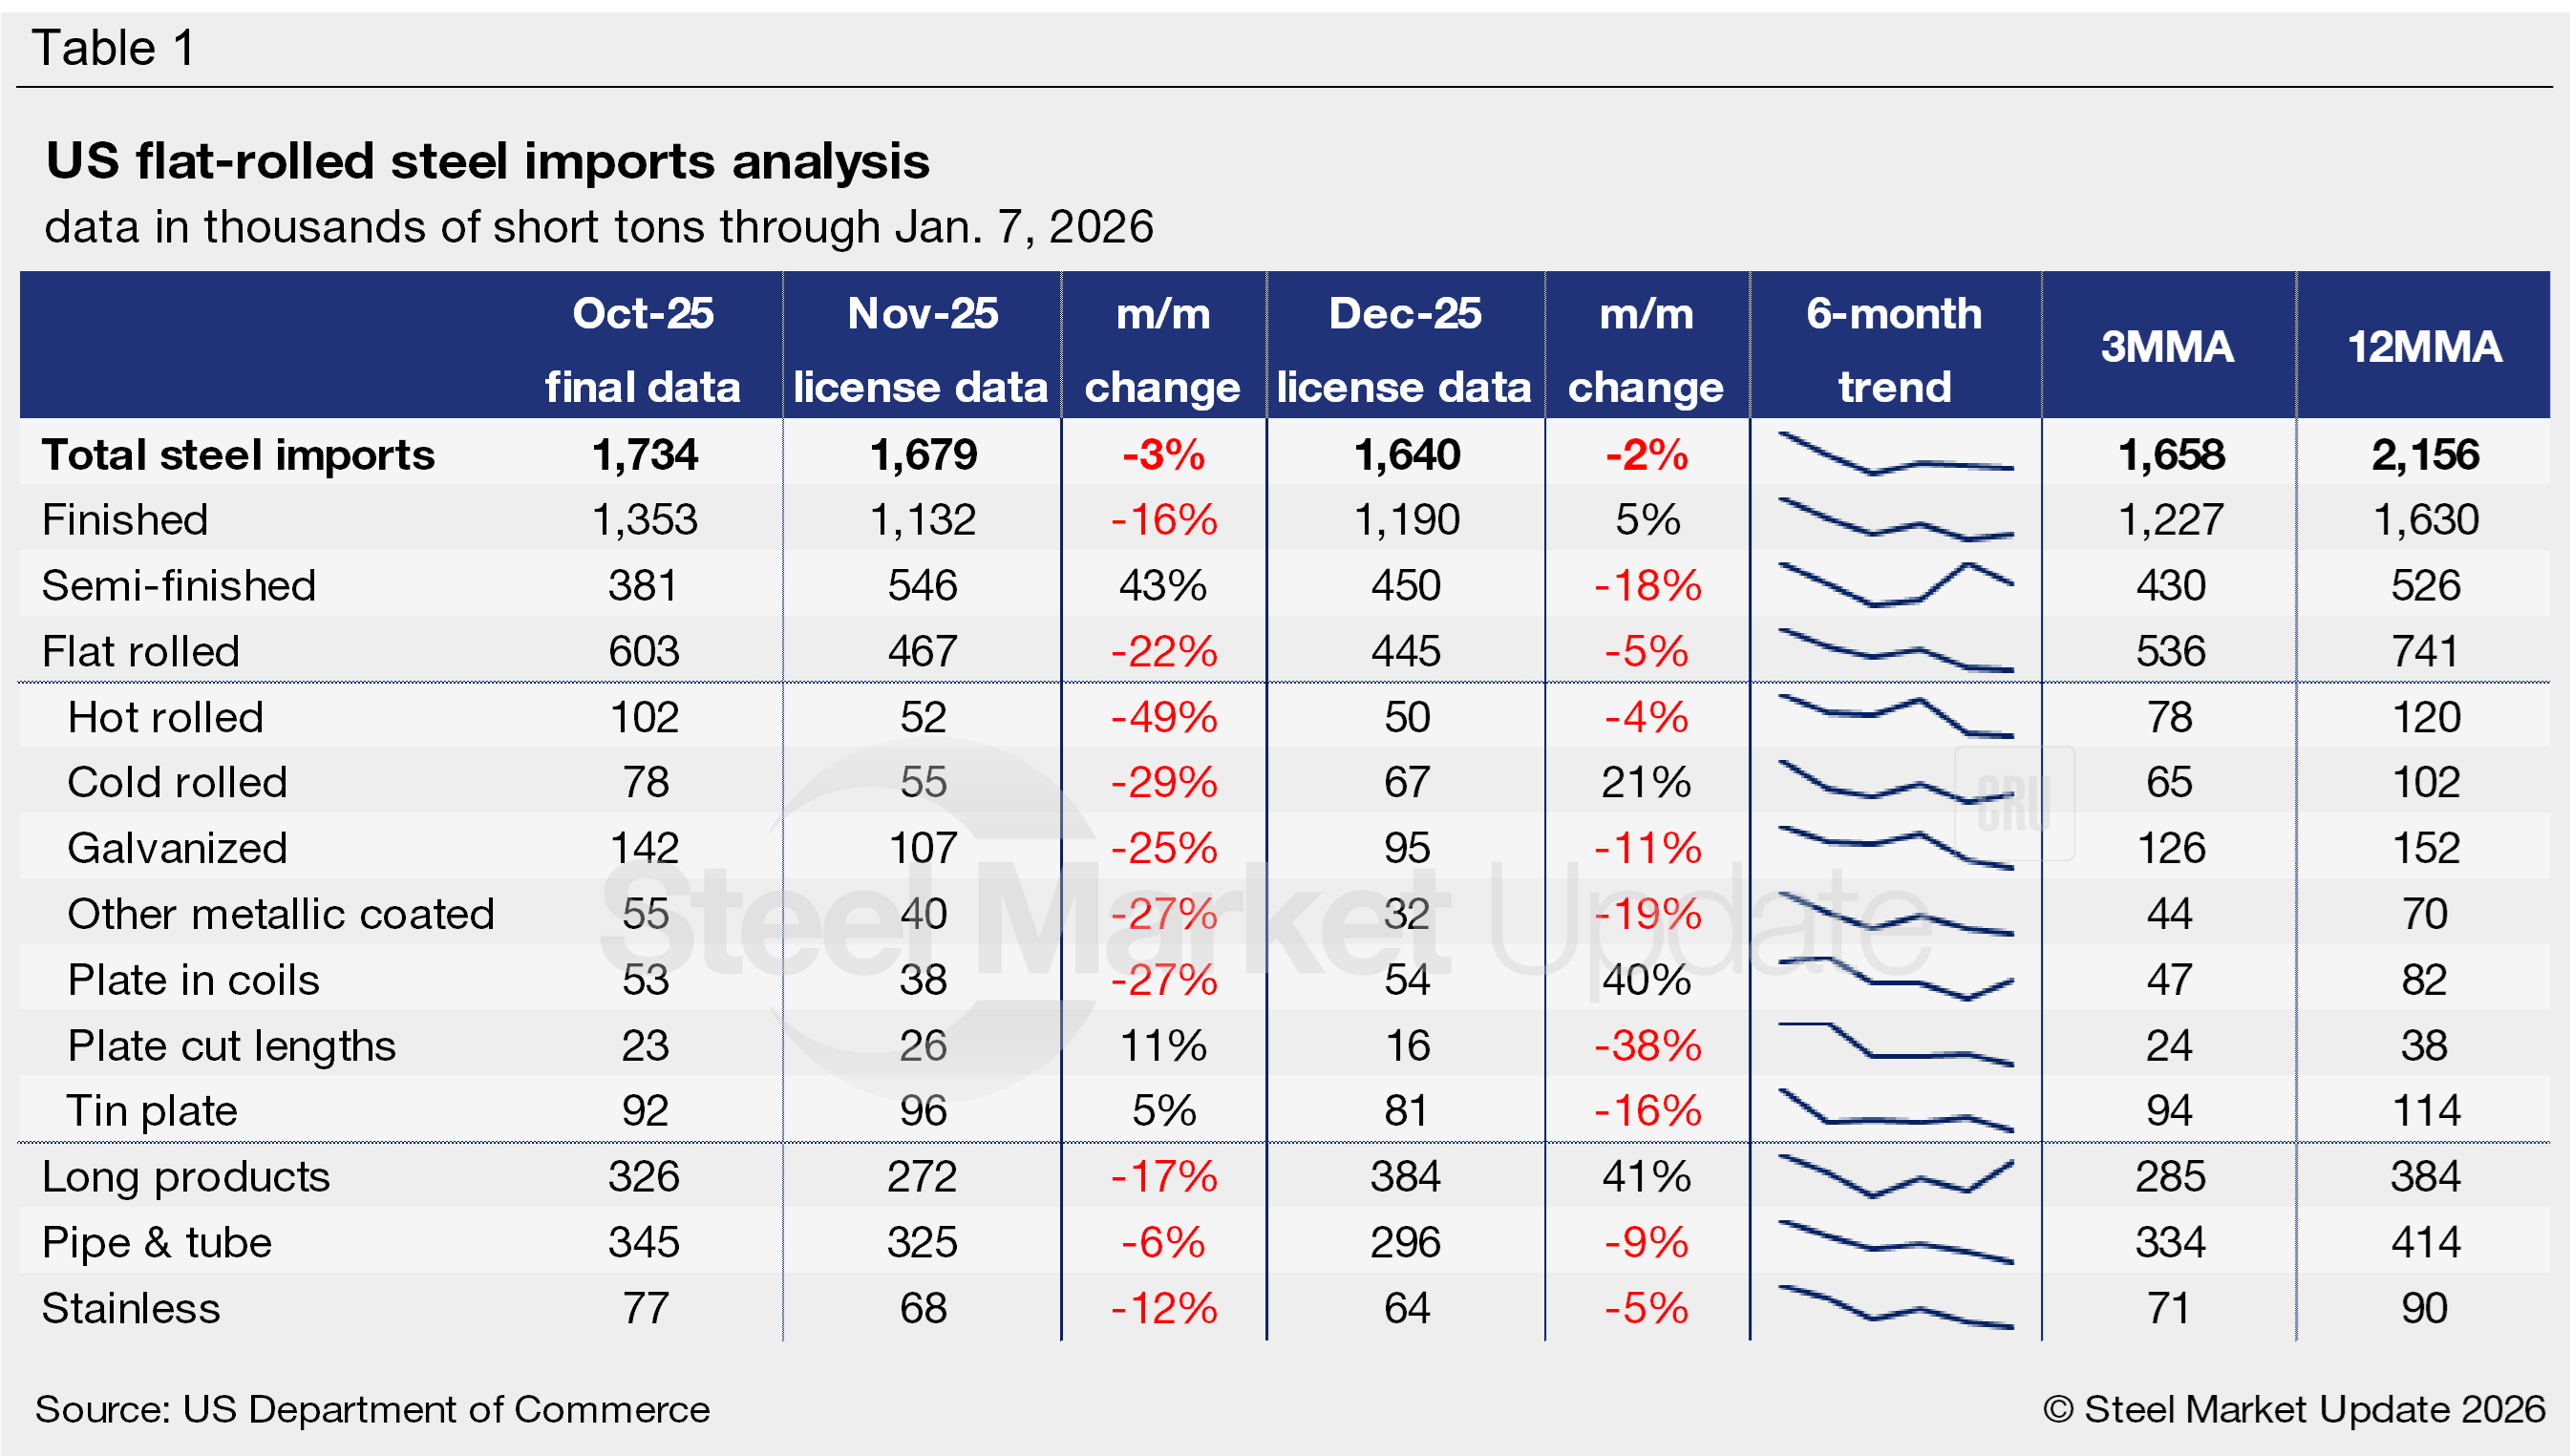
Imports by product
Table 1 highlights high-volume steel product imports (click to expand). Note the 3MMA and 12MMA columns are calculated through November license data. For deeper analysis, visit our Steel Imports page.
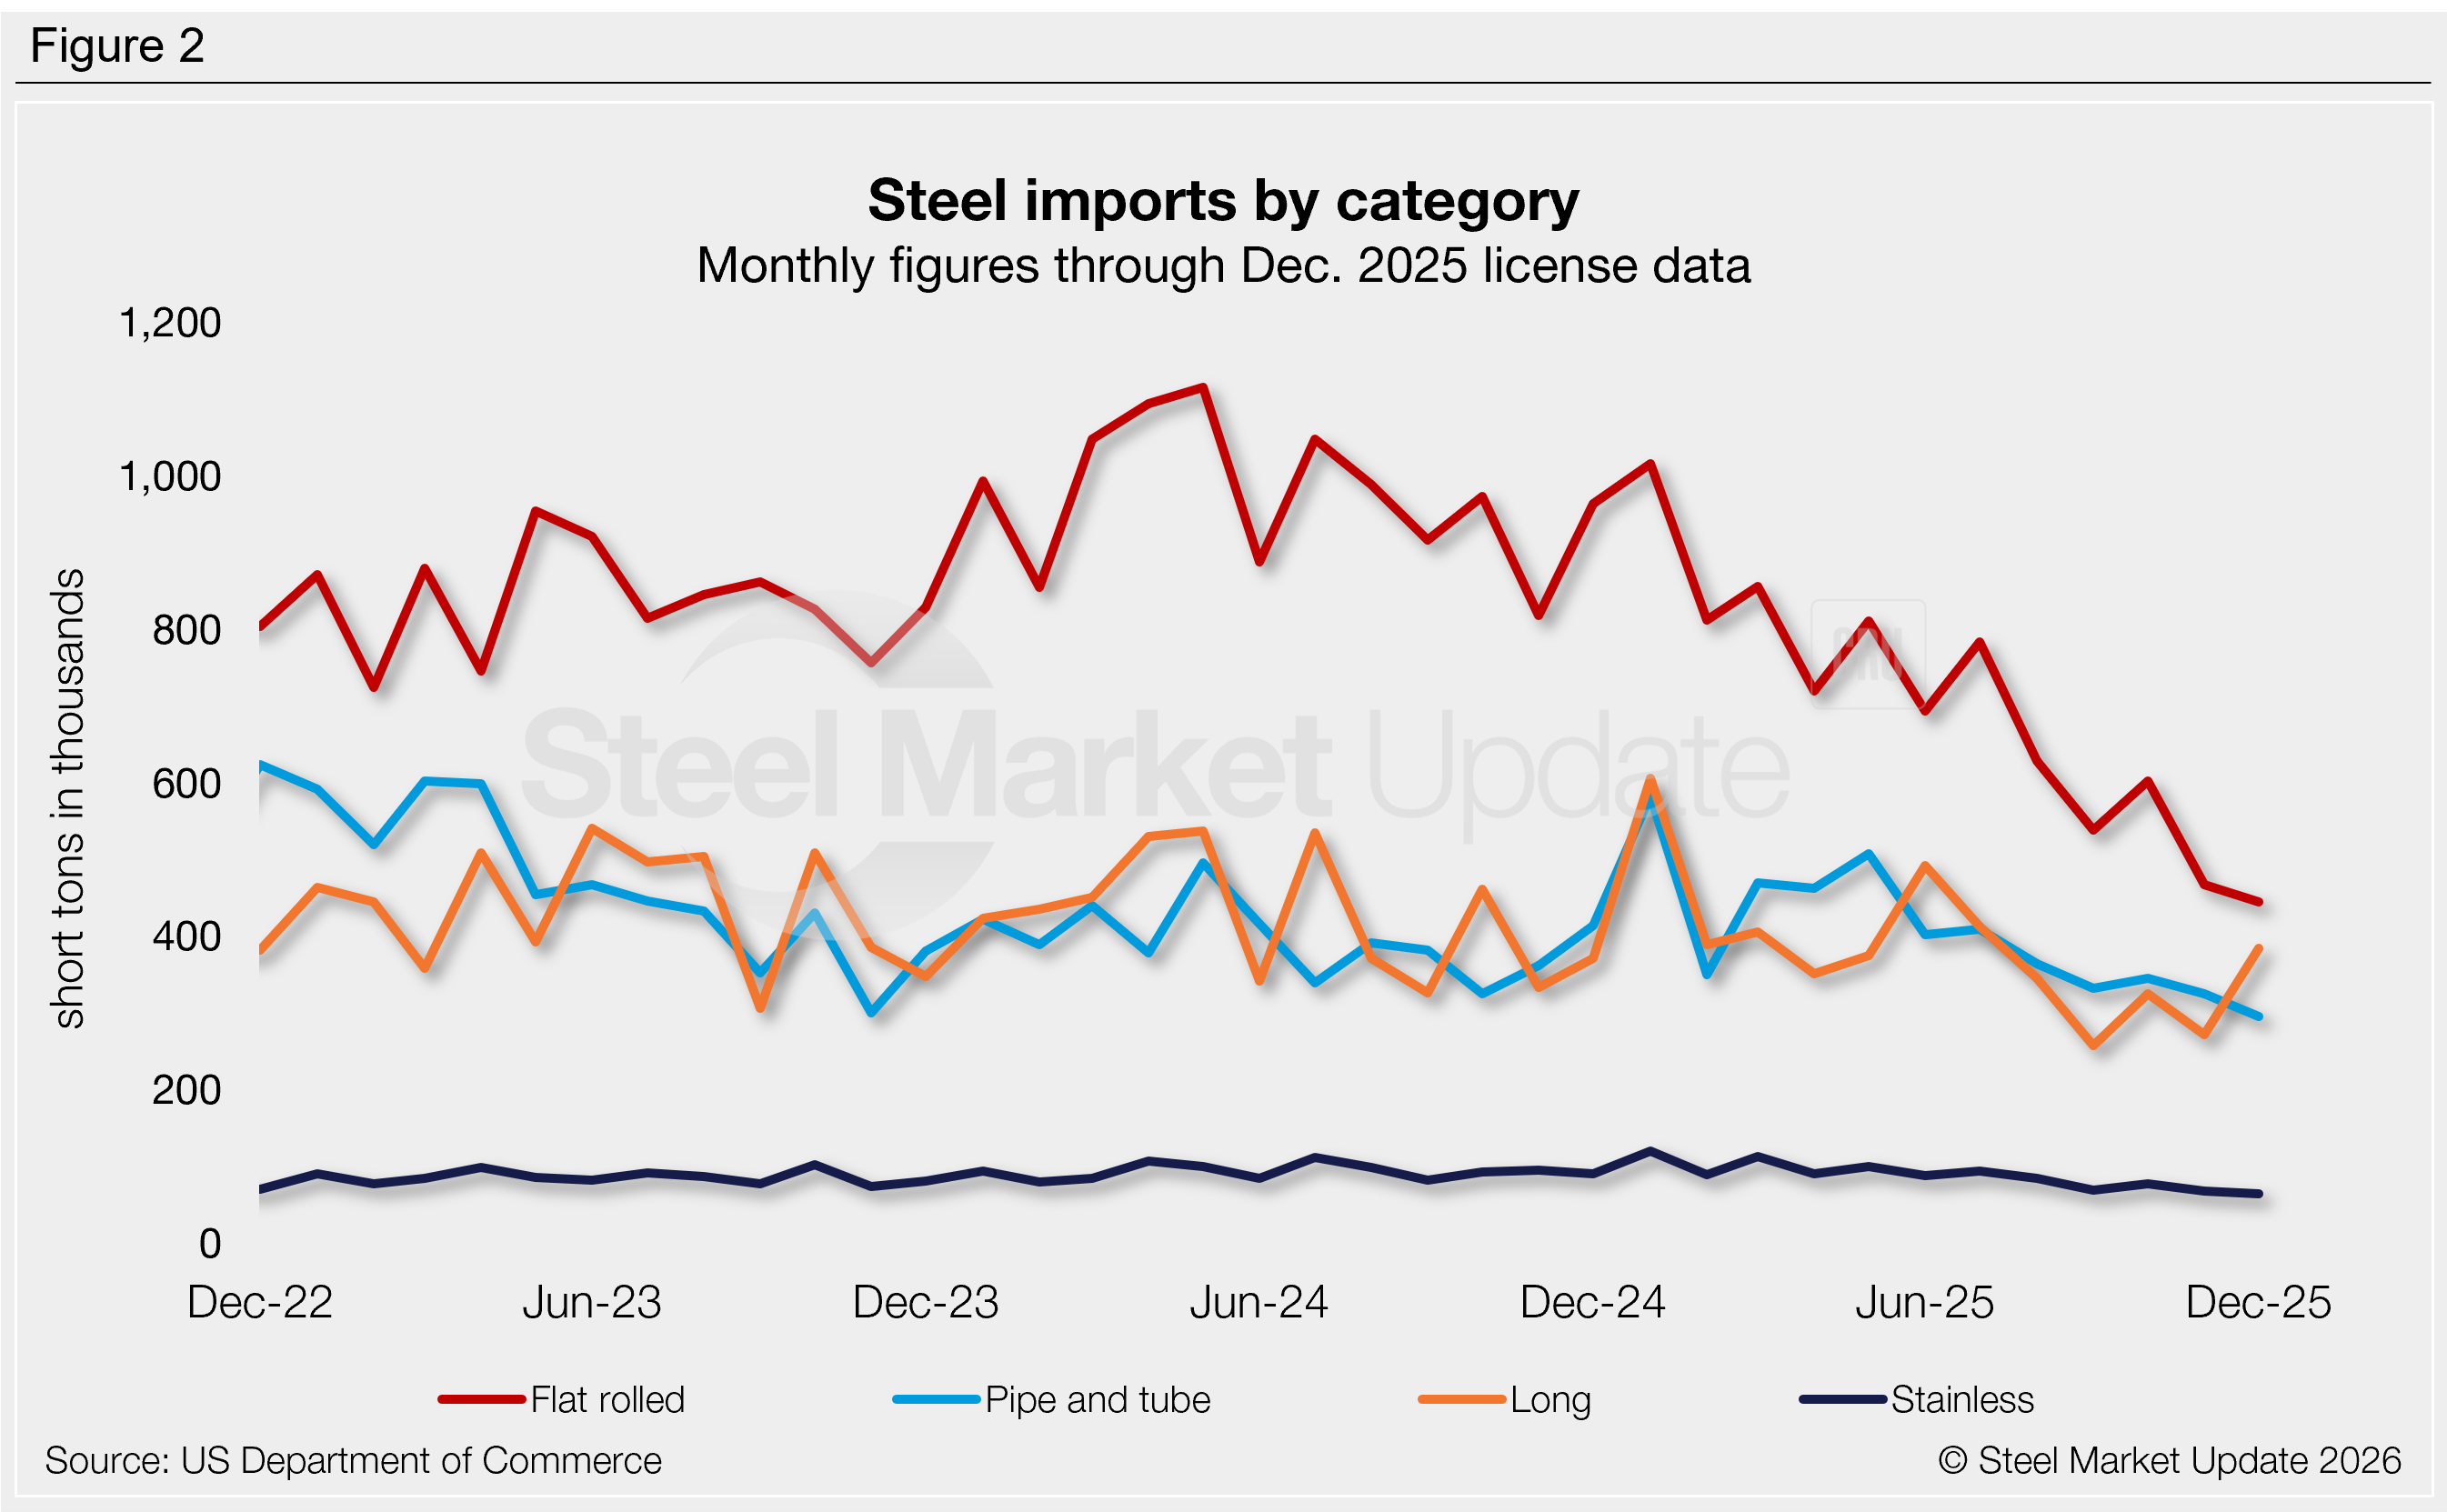
Imports by category
Figure 2 shows monthly imports by popular steel product categories. Notable shifts in the final months of 2025 include:
- Flat-rolled imports rebounded 12% in October to 603,000 st following September’s multi-year low. November licenses are down to 467,000 st and December is down even further to 445,000 st, potentially two of the lowest rates seen in our seven-year data history.
- Long product imports jumped 27% m/m in October to 326,000 st, surging from September’s five-year low of 257,000 st. License data shows more fluctuations, with November trade back down to 272,000 st then rebounding in December to 384,000 st.
- Pipe and tube imports increased 4% m/m in October to 345,000, just 13,000 st above September’s 11-month low. Trade slipped to 325,000 st in November and 296,000 st in December, lows not seen since early 2021.
- Stainless imports increased 12% from September’s four-year low of 69,000 st, rising to 77,000 st in October. Licenses are back down for November and December, down to 64,000 st in the final month of the year, a potential four-year low.
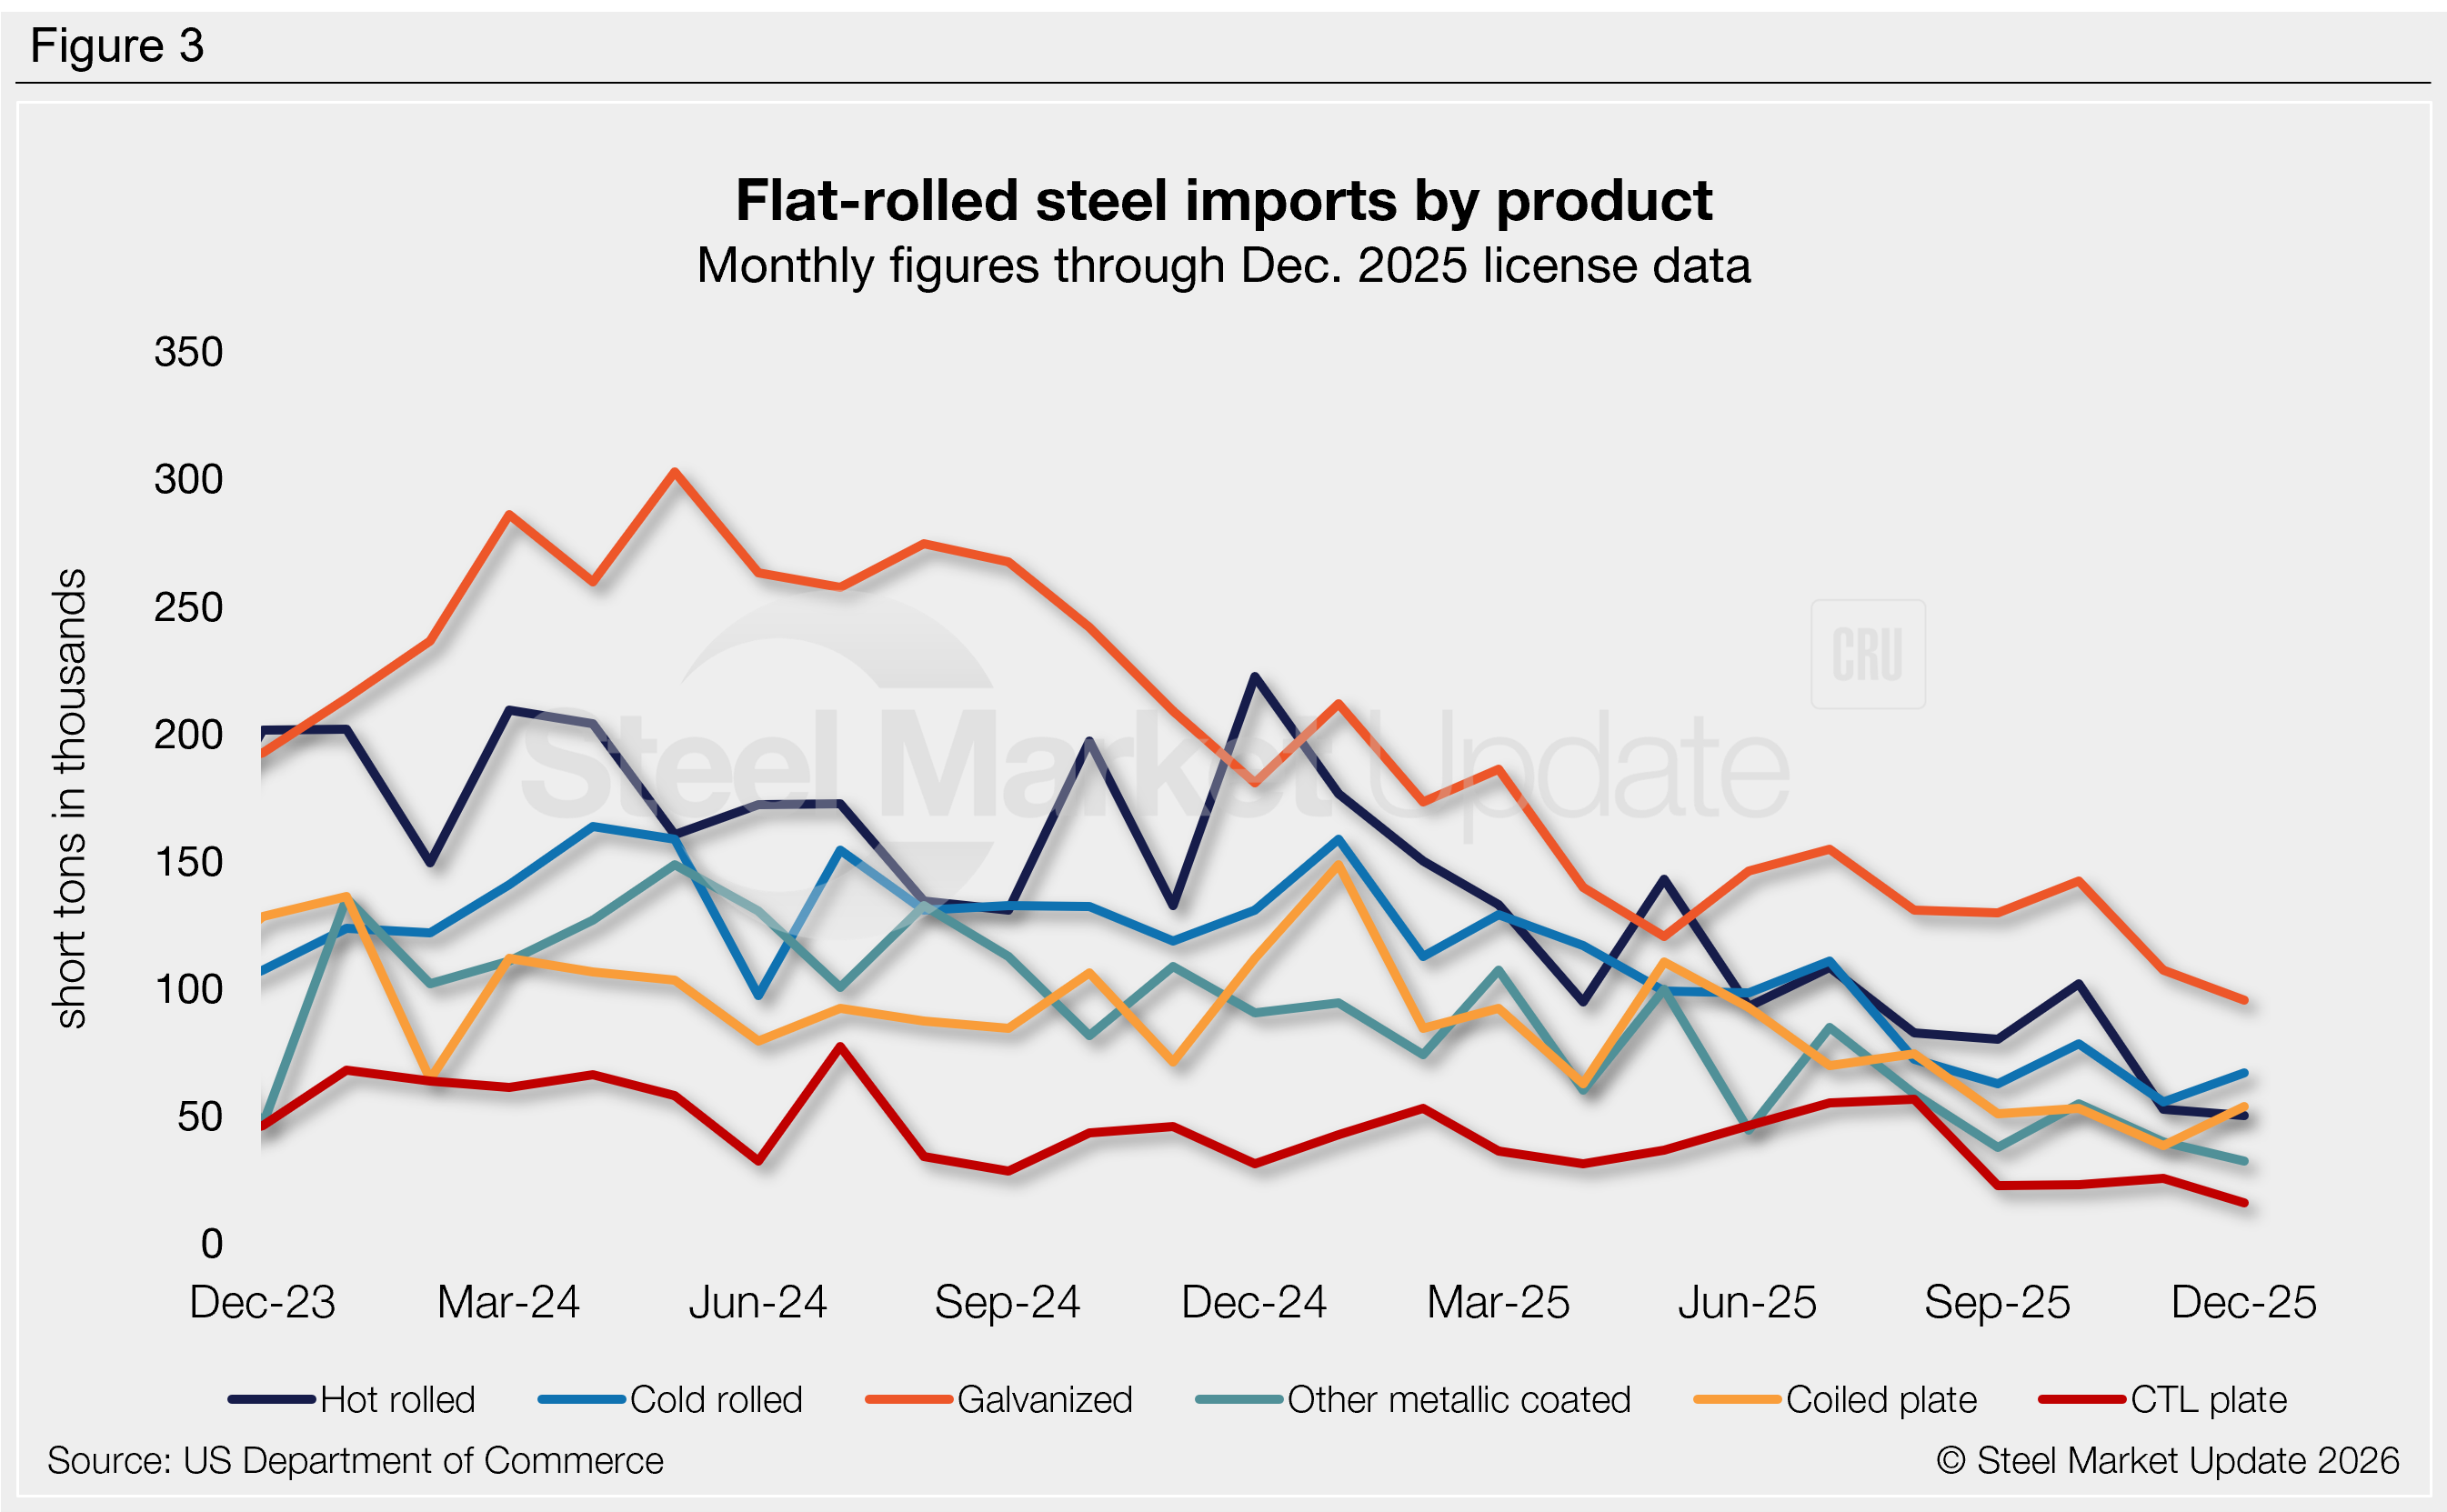
Flat-rolled imports
Figure 3 tracks flat-rolled imports for six popular sheet products. Most products declined from September to October(aside from hot-rolled coil, galvanized, and tin plate), with many falling to multi-year lows. Movement was mixed through November. Key highlights:
- Hot-rolled coil imports rebounded 27% m/m in October to 102,000 st, previously at the lowest rate seen in our 28-year data history. Imports receded through November and December, reaching a new record low of 50,000 st of licenses in December.
- Cold-rolled coil jumped 25% m/m in October to 78,000 st, recovering from a near five-year low. License data suggests trade fell back to 55,000 st in November (potentially the lowest rate in over 16 years), then recovered to 67,000 st in December.
- Galvanized sheet increased 10% m/m in October to 142,000 st, one of the higher rates seen across the prior six months. November and December trade figures are back down, with December licenses currently totaling 95,000 st, potentially the lowest monthly rate seen since 2011.
- Other-metallic coated (mostly Galvalume) rebounded 45% in October to 55,000 st, recovering from a near six-year low the month before. November licenses are back down 27% and down another 19% in December to 32,000 st, one of the lowest rates on record since 2019.
- Coiled plate rose 4% m/m in October to 53,000 st following September’s near-five-year low. Imports declined 27% in November to 38,000 st, a low not seen since 2009. December licenses are back up to 54,000 st.
- Cut-to-length (CTL) plate recovered 2% m/m in October to 23,000 st following the near five-year low seen one month prior. November licenses are up 11% to 26,000 st, but December data is back down to 16,000 st, the lowest rate recorded in our 27-year data history.