Canada
February 3, 2026
Steel imports declined to historic lows in November and December
Written by Brett Linton
Following the rebound seen from September to October, steel imports fell back down in November, according to recently released final US Commerce Department data. The latest license figures suggest imports held relatively steady through December but declined further in January, possibly surpassing the near-five-year low rate set last September.
Trade is down in November and December across most import categories, and many of the sheet and plate products we follow slipped to multi-year lows.
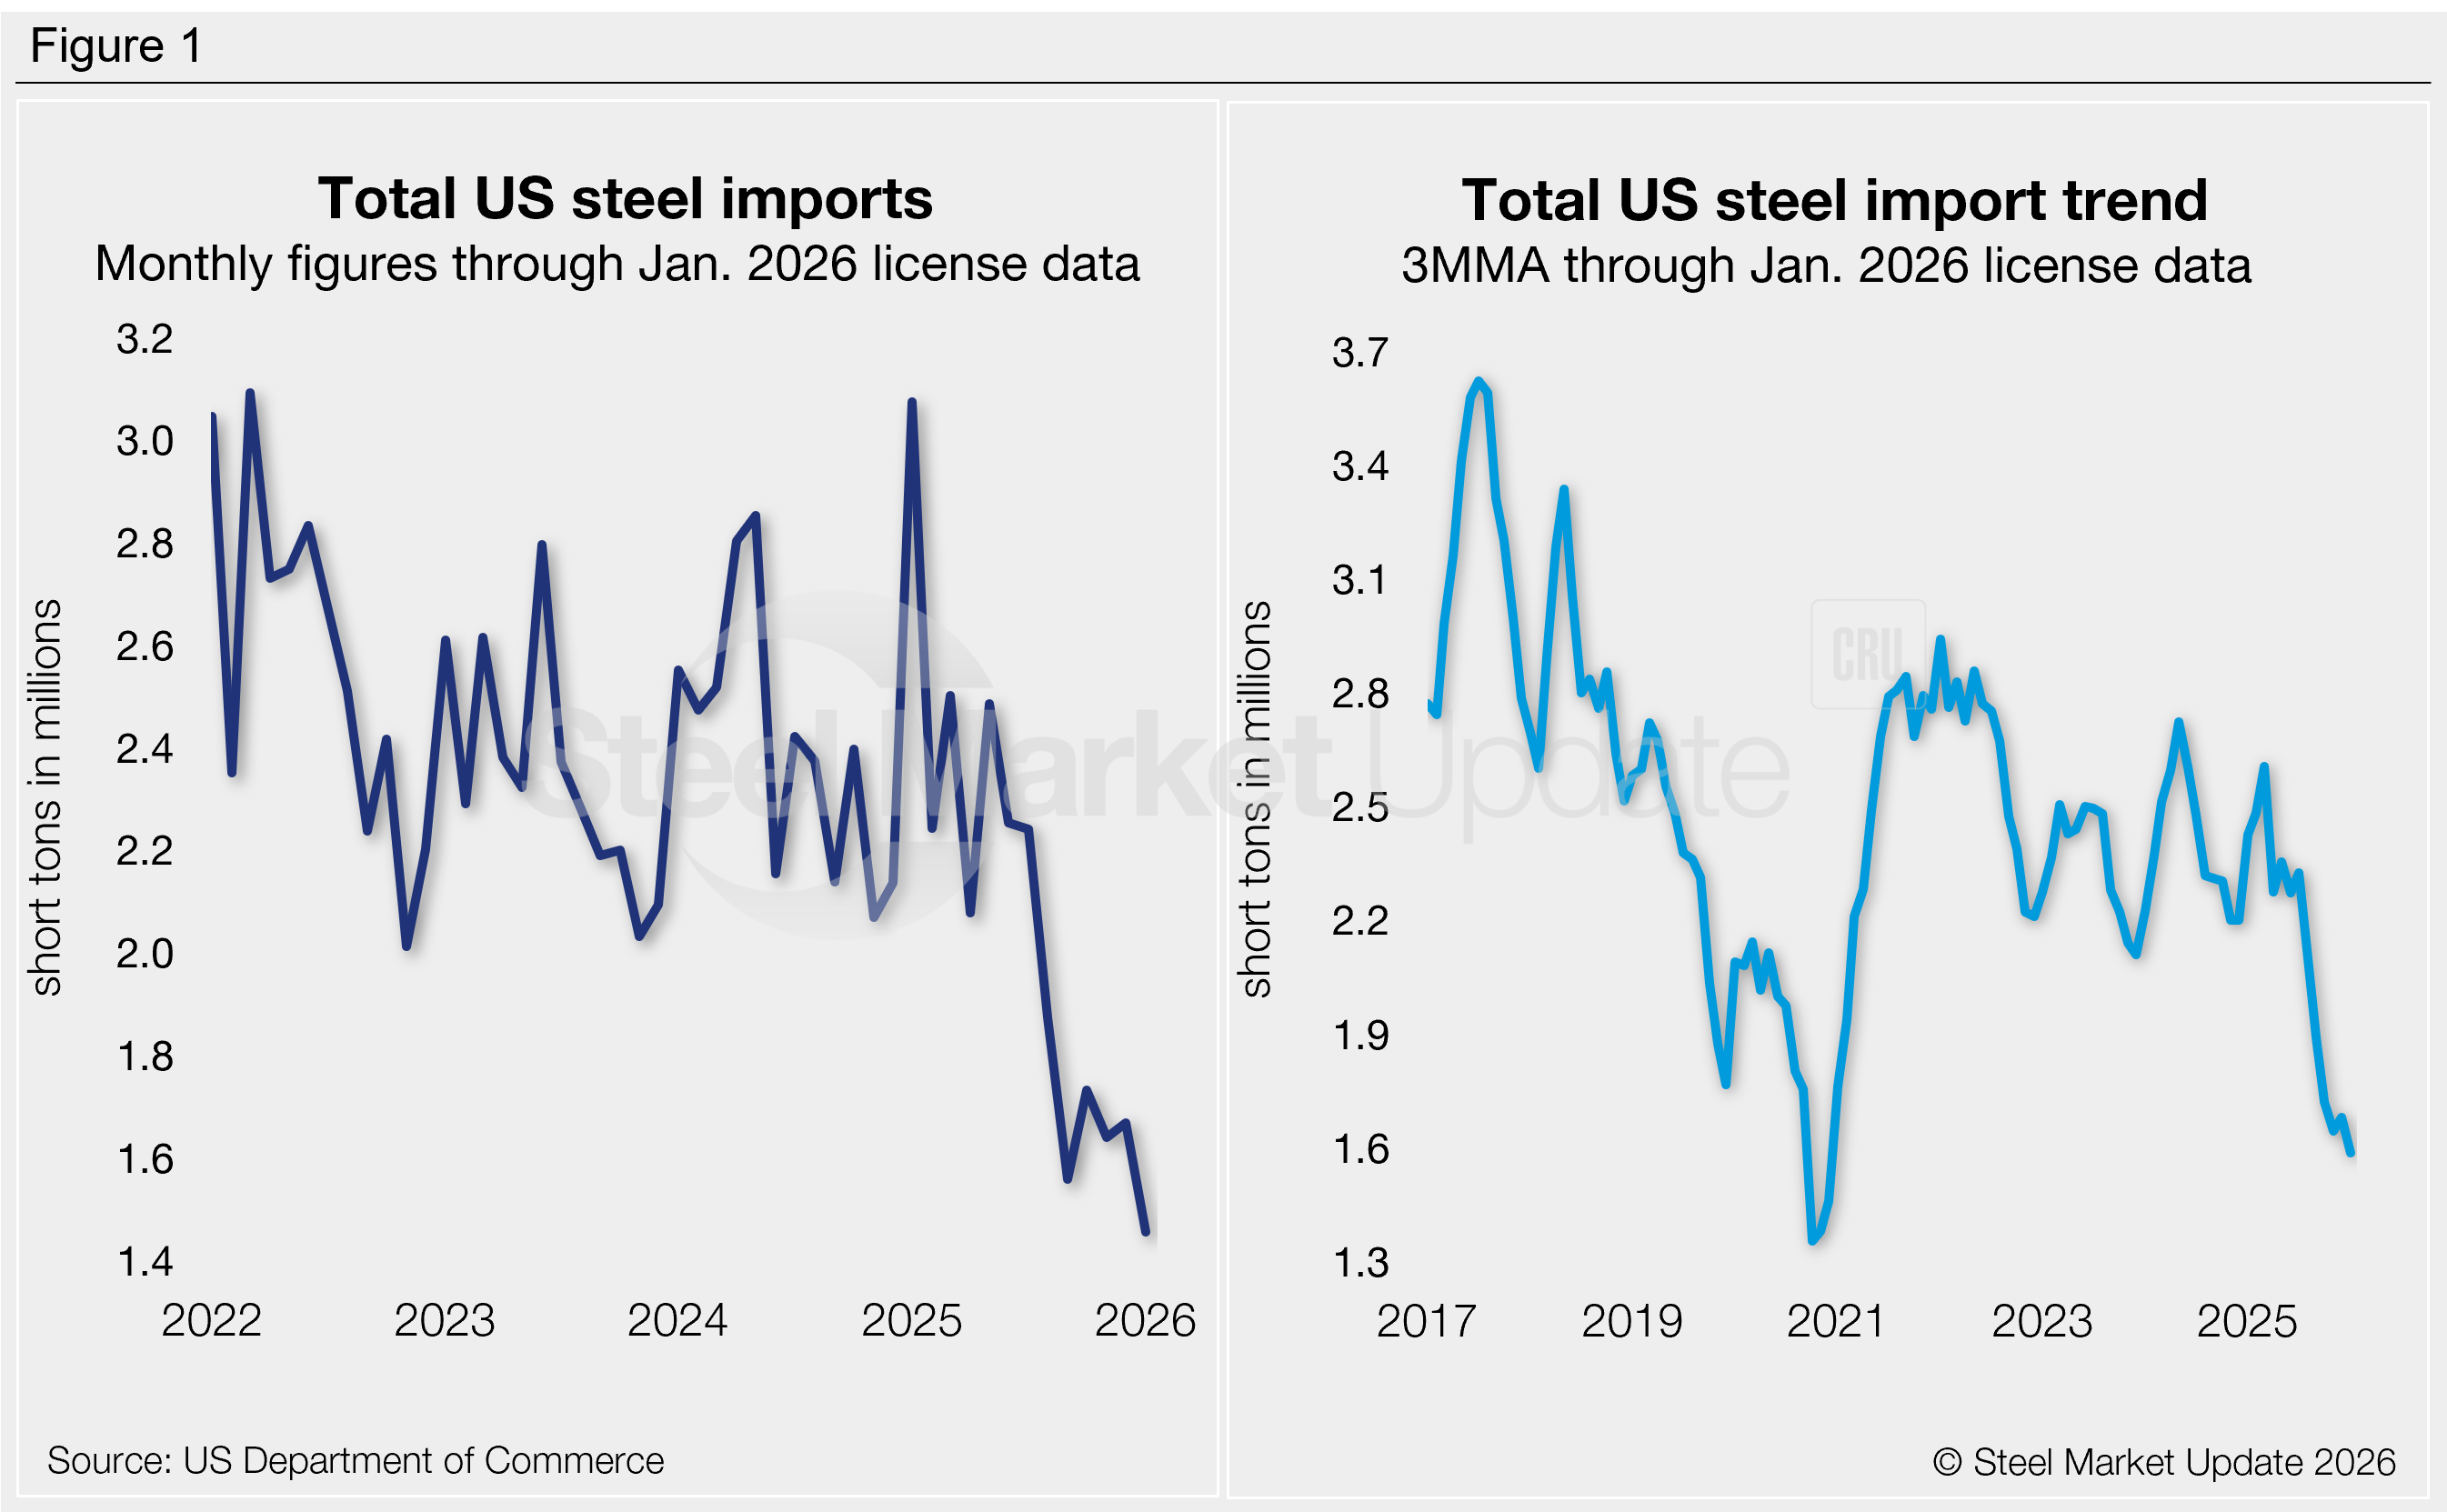
The total volume of steel products that entered the country in November was 1.64 million short tons (st). This is the second-lowest monthly import rate recorded in the past five years, just 80,000 st above the multi-year low set in September. The latest license data shows 1.67 million st of material was imported in December and 1.46 million st in January, potentially the lowest rate seen since November 2020.
Recall that imports spiked to a two-and-a-half-year high of 3.08 million st in January 2025. Trade balanced out through the first half of last year, then significantly slowed after July and did not recover (Figure 1, left).
Imports by country
Two-thirds of the steel that entered the country in November came from just eight countries: Canada (16%), Brazil (15%), Mexico (10%), South Korea (10%), Germany (5%), Taiwan (5%), Japan (4%), and Argentina (4%). Other major suppliers included India, Vietnam, Indonesia, Turkey, Romania, Australia, the Netherlands, and the United Kingdom, each contributing 2-3% of the total. Combined, these 16 countries accounted for 88% of all November imports.
The bulk of the decline seen in recent months can be attributed to four countries:
- In the second half of 2024, Canada exported an average of 513,000 st of steel per month to the US. This amount shrunk to 284,000 st per month in the second half of 2025, a 45% reduction.
- Imports from Brazil fell from an average of 330,000 st of steel per month to 252,000 st, a 24% reduction.
- Mexican exports to the US declined from an average of 261,000 st of steel per month to 184,000 st, a 30% reduction.
- Imports from Vietnam fell from an average of 115,000 st of steel per month to 67,000 st, a 41% reduction.
To explore steel import data by country, category, or specific product, visit the International Trade Administration’s Steel Import Monitor.
Import trends
To better highlight trends, import data can be analyzed as a three-month moving average (3MMA) to smooth out monthly variations (Figure 1, right). On this basis, 3MMA imports have trended lower since early 2025. The 3MMA fell to 1.65 million st through November, the lowest rate since December 2020.
The average monthly import rate of 2025 is currently 2.11 million st through December license data. This is down 12% from the 2024 rate of 2.41 million st per month and down 10% from the 2023 rate of 2.35 million st per month.
Imports by product
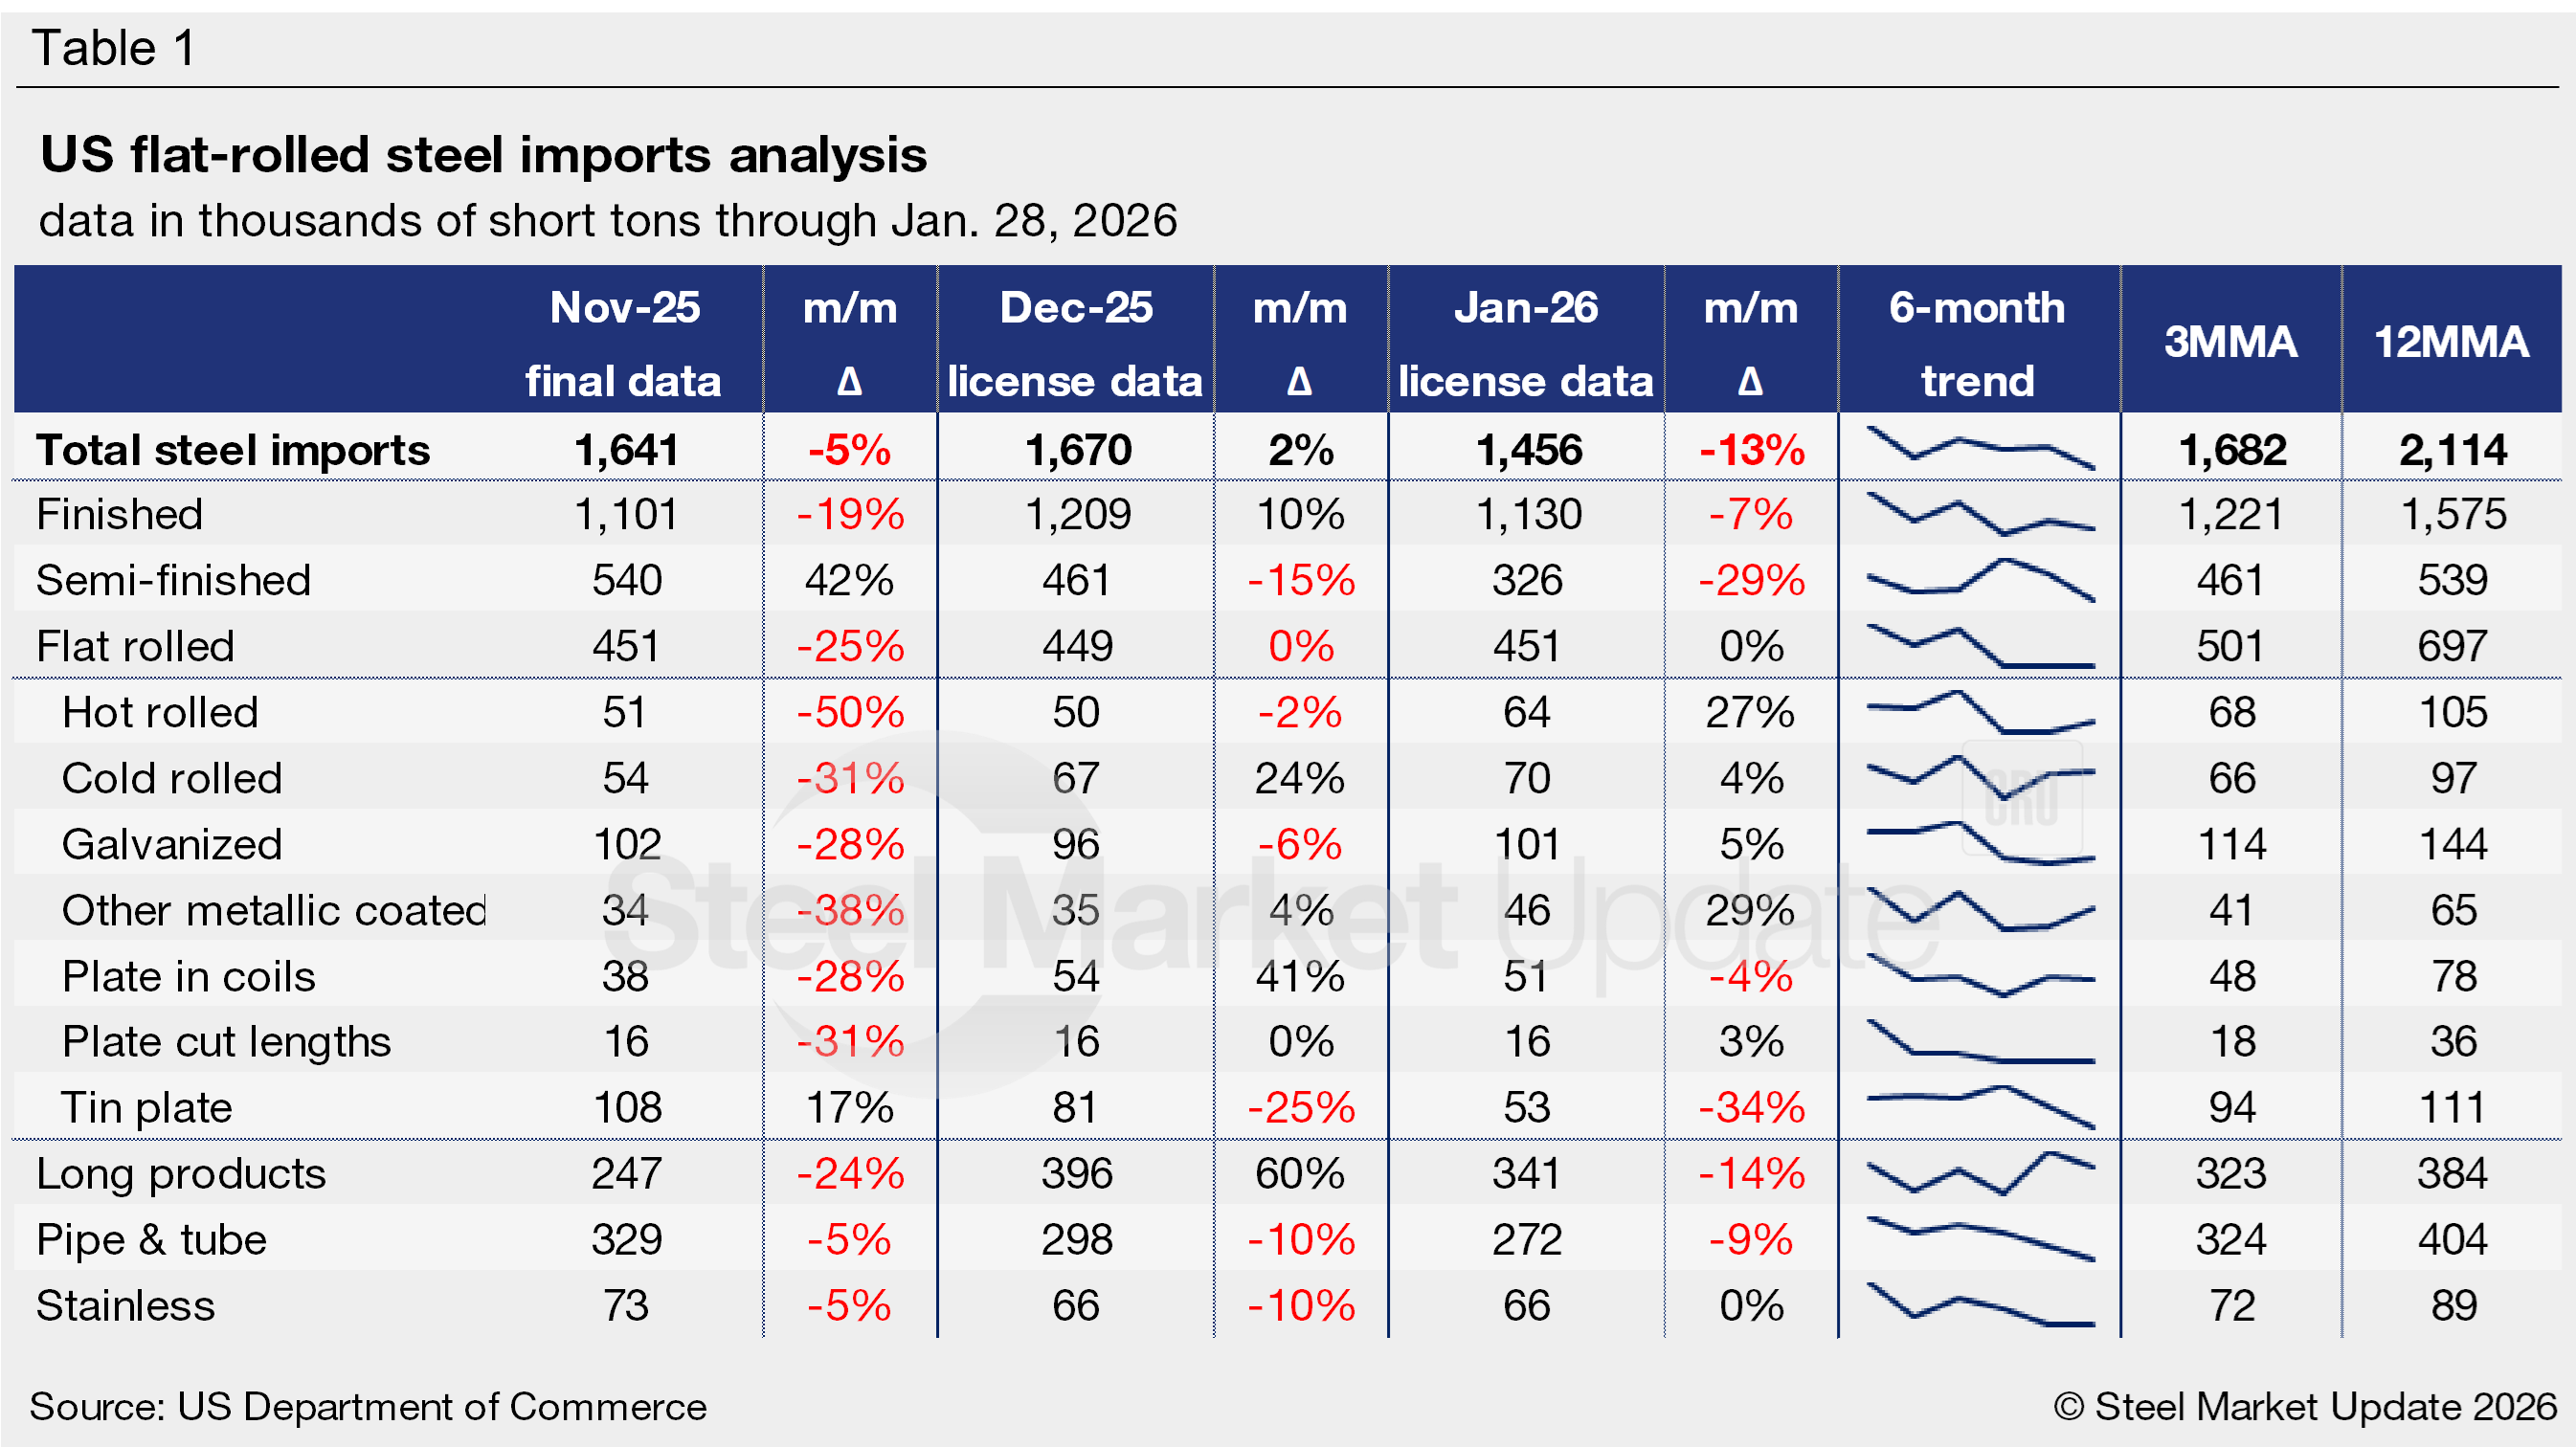
Table 1 highlights high-volume steel product imports (click to expand). Note that the 3MMA and 12MMA columns are calculated through December license data. For deeper analysis, visit our Steel Imports page.
Finished vs. semi-finished imports
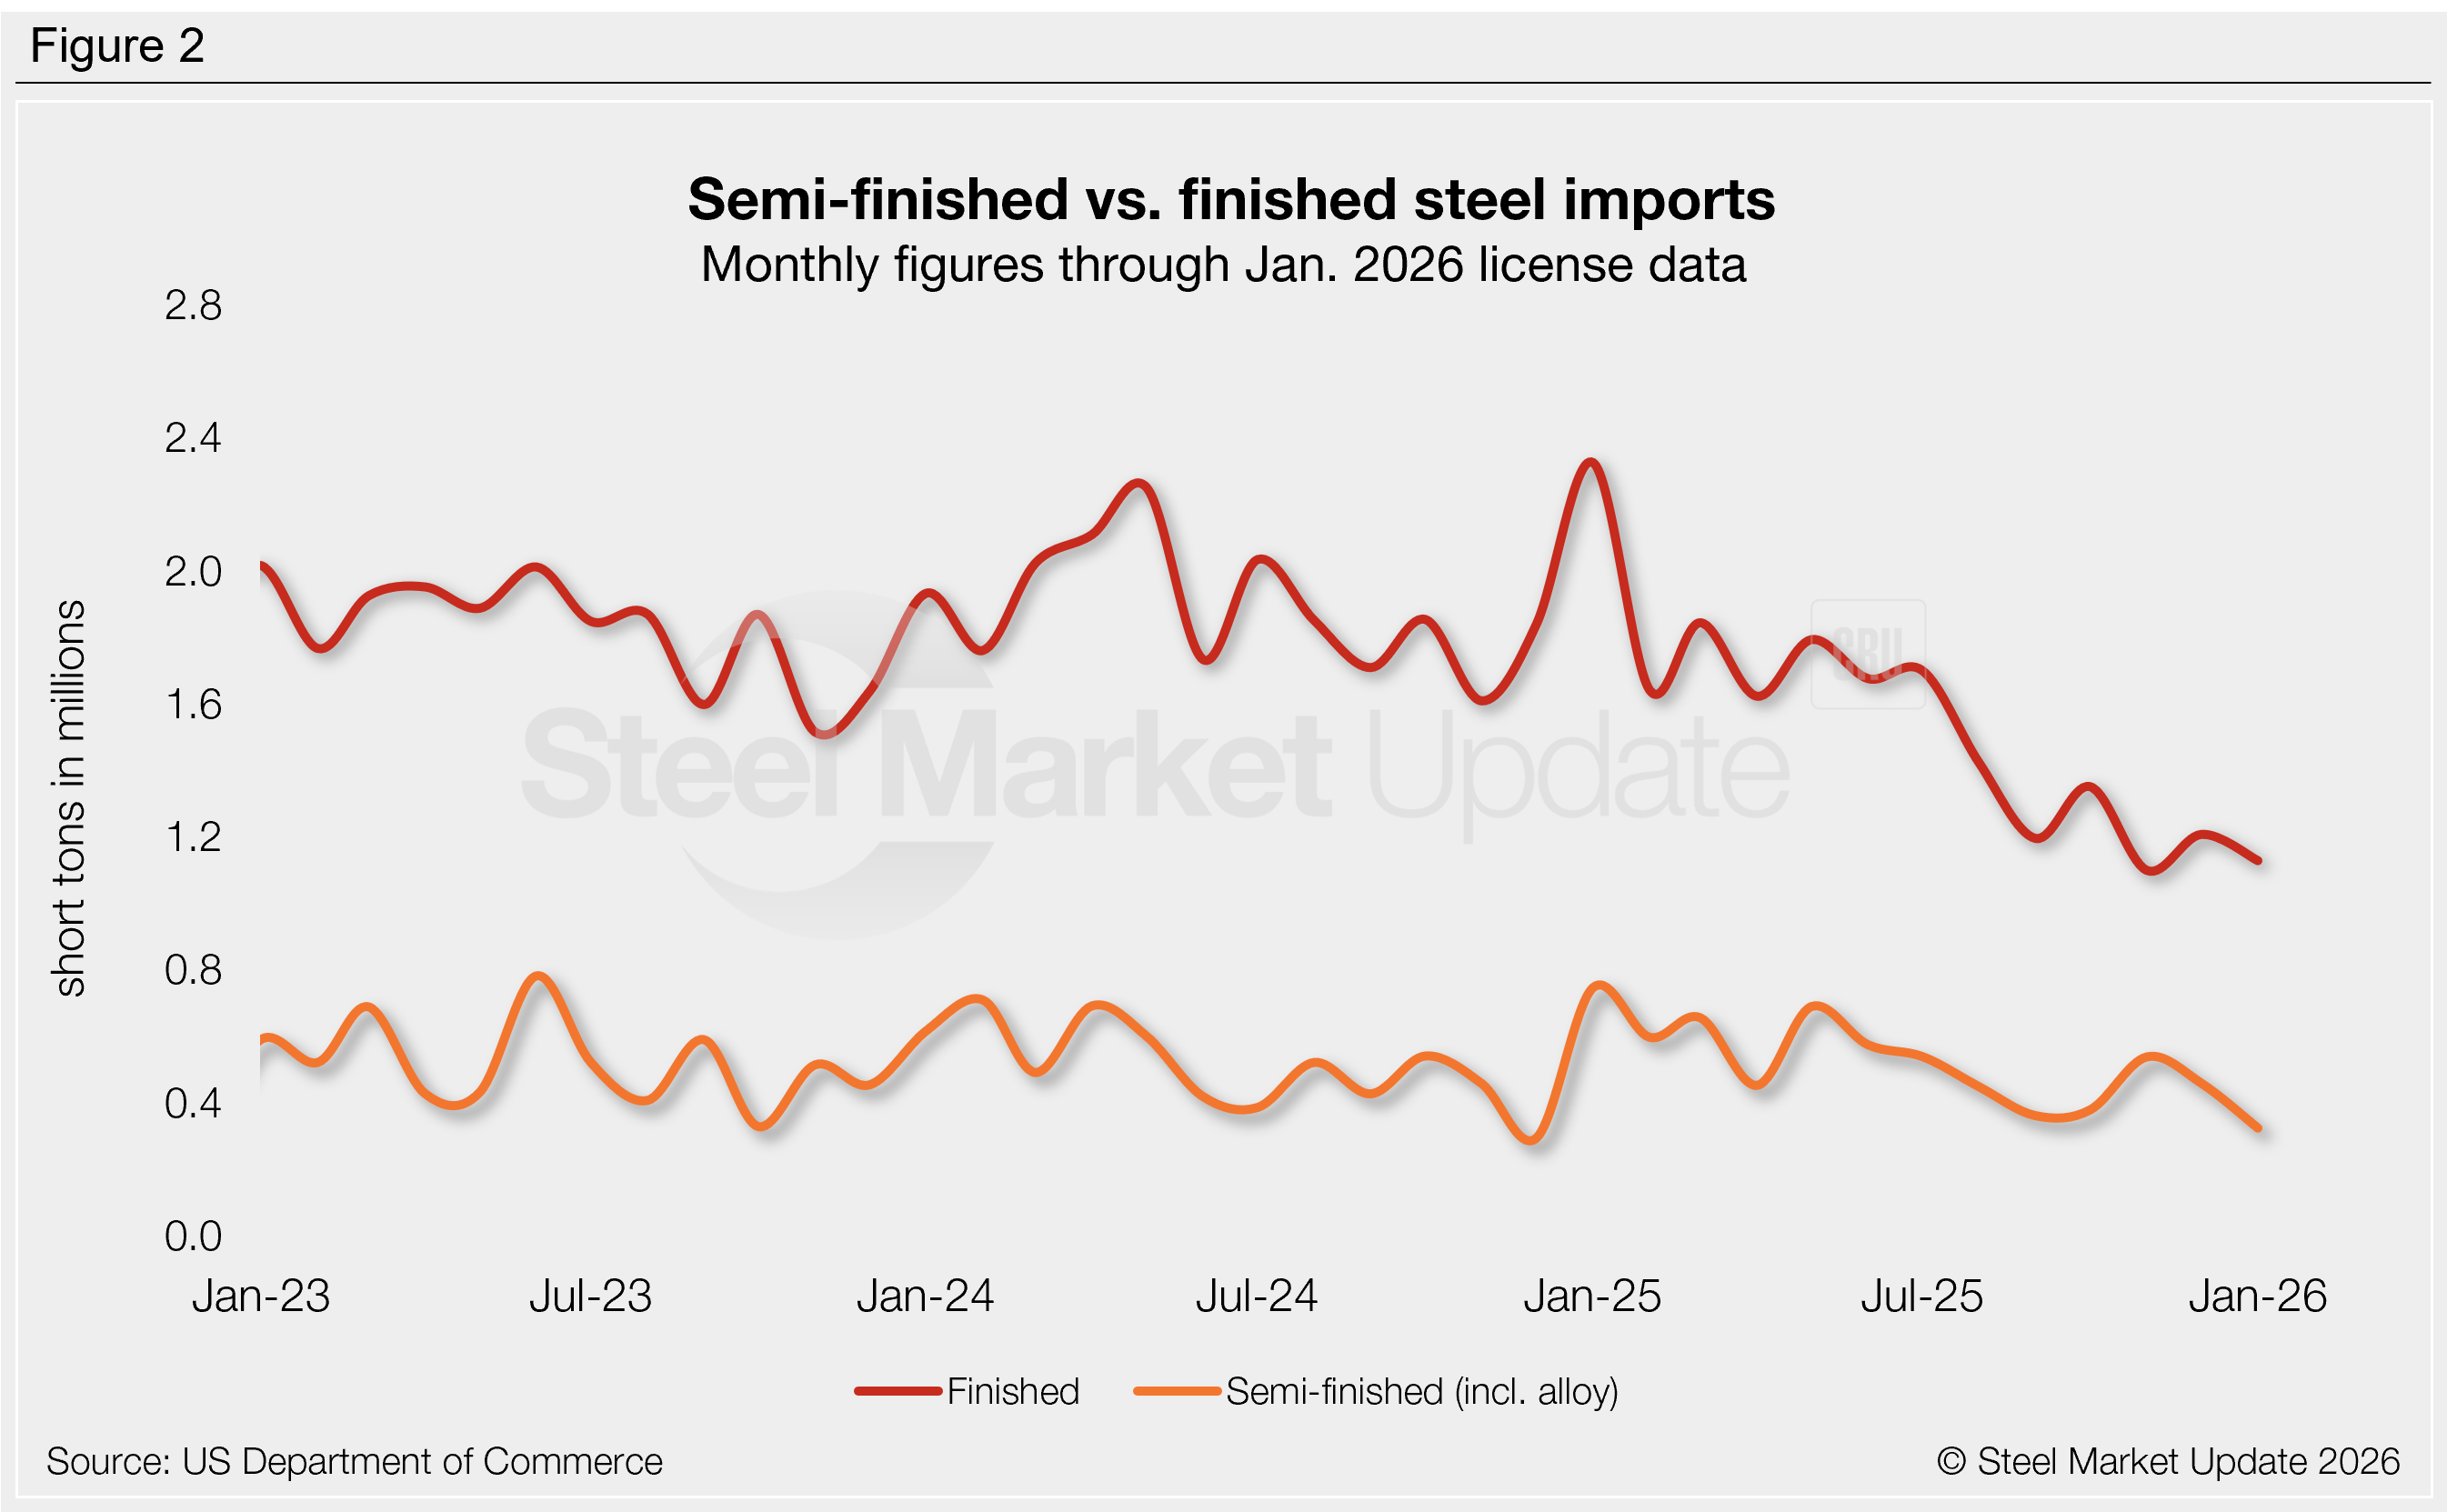
Imports of finished steel vs. semi-finished products (mostly slabs to be further processed by a mill) saw mixed movements in past three months, all at or near multi-year lows (Figure 2):
- Finished imports fell to a 16-year low of 1.10 million st in November, accounting for 67% of monthly imports. December license data is marginally higher at 1.21 million st, January is down to 1.13 million st. The same three months one year prior averaged 1.93 million st.
- Semi-finished imports rebounded to 540,000 st in November but slipped back down in December and January, resting at a 13-month low of 326,000 st.
Imports by category
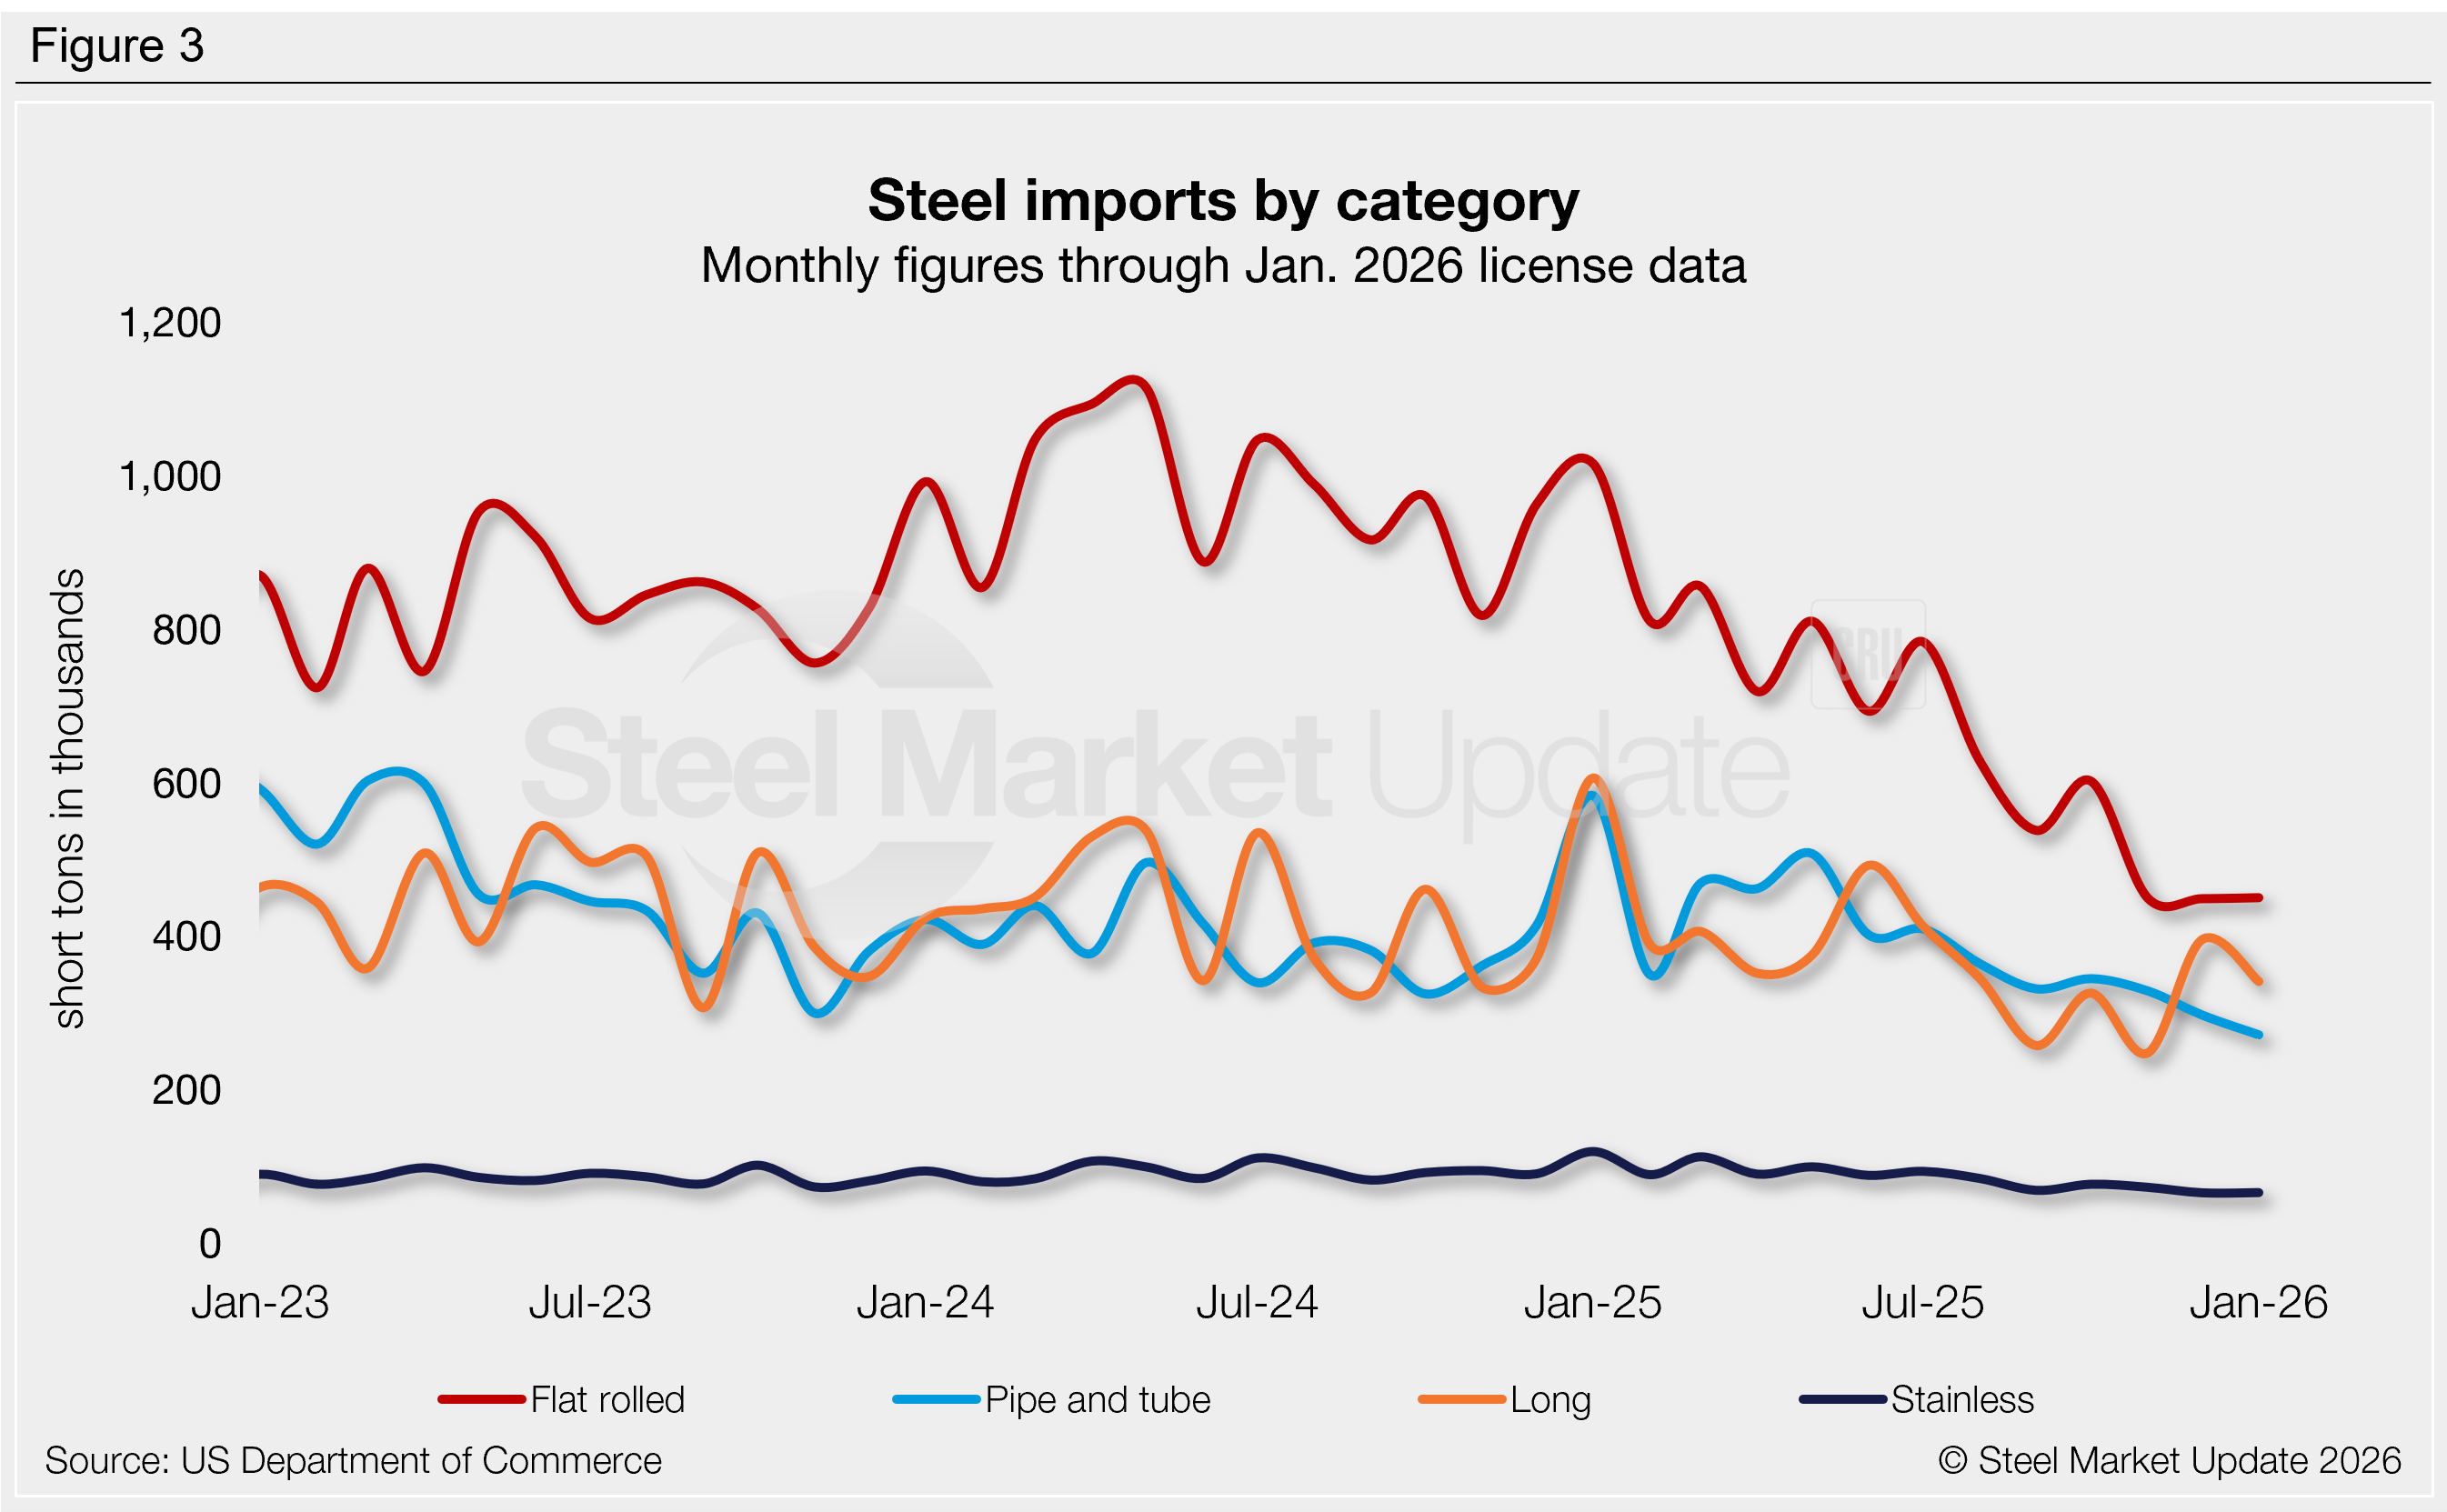
Figure 3 shows monthly imports by popular steel product categories. Notable shifts include:
- Flat-rolled imports fell in November following October’s recovery. Trade remains muted through December and January, currently at two of the lowest rates seen in our limited seven-year data history.
- Long products imports declined in November to the lowest rate recorded in our seven-year data history. License data shows potential improvements, with trade significantly higher in December and healthy in January.
- Pipe and tube imports slipped in November and are expected to decline in both December and January down to lows last seen in early 2021.
- Stainless imports also declined in November to one of the lower rates seen in years. December licenses are currently down to a near-five year low, with little change expected in January.
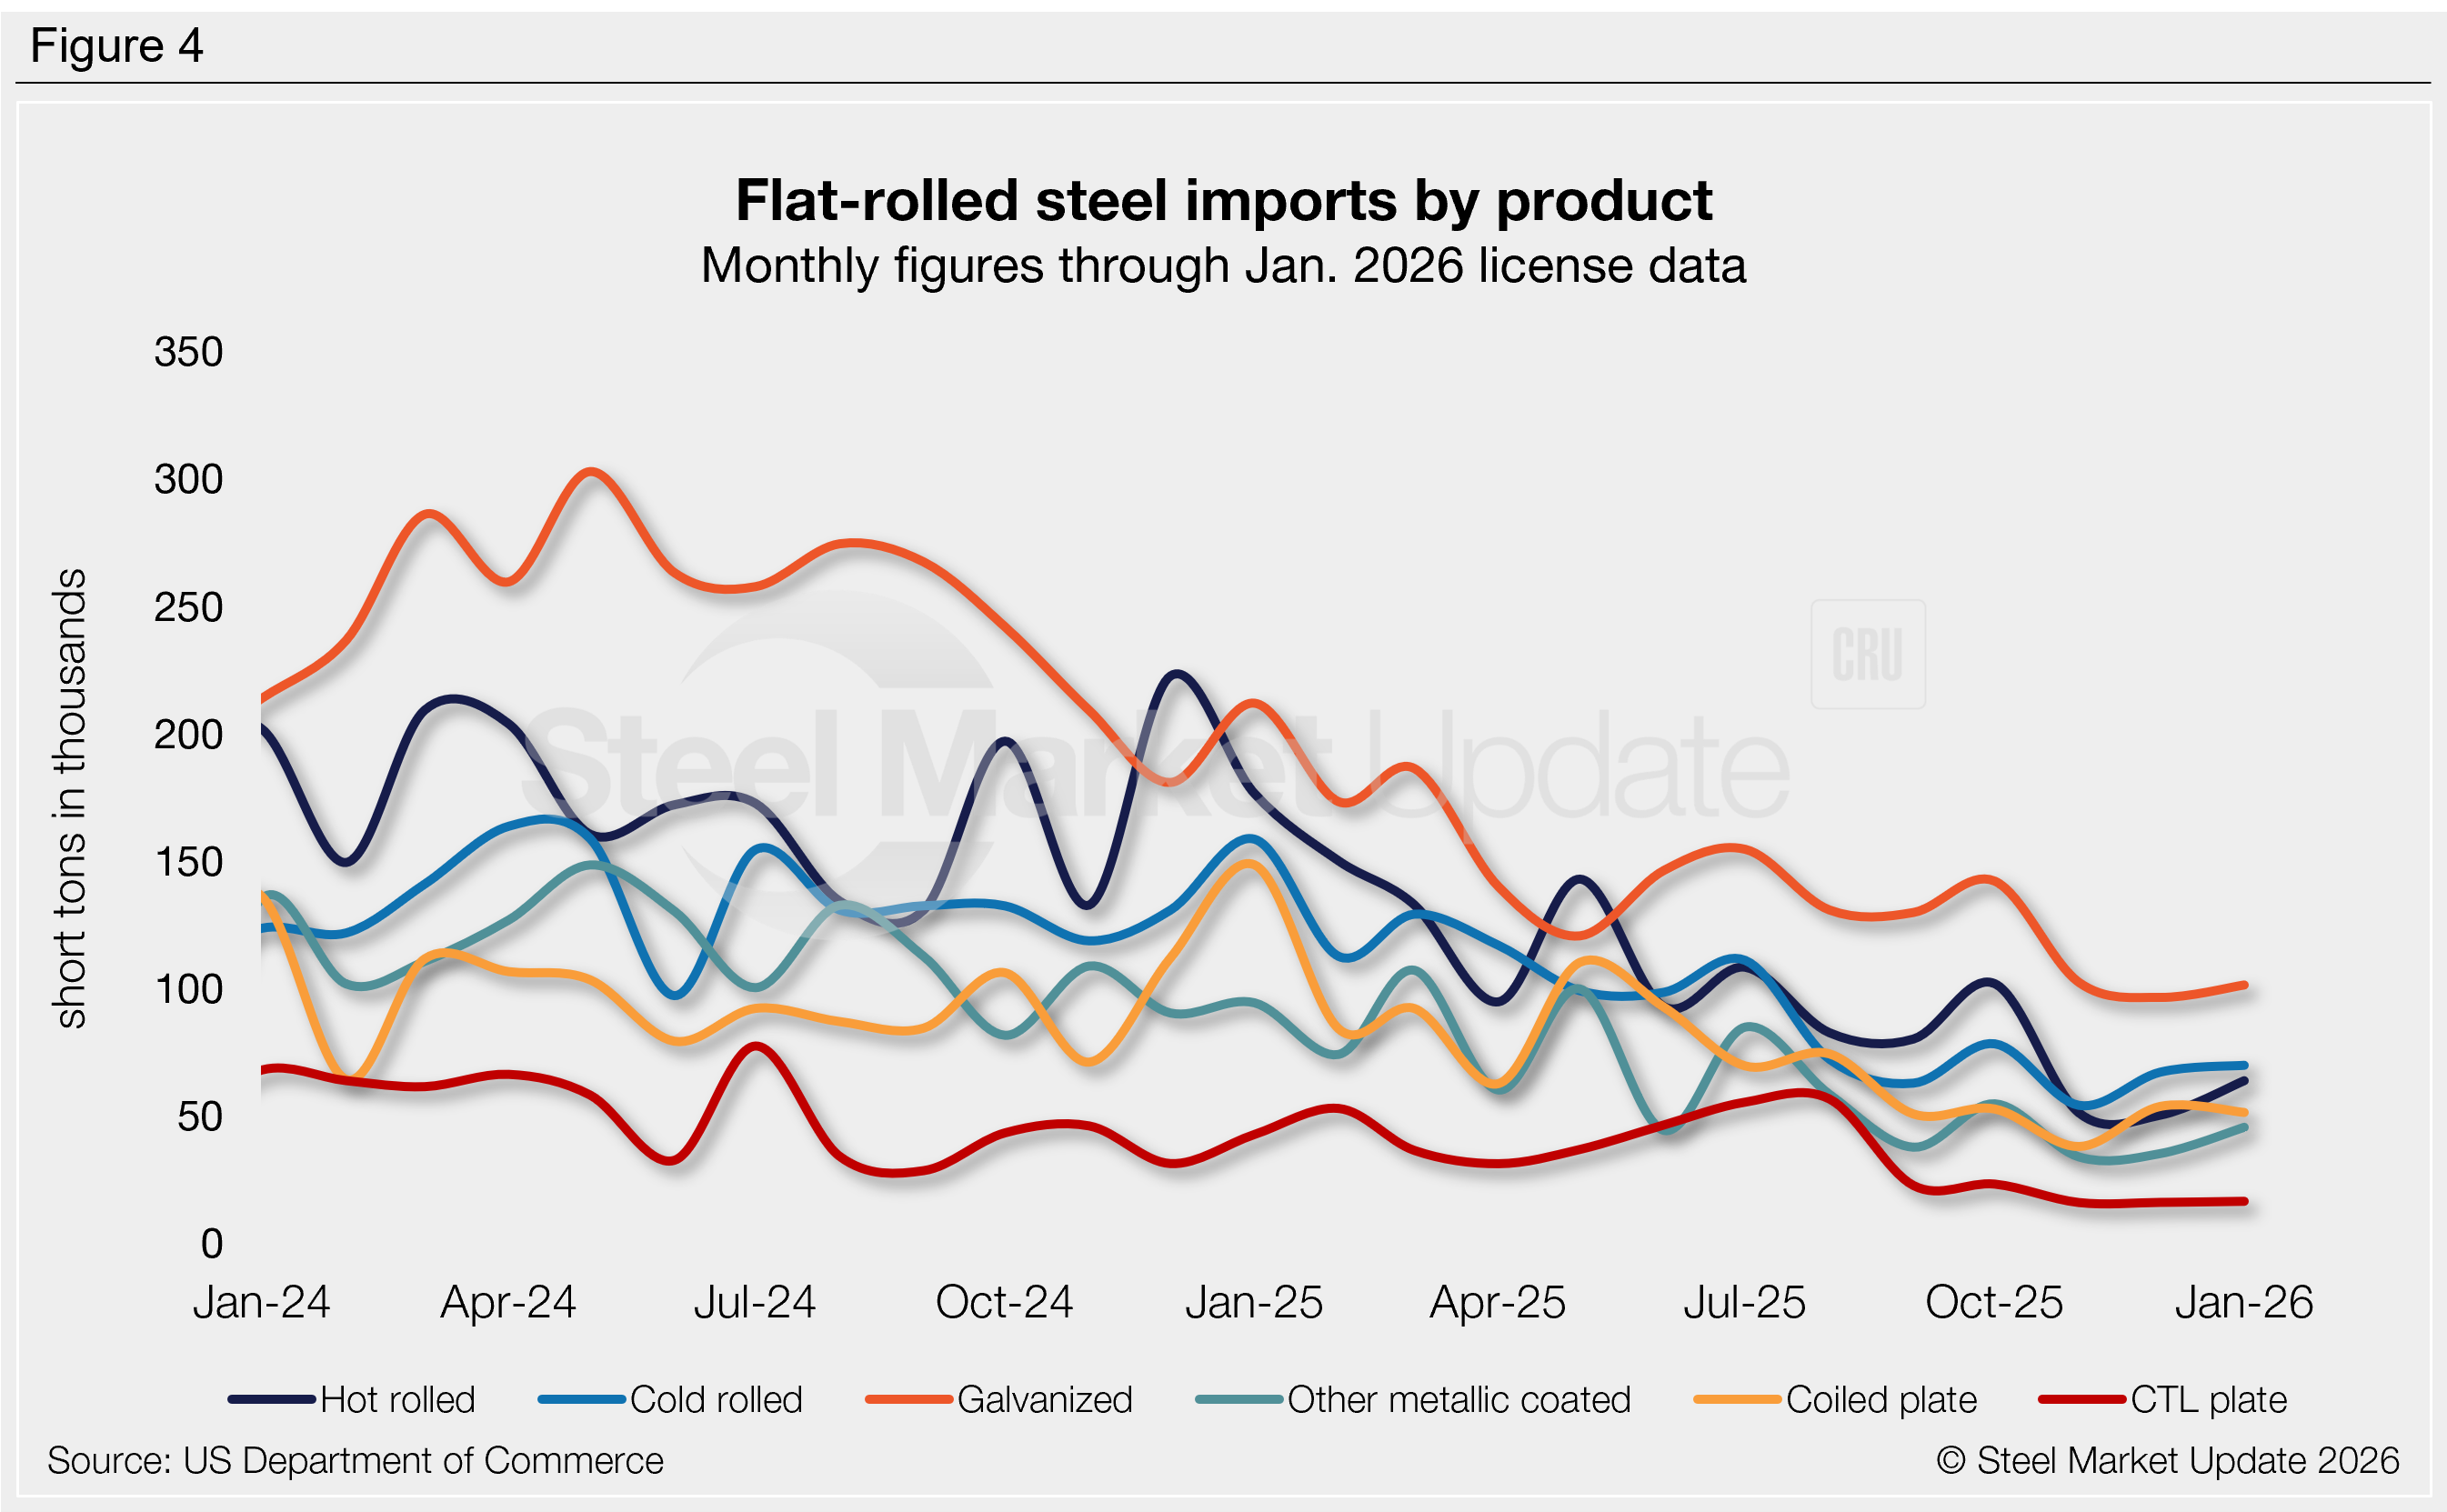
Flat-rolled imports
Figure 4 tracks flat-rolled imports for six popular sheet products. All declined from October to November, with many falling to multi-year lows. License data through December and January show minor improvements. Key highlights:
- Hot-rolled coil imports were slashed in half from October to November, and December licenses are at the lowest rate seen in our 28-year data history. January could see a modest recovery but trade remains historically weak.
- Imports of cold-rolled coil fell in November to low levels not seen since July 2009. Licenses are modestly higher in December and January.
- Galvanized imports fell in both November and December, dipping to a near 15-year low by the end of the year. January licenses are slightly up but remain low.
- Other-metallic coated (mostly Galvalume) imports fell to a near-six-year low in November, modestly recovering in December and January.
- Imports of coiled plate fell in November to the lowest rate seen since June 2009. Trade appears to have bounced back in December and January but is still less than half of what it was one year ago.
- Cut-to-length (CTL) plate imports dropped in November and December, falling to lows not seen in our 28-year data history. January levels remain similarly weak.