

Analysis

February 23, 2026
N. American auto assemblies improved in January
Written by David Schollaert
North American auto assemblies recovered in January, up nearly 12% vs. December, though down more than 2% year on year (y/y), according to GlobalData.
After repeated seasonal declines in November and December, assembly numbers rallied in January, as expected. But numbers were a bit muted to kick off 2026, totaling the lowest output in three years.
January’s production total was also nearly 12% below 2025’s monthly average of 1.26 million units.
Background
Recall that the Trump administration first imposed a 25% tariff on all imported light vehicles last April. By May, the same 25% duty applied to auto parts.
Spring buying surged as a result. It front-loaded consumer demand. That momentum tapered through summer but recovered through Q3 and into Q4 before tailing off to close out 2025. These inconsistencies underline the strain tariffs have had on North American auto production—impacting costs and disrupting cross-border supply chains.
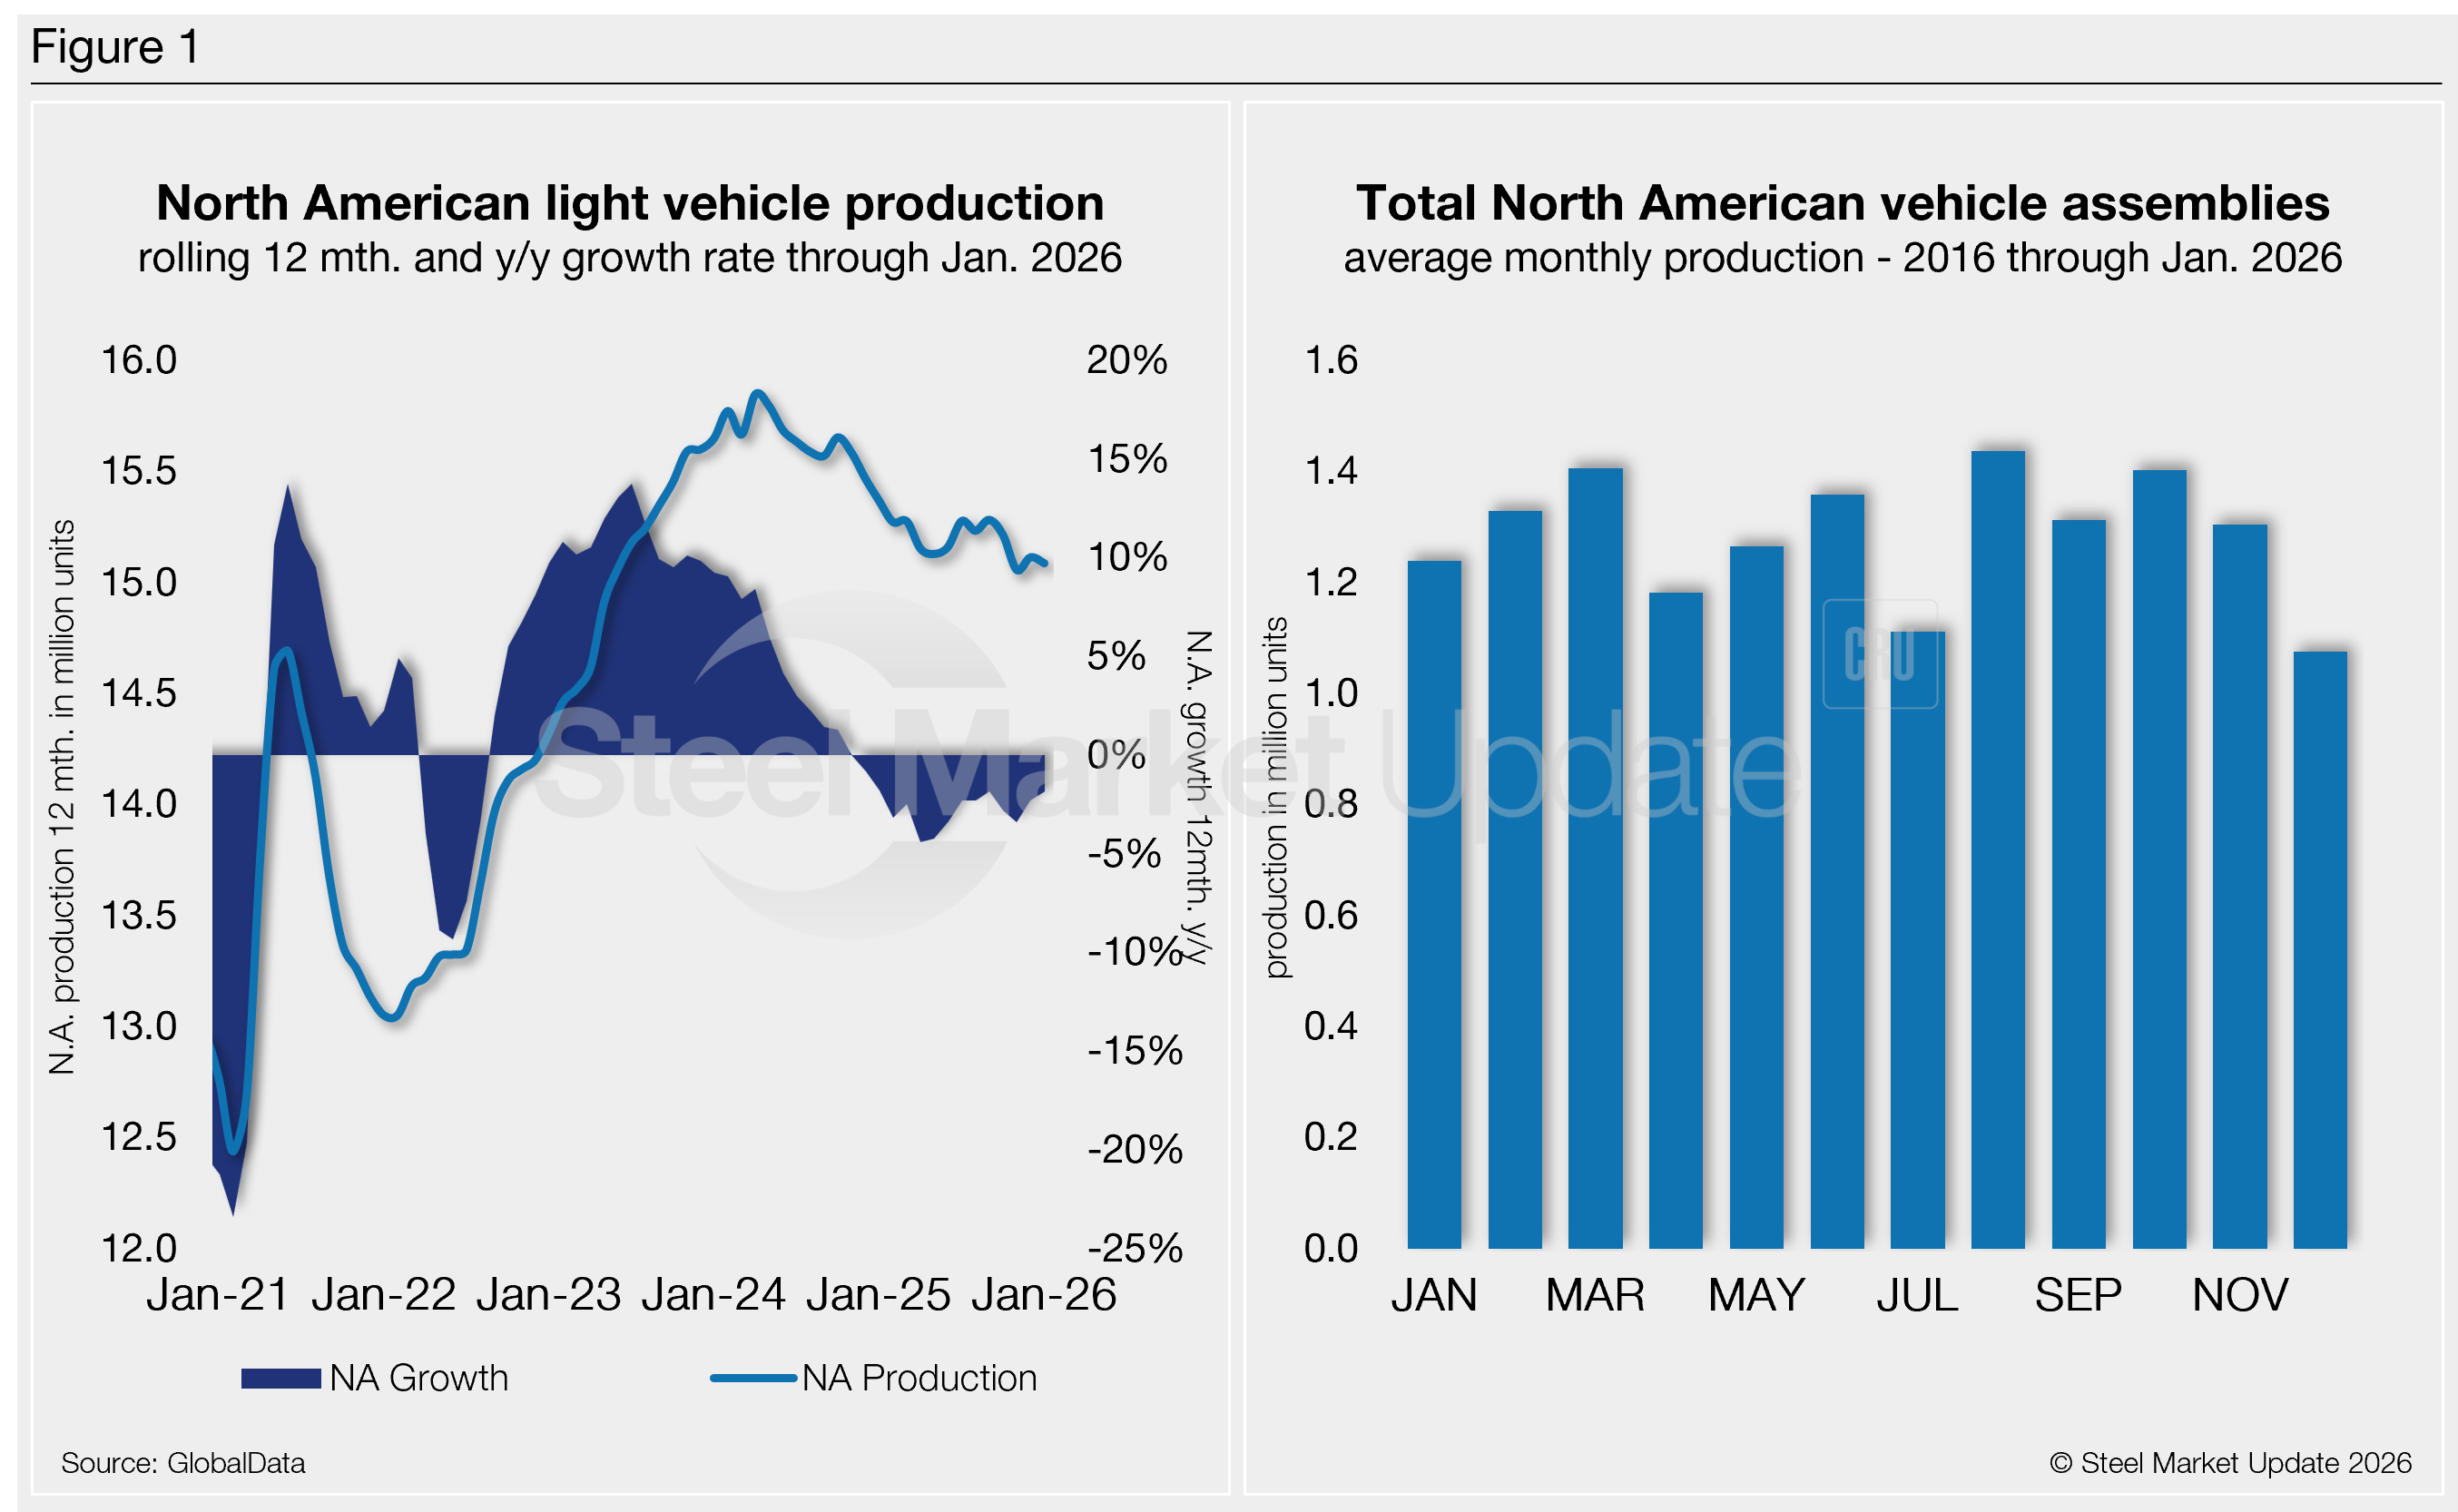
North American vehicle production, including personal and commercial vehicles, totaled 1.110 million units in January, up 11.8% from December’s 993,705 units, but down 2.4% from the 1.138 million units produced a year earlier.
Figure 1 below provides a five-year snapshot of North American light-vehicle production since 2020 on a rolling 12-month basis with a y/y growth rate. Also included is a five-year snapshot of average monthly production, which includes seasonality since 2016.
A short-term snapshot of assembly by nation and vehicle type is shown in the table below. It breaks down total North American personal and commercial vehicle production into US, Canadian, and Mexican components. It also includes the three- and 12-month growth rates for each and their momentum change.
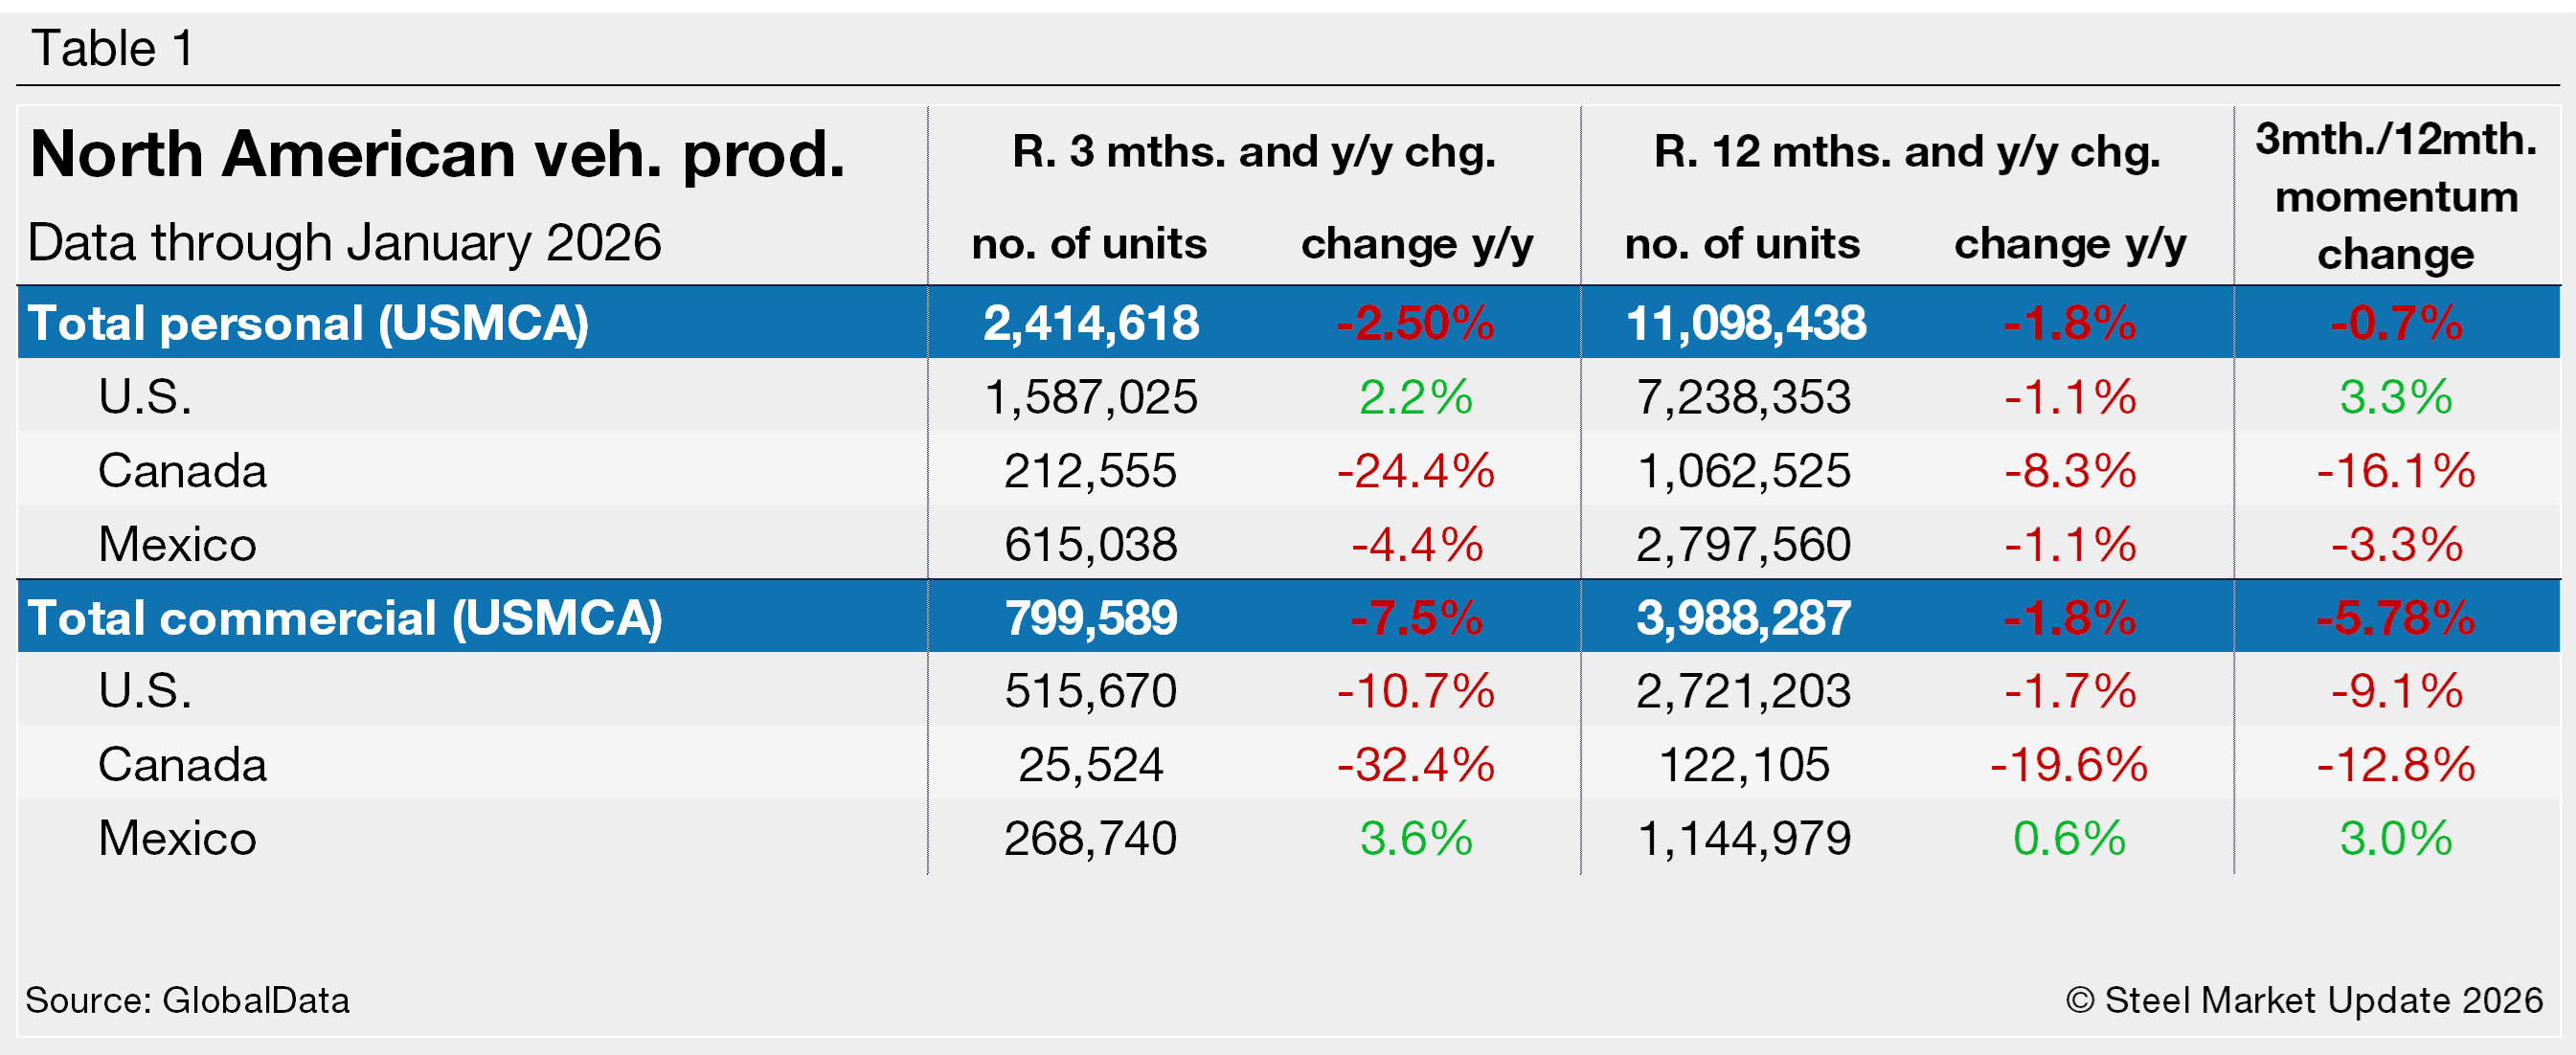
For the three months and 12 months through January, the growth rate for total personal production in the USMCA region saw a decline, falling at a sharper rate in the near term. Commercial production had seen some growth in past months, but recent cuts have seen output lag noticeably in the near-term and vs. year-ago levels.
Personal vehicle production
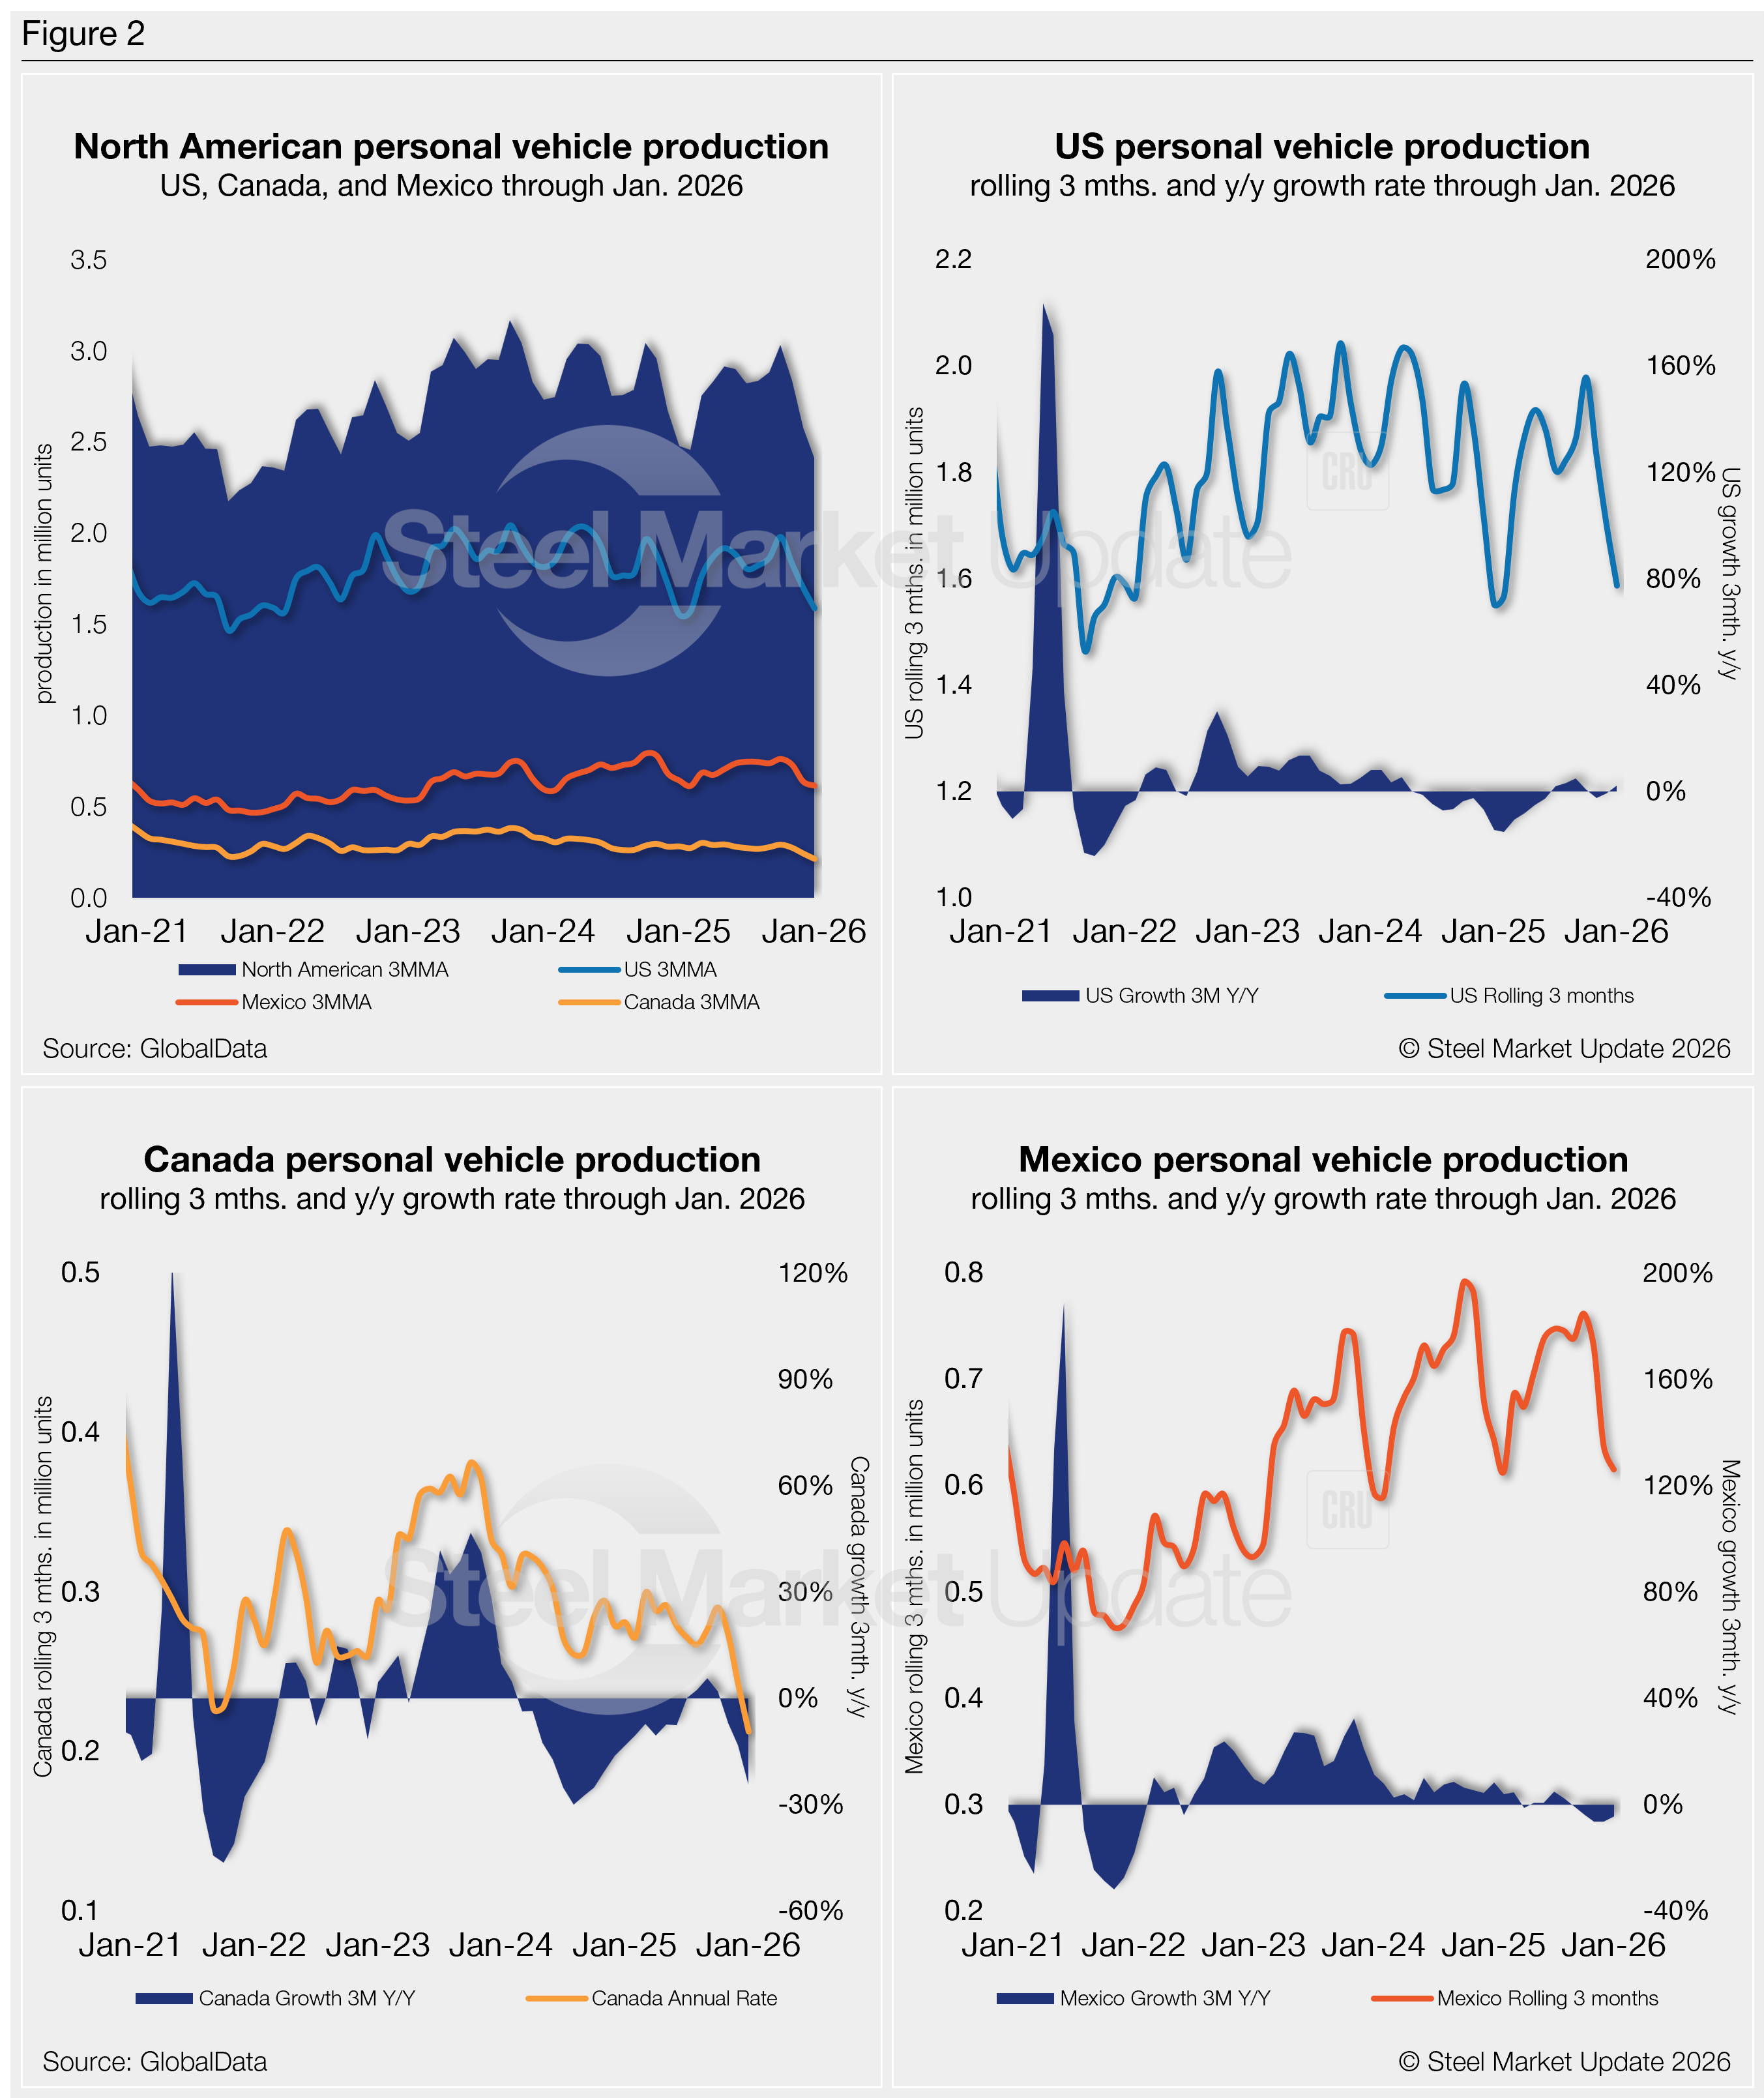
The longer-term picture of personal vehicle production across North America is shown below. The charts in Figure 2 show the total personal vehicle production for North America and the total for the US, Canada, and Mexico.
In terms of personal vehicle production, this segment saw a 15.3% month-over-month (m/m) gain in January. Assemblies last month totaled 855,313 units, up from 741,849 units in December. But that’s still about 1% below a year earlier.
The US saw a 6.7% m/m production increase, with 34,746 more units in January. Mexico surged, producing 78,108 (+49.4%) additional units, while Canada was up marginally, producing 610 (+0.9%) more units.
Production share across North America was little changed. The US’ personal vehicle production share of the North American market was 65.7%, followed by Mexico and Canada at 25.5% and 8.8%, respectively.
Commercial vehicle production
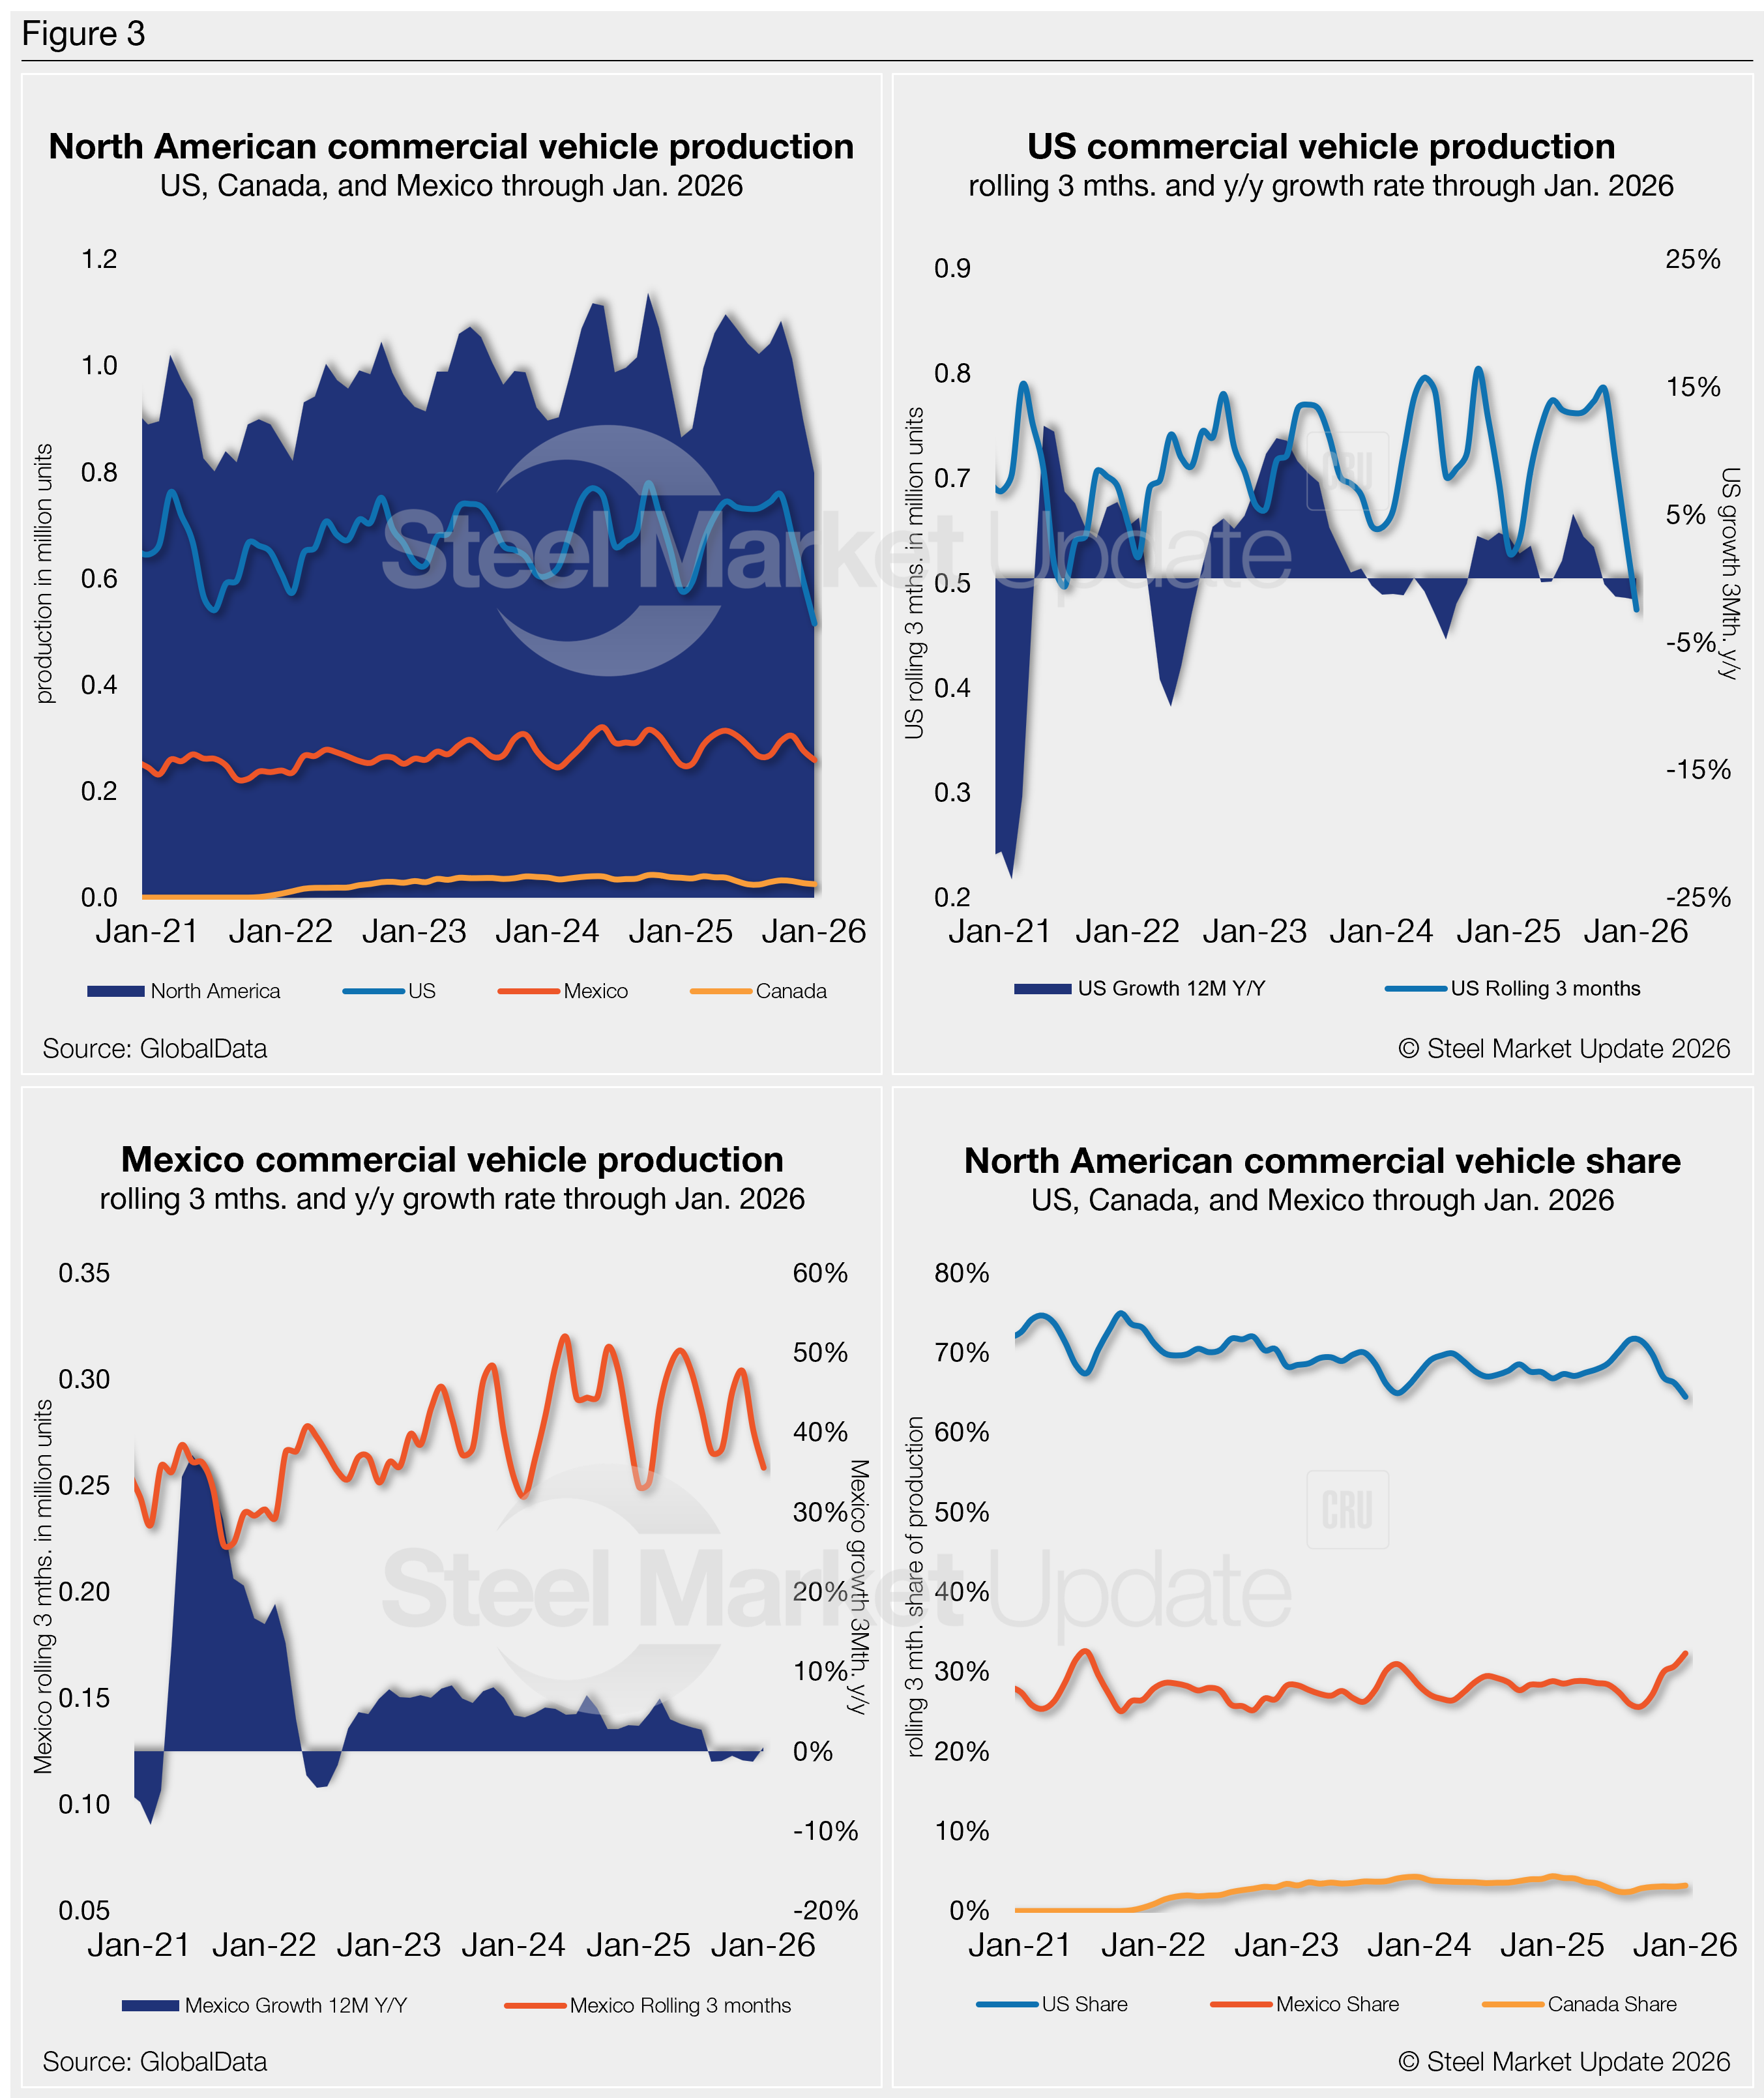
Total commercial vehicle production in North America and the total for each country within the region are shown in Figure 3 on a rolling three-month basis. Commercial vehicle production in the US and Mexico, as well as their y/y growth rates and the production share for each nation in North America, are also shown.
North American commercial vehicle production was also up in January, but at a much slower rate. The region saw a 1.4% m/m gain, with a total of 255,375 units, up from 251,856 units in December. January’s output was also still 6.7% below last year.
The US saw a 5.7% m/m cut, with 9,777 fewer commercial vehicles assembled in January, and 11.8% fewer y/y. Canada also saw commercial assemblies decline m/m in January, with 1,609 (-19.4%) fewer units. Mexico was the sole market to report growth last month, with a 20.5% (+14,905 units) gain vs. December, and a total assembly of 87,768 units in January. That’s also a 12.8% boost vs. year-ago levels.
The market share across the region was also largely unchanged in September. The US total share was 64.5%, followed by Mexico with 32.3% and Canada with 3.2%.
Mexico exports roughly 85% of its light-vehicle production, with the US and Canada as the highest-volume destinations.
Editor’s note
This report is based on data from GlobalData for automotive assemblies in the US, Canada, and Mexico. The breakdown of assemblies is “Personal” (cars for personal use) and “Commercial” (light vehicles with less than 6.0 metric tons gross vehicle weight rating; heavy trucks and buses are not included).


