Canada
February 24, 2026
Steel imports historically weak through December and January
Written by Brett Linton
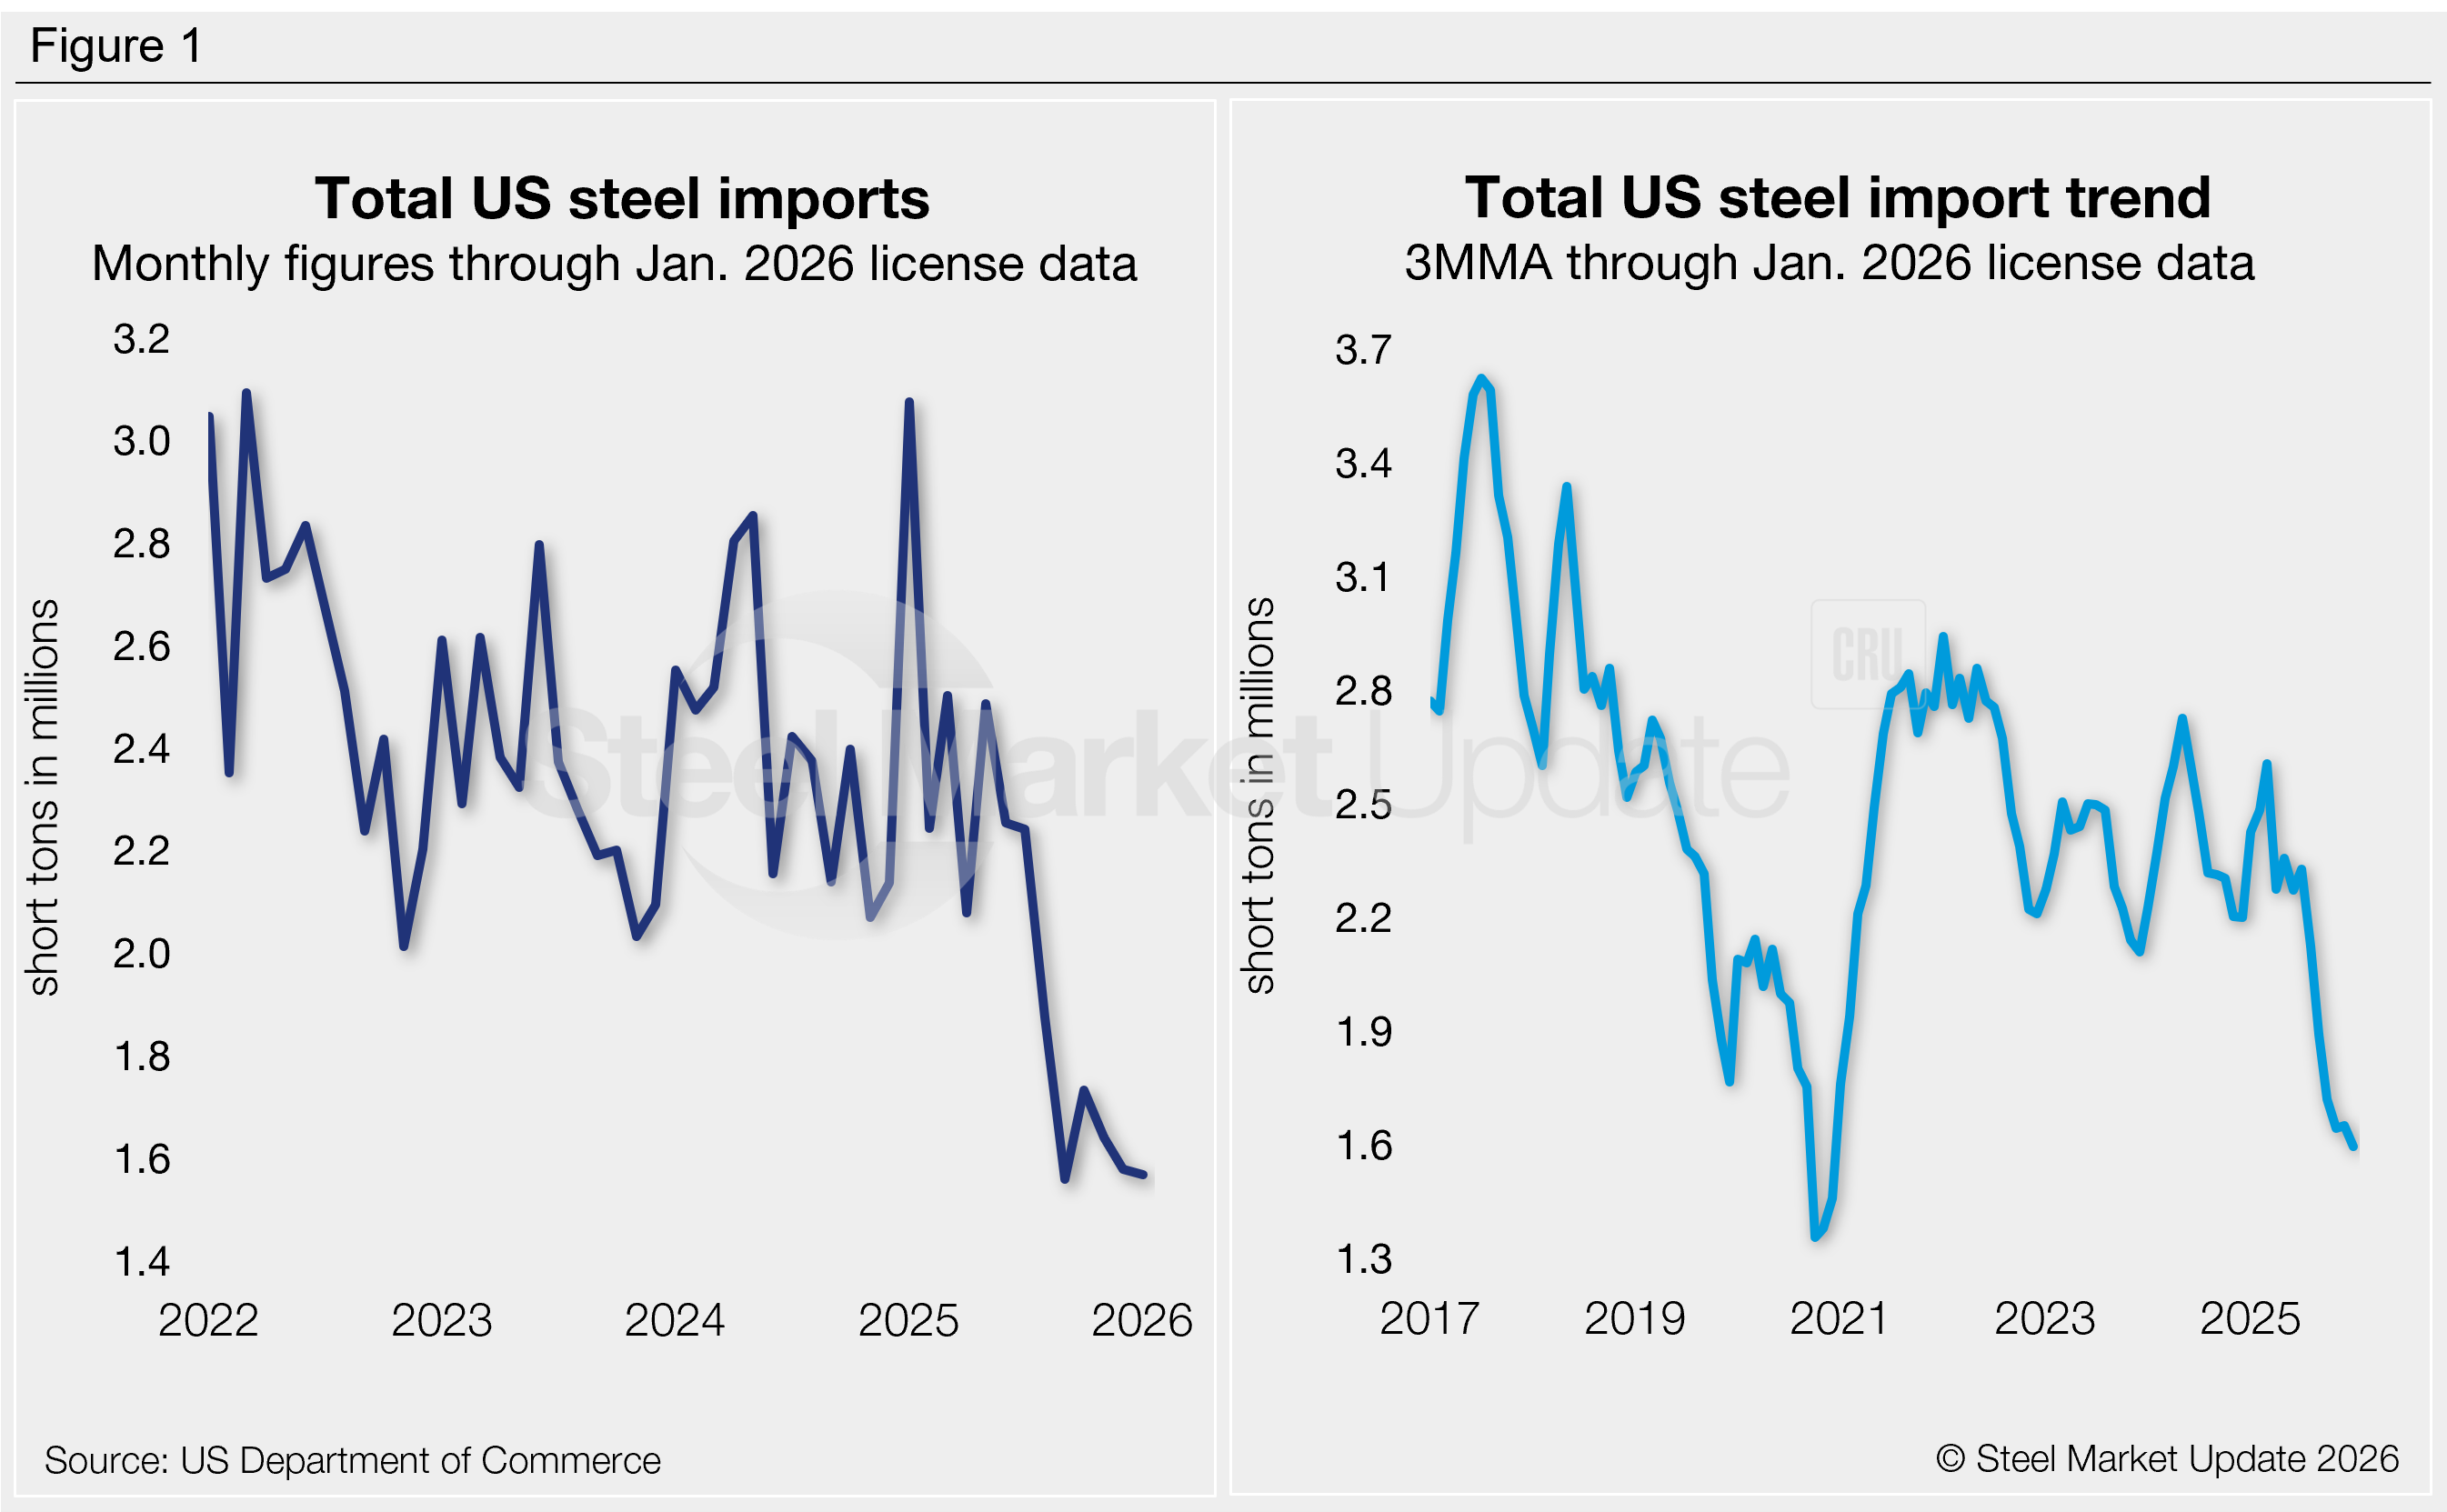
Steel imports slowed further in December and January, falling to near multi-year lows, according to recently released final US Commerce Department data. December trade declined 4% month-over-month (m/m) and January license figures were down another 1%, representing some of the lowest monthly trade volumes witnessed over the last five years.
The total volume of steel products that entered the country in December was 1.58 million short tons (st). This is the second-lowest monthly import rate recorded since 2020, just 19,000 st above the multi-year low set in September. The latest license data shows 1.57 million st of material was imported in January.
Recall that just one year ago, imports spiked to a two-and-a-half-year high of 3.08 million st in January 2025. Trade balanced out through the first half of last year, then significantly slowed after July and have not recovered since (Figure 1, left).
Imports by country
Focusing on final December figures, two-thirds of the steel that entered the country came from just seven countries: Brazil (16%), Canada (15%), South Korea (11%), Mexico (9%), Japan (7%), Turkey (4%), and Germany (4%). Other major suppliers included Vietnam, China, the United Arab Emirates, India, Taiwan, Argentina, Indonesia, Malaysia, Italy, and Spain, each contributing 2-3% of the total. Combined, these 17 countries accounted for 90% of all December imports.
Zooming out, the bulk of the decline seen in recent months can be primarily traced to four countries: Canada, Brazil, Mexico, and Vietnam. Comparing import volumes in the second half of 2024 to the same period of 2025 shows reductions from 24-45%.
To explore steel import data by country, category, or specific product, visit the International Trade Administration’s Steel Import Monitor.
Import trends
To better highlight trends, import data can be analyzed as a three-month moving average (3MMA) to smooth out monthly variations (Figure 1, right). On this basis, 3MMA imports have trended lower since April 2025. Through January license data, the 3MMA is down to 1.60 million st, the lowest rate since December 2020.
The average monthly import rate of 2025 was 2.11 million st. This is down 13% from the 2024 rate of 2.41 million st per month and down 10% from the 2023 rate of 2.35 million st per month.
Imports by product
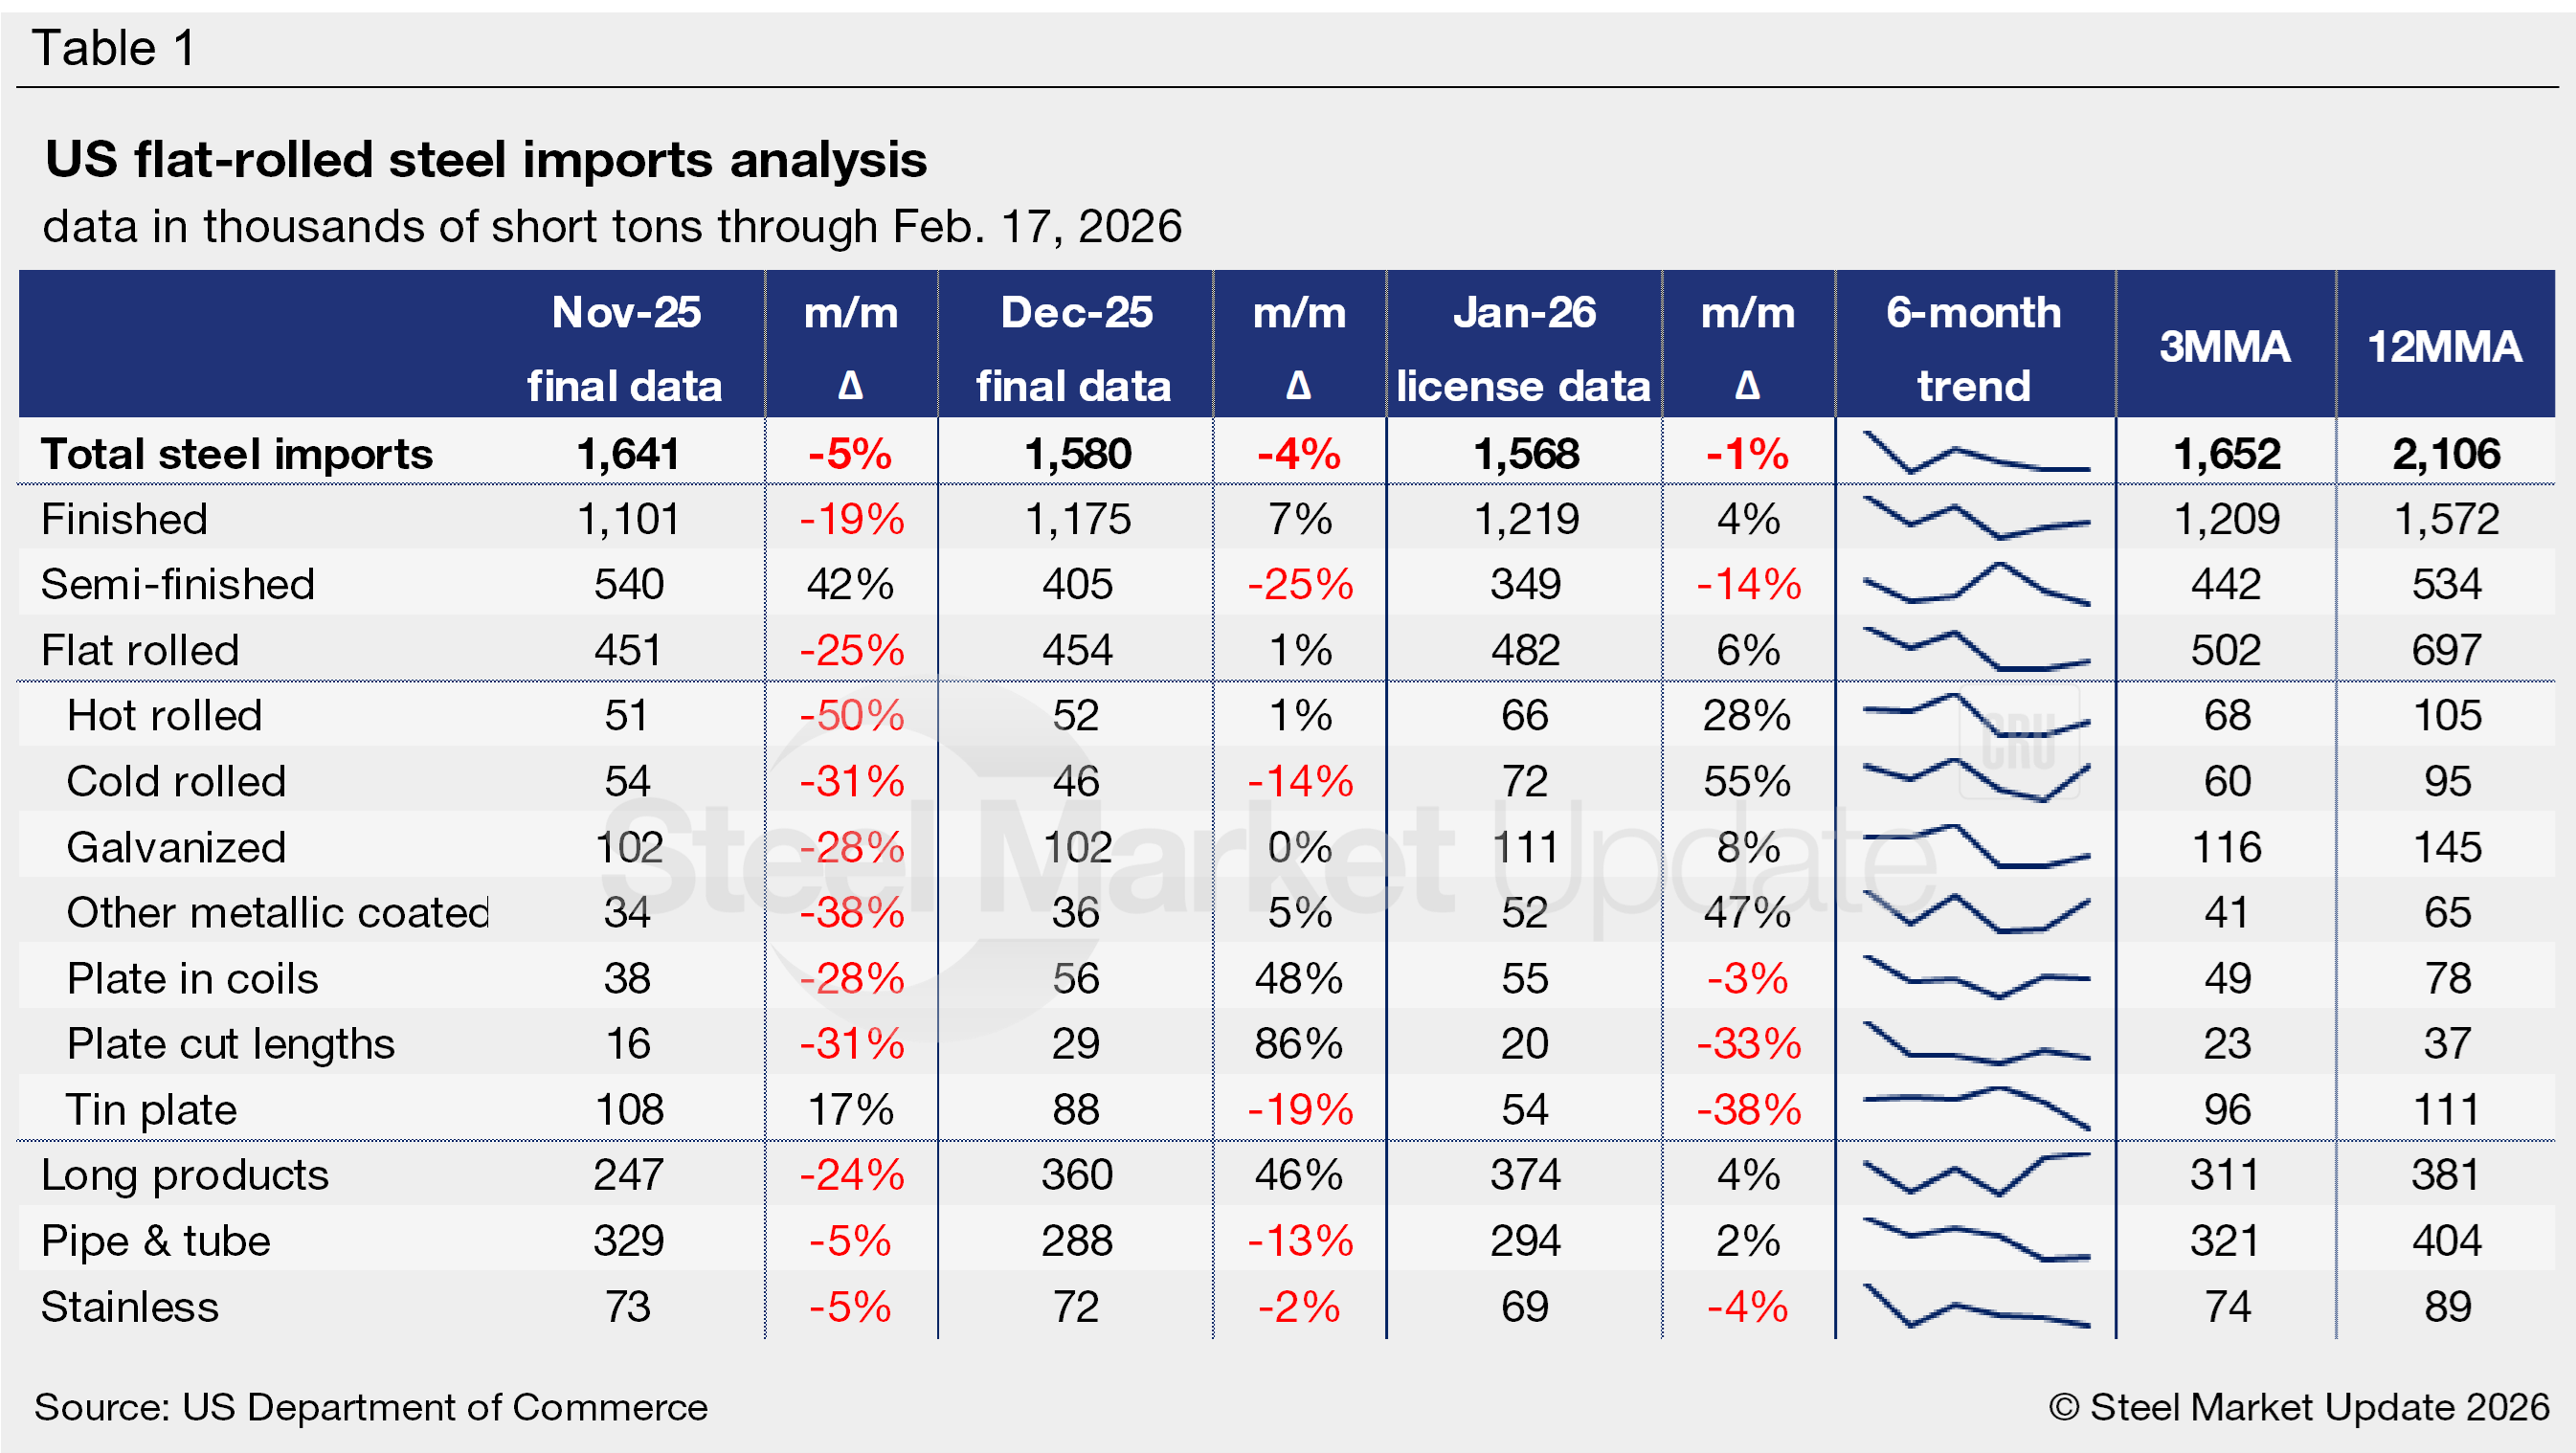
Table 1 highlights high-volume steel product imports (click to expand). Note that the 3MMA and 12MMA columns are calculated through final December data and do not include January or licenses. For deeper analysis, visit our Steel Imports page.
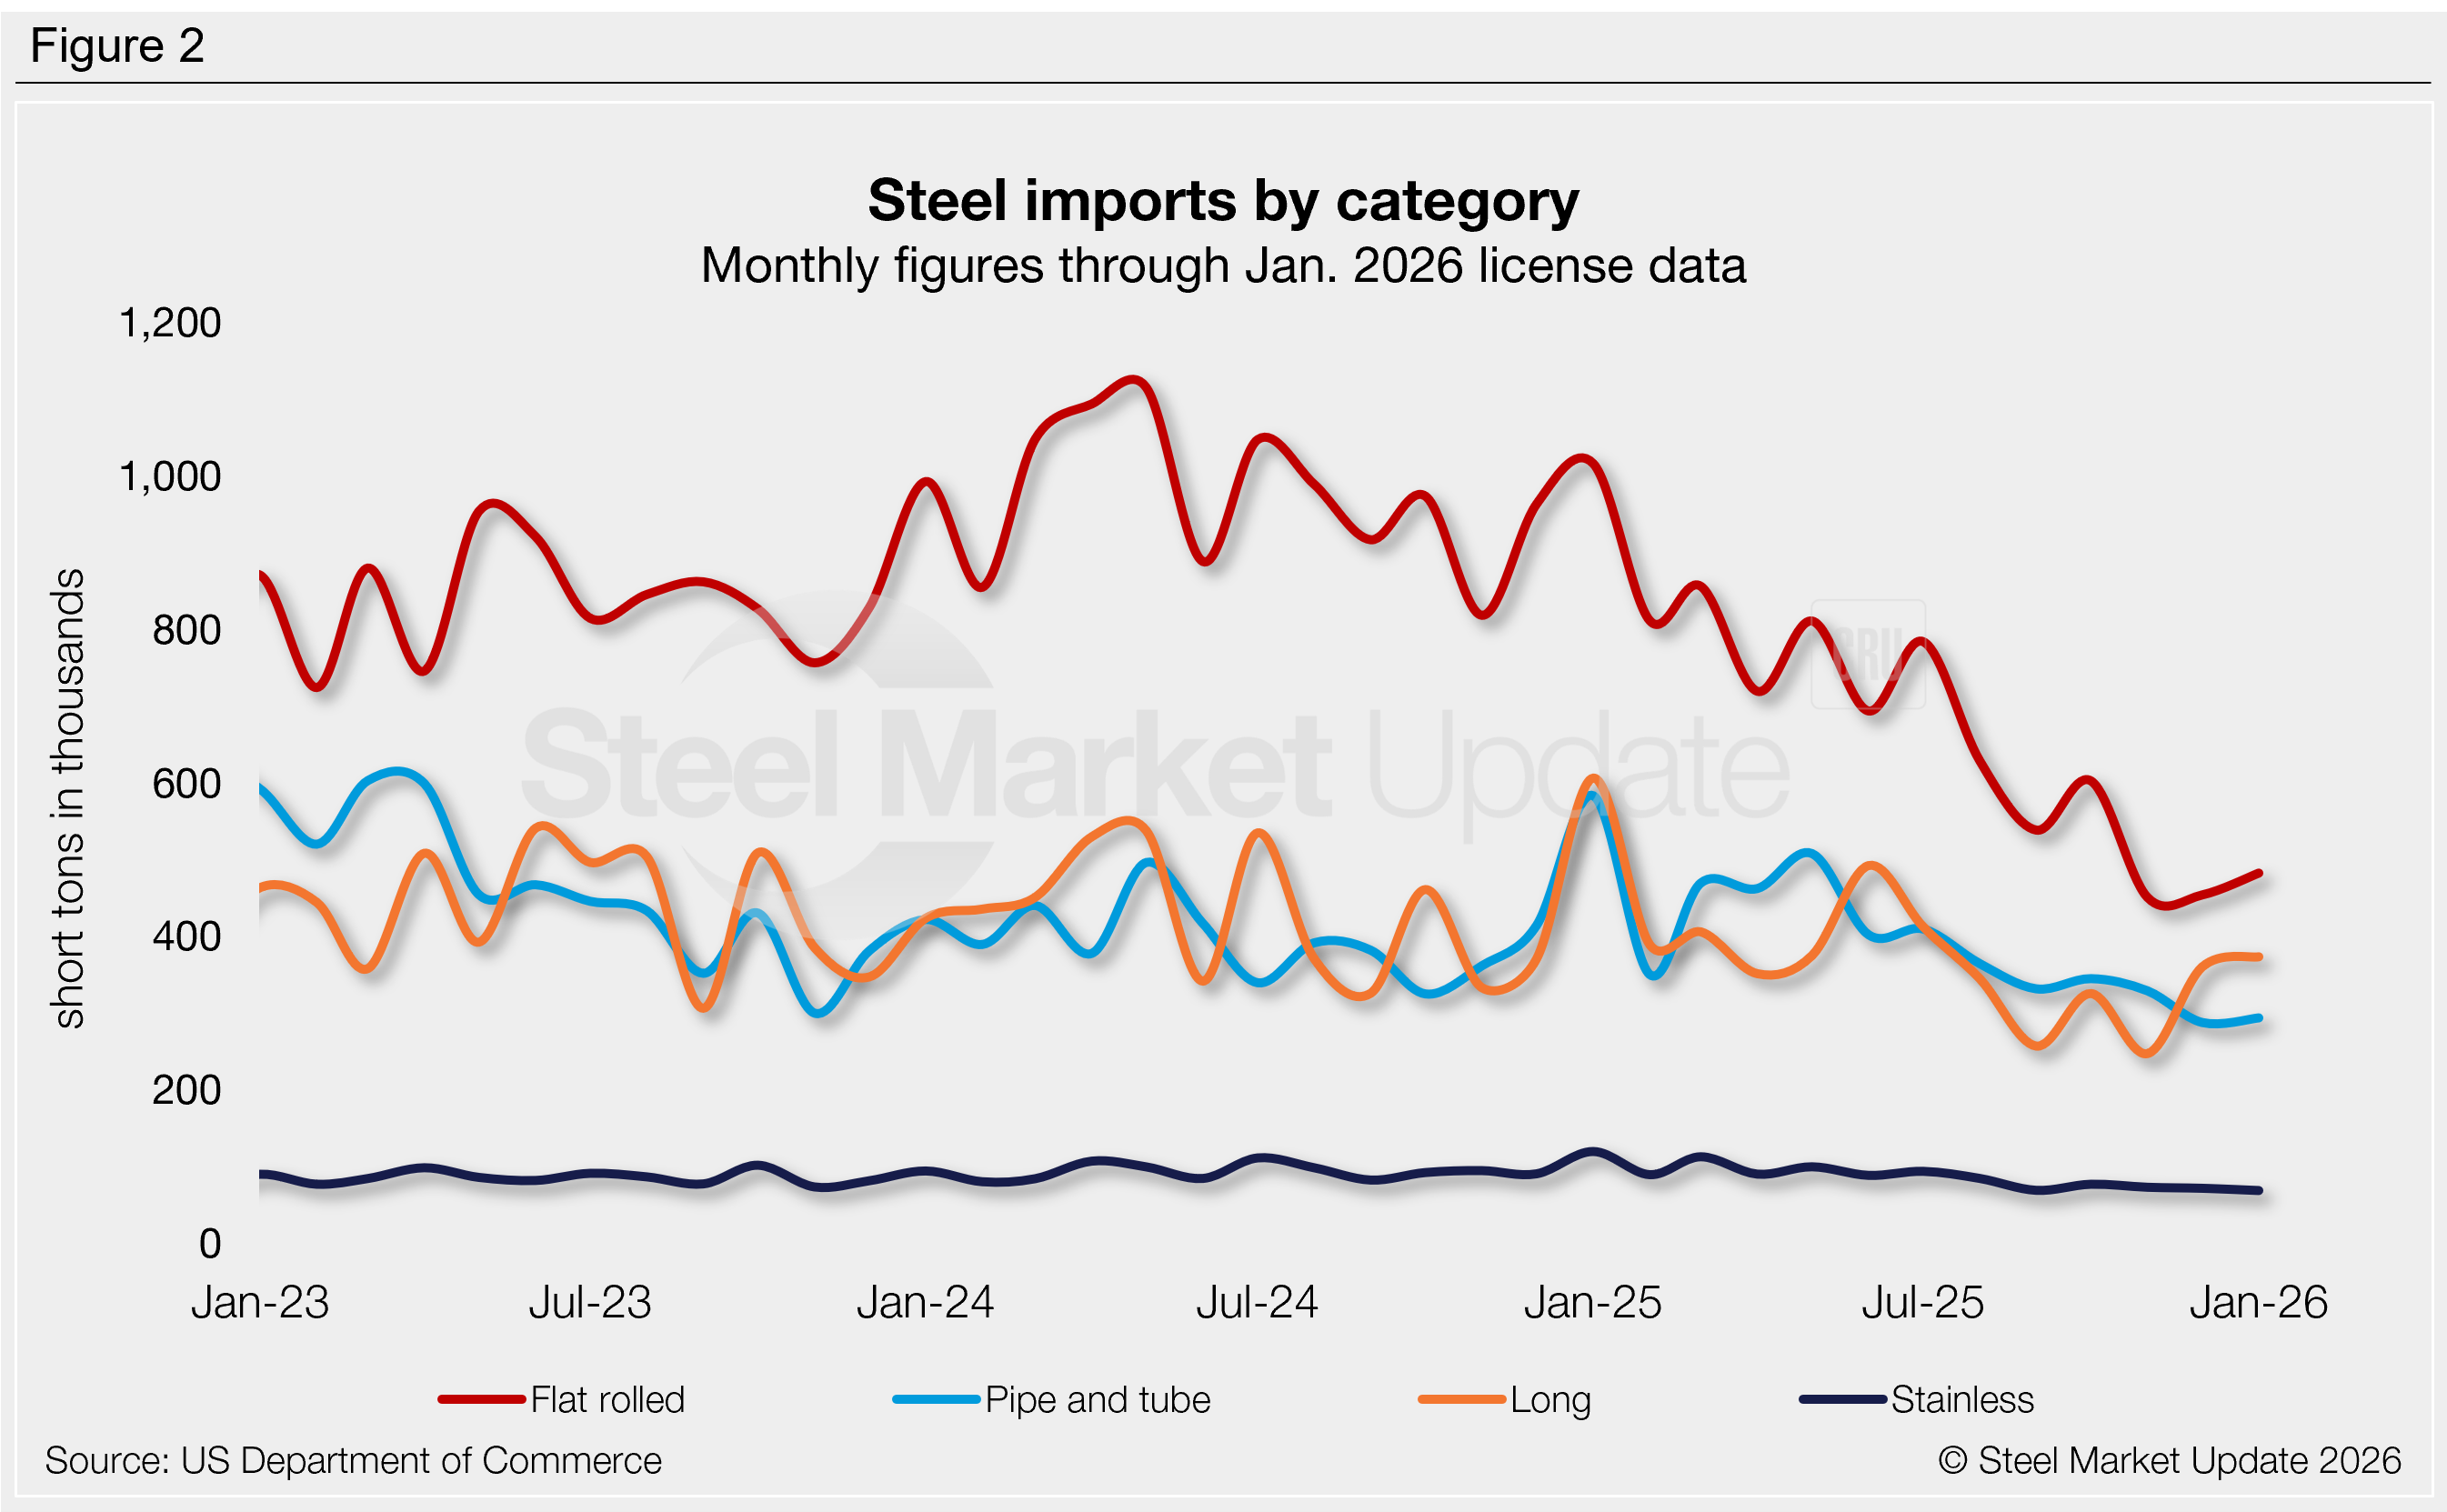
Imports by category
Figure 2 shows monthly imports of popular steel product categories. Notable shifts include:
- Flat-rolled imports remained historically weak through December, just 1% higher than November’s multi-year low (the lowest seen in our limited seven-year data history). January licenses currently show a 6% recovery.
- Imports of long products rebounded 46% in December to a five-month high, previously at the lowest rate recorded in our seven-year data history. January license data is up another 4%.
- Pipe and tube imports slipped 13% m/m in December to the lowest monthly rate seen since early 2021, with January licenses up just 2%.
- Imports of stainless products declined 2% m/m December to a three-month low. January licenses show another 4% decrease, potentially falling to a near-five-year low.
Sheet and plate products
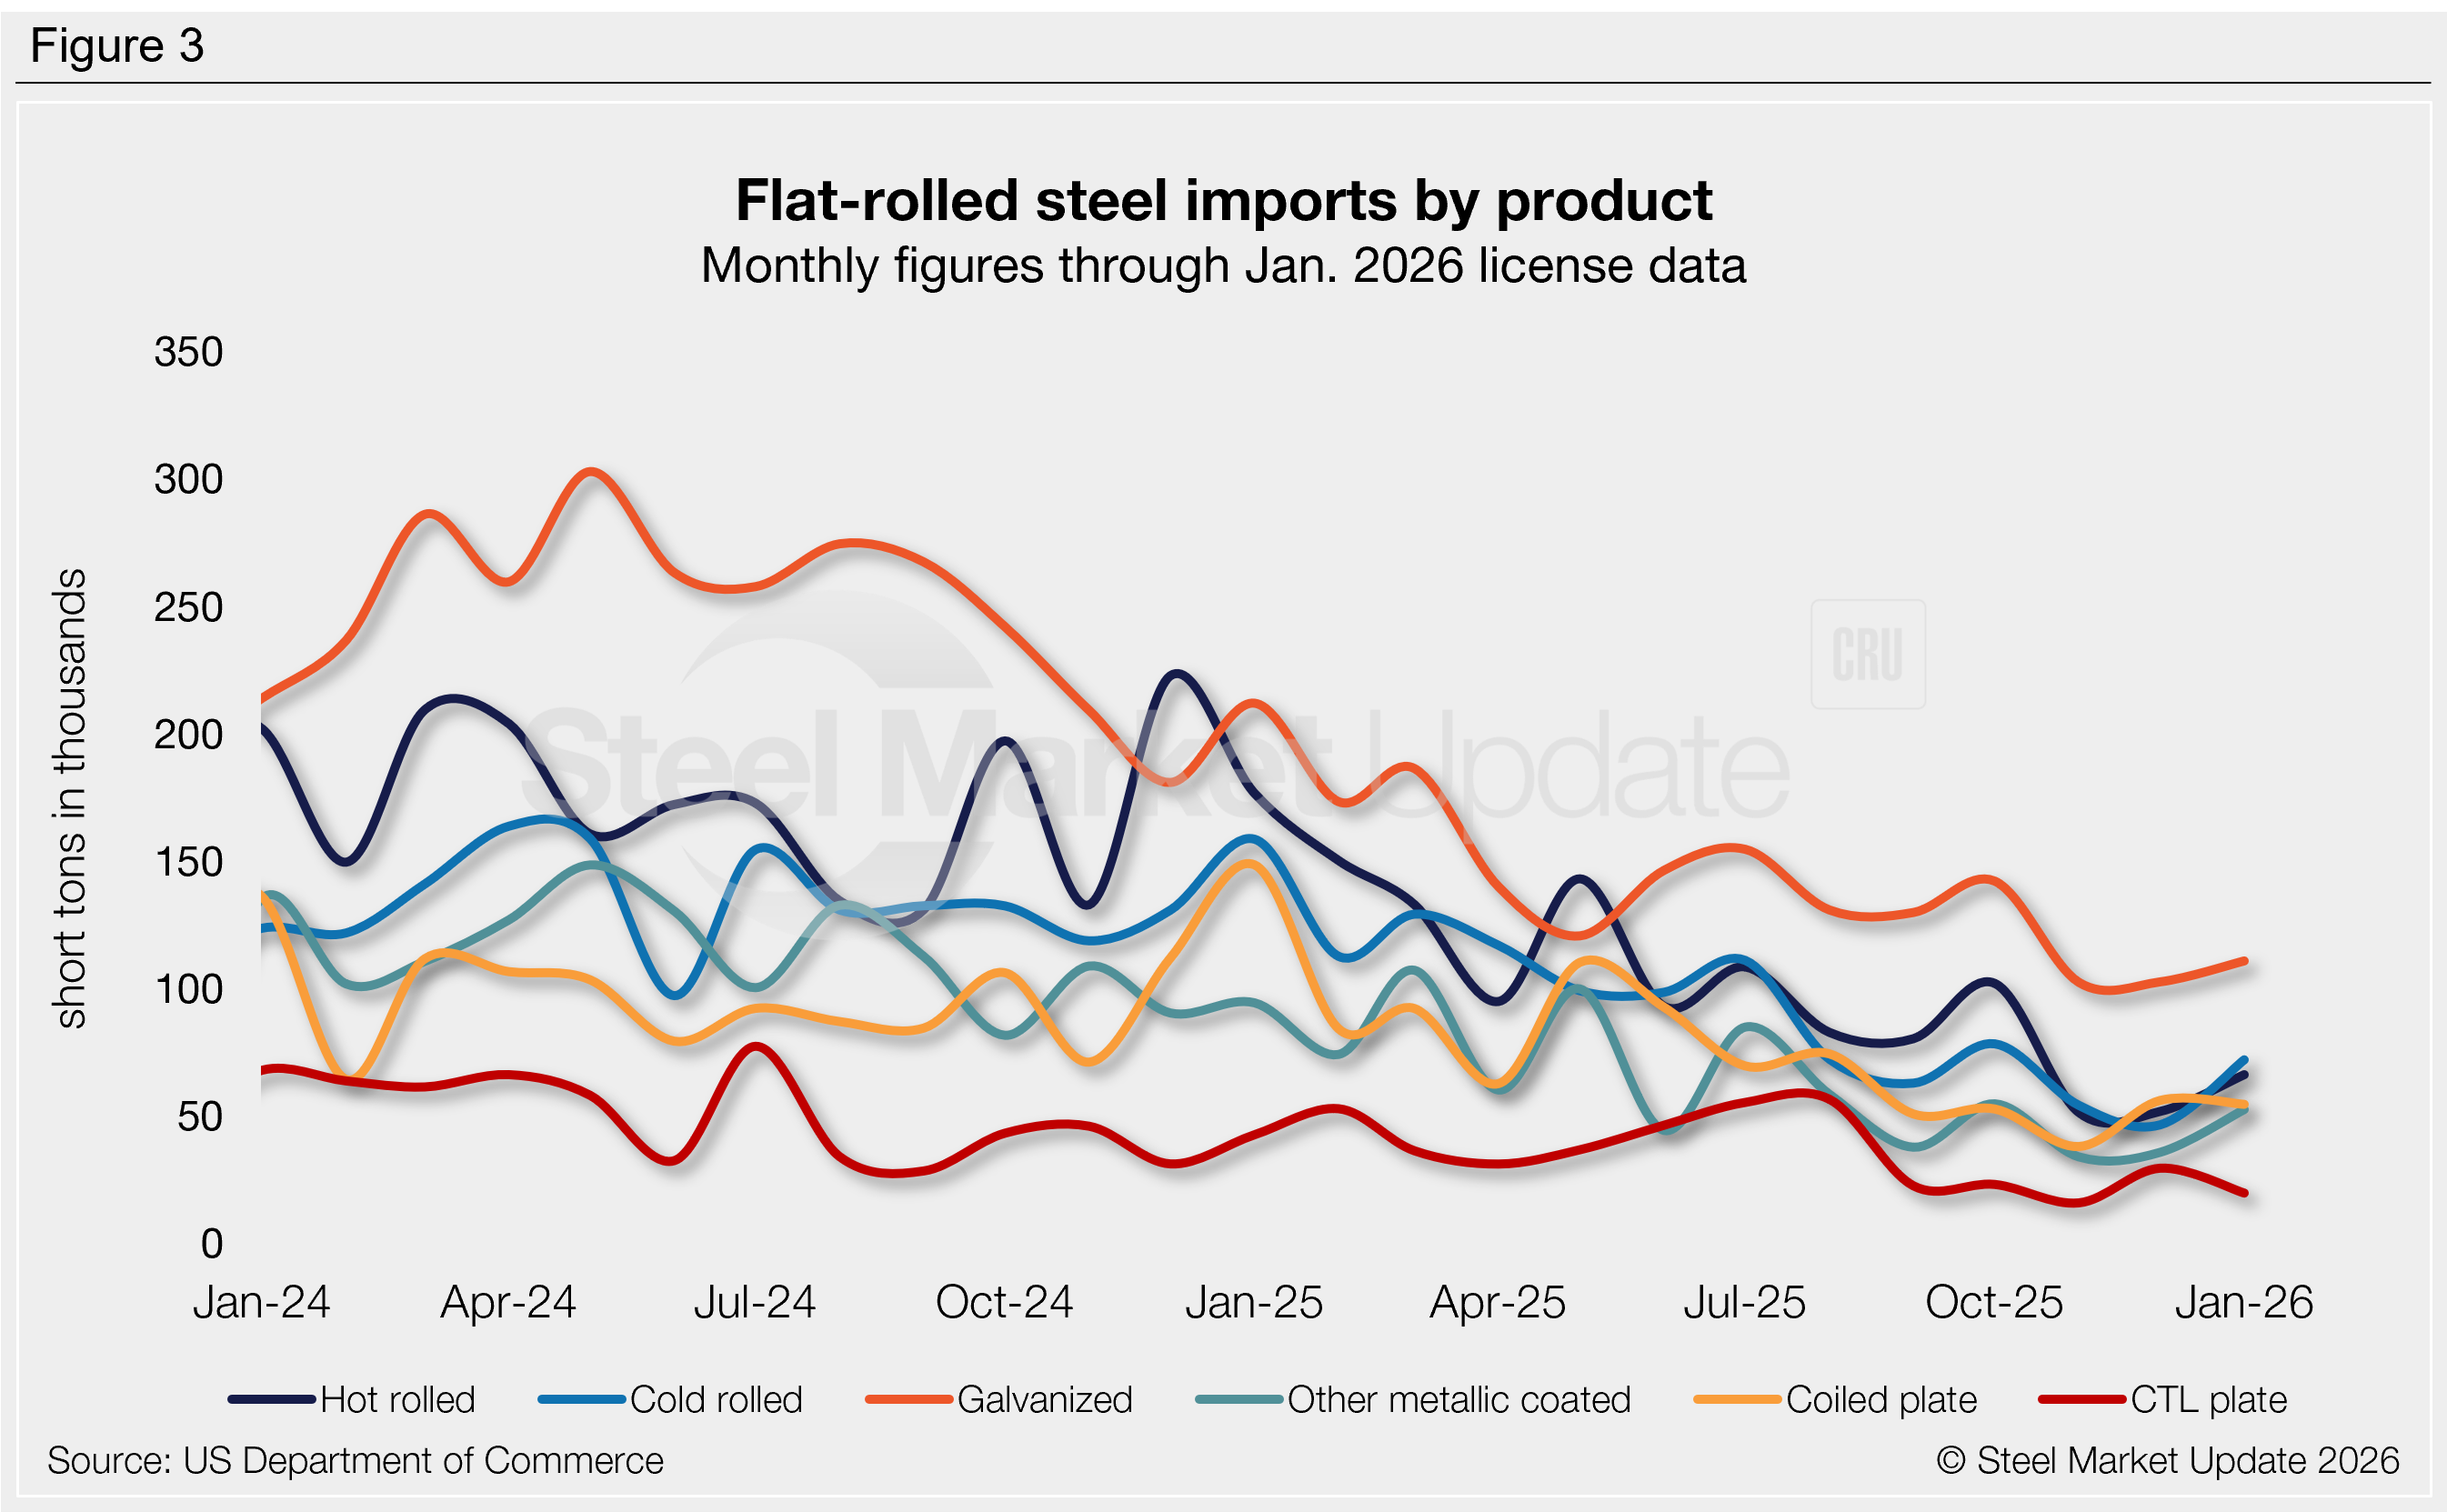
Figure 3 tracks flat-rolled imports for six popular sheet products. Many products saw improving trade levels in December and January following the multi-year lows set in November. Key highlights:
- Hot-rolled coil imports inched up in December, just 1% above November’s low (the lowest rate seen in our 28-year data history). January licenses show a potential 28% recovery.
- Imports of cold-rolled coil fell 14% m/m in December to the lowest rate recorded since 2009. Licenses are currently back up 55% in January.
- Galvanized imports held at a near 15-year low in December, with January licenses rising 8% m/m.
- Other-metallic coated (mostly Galvalume) imports rebounded 5% m/m in December following November’s near-six-year low. January licenses are potentially up 47%.
- Imports of coiled plate jumped 48% m/m in December, shifting from a 16-year low to a four-month high. January licenses currently show a 3% decline.
- Cut-to-length (CTL) plate imports surged 86% m/m in December, recovering from the lowest rate seen in our 28-year data history to a four-month high. January licenses are potentially back down 33%.