Analysis
June 23, 2026
Global steel production recovers 3% in May
Written by David Schollaert
Total raw steel produced around the globe rebounded 3% in May to an estimated 157.9 million metric tons (mt), according to the World Steel Association (worldsteel). May production was also about 8 million mt above last year’s average monthly rate, but weak compared with previous years.
On a 12-month moving average (12MMA) basis, annual production has averaged 148.8 million mt per month across the past year. This is the lowest rate recorded since November 2018, down 2.4% from the same period one year prior (Figure 1). Before last September, annual output had generally hovered between 152 million mt and 154 million mt for over three years, similar to pre-pandemic levels.
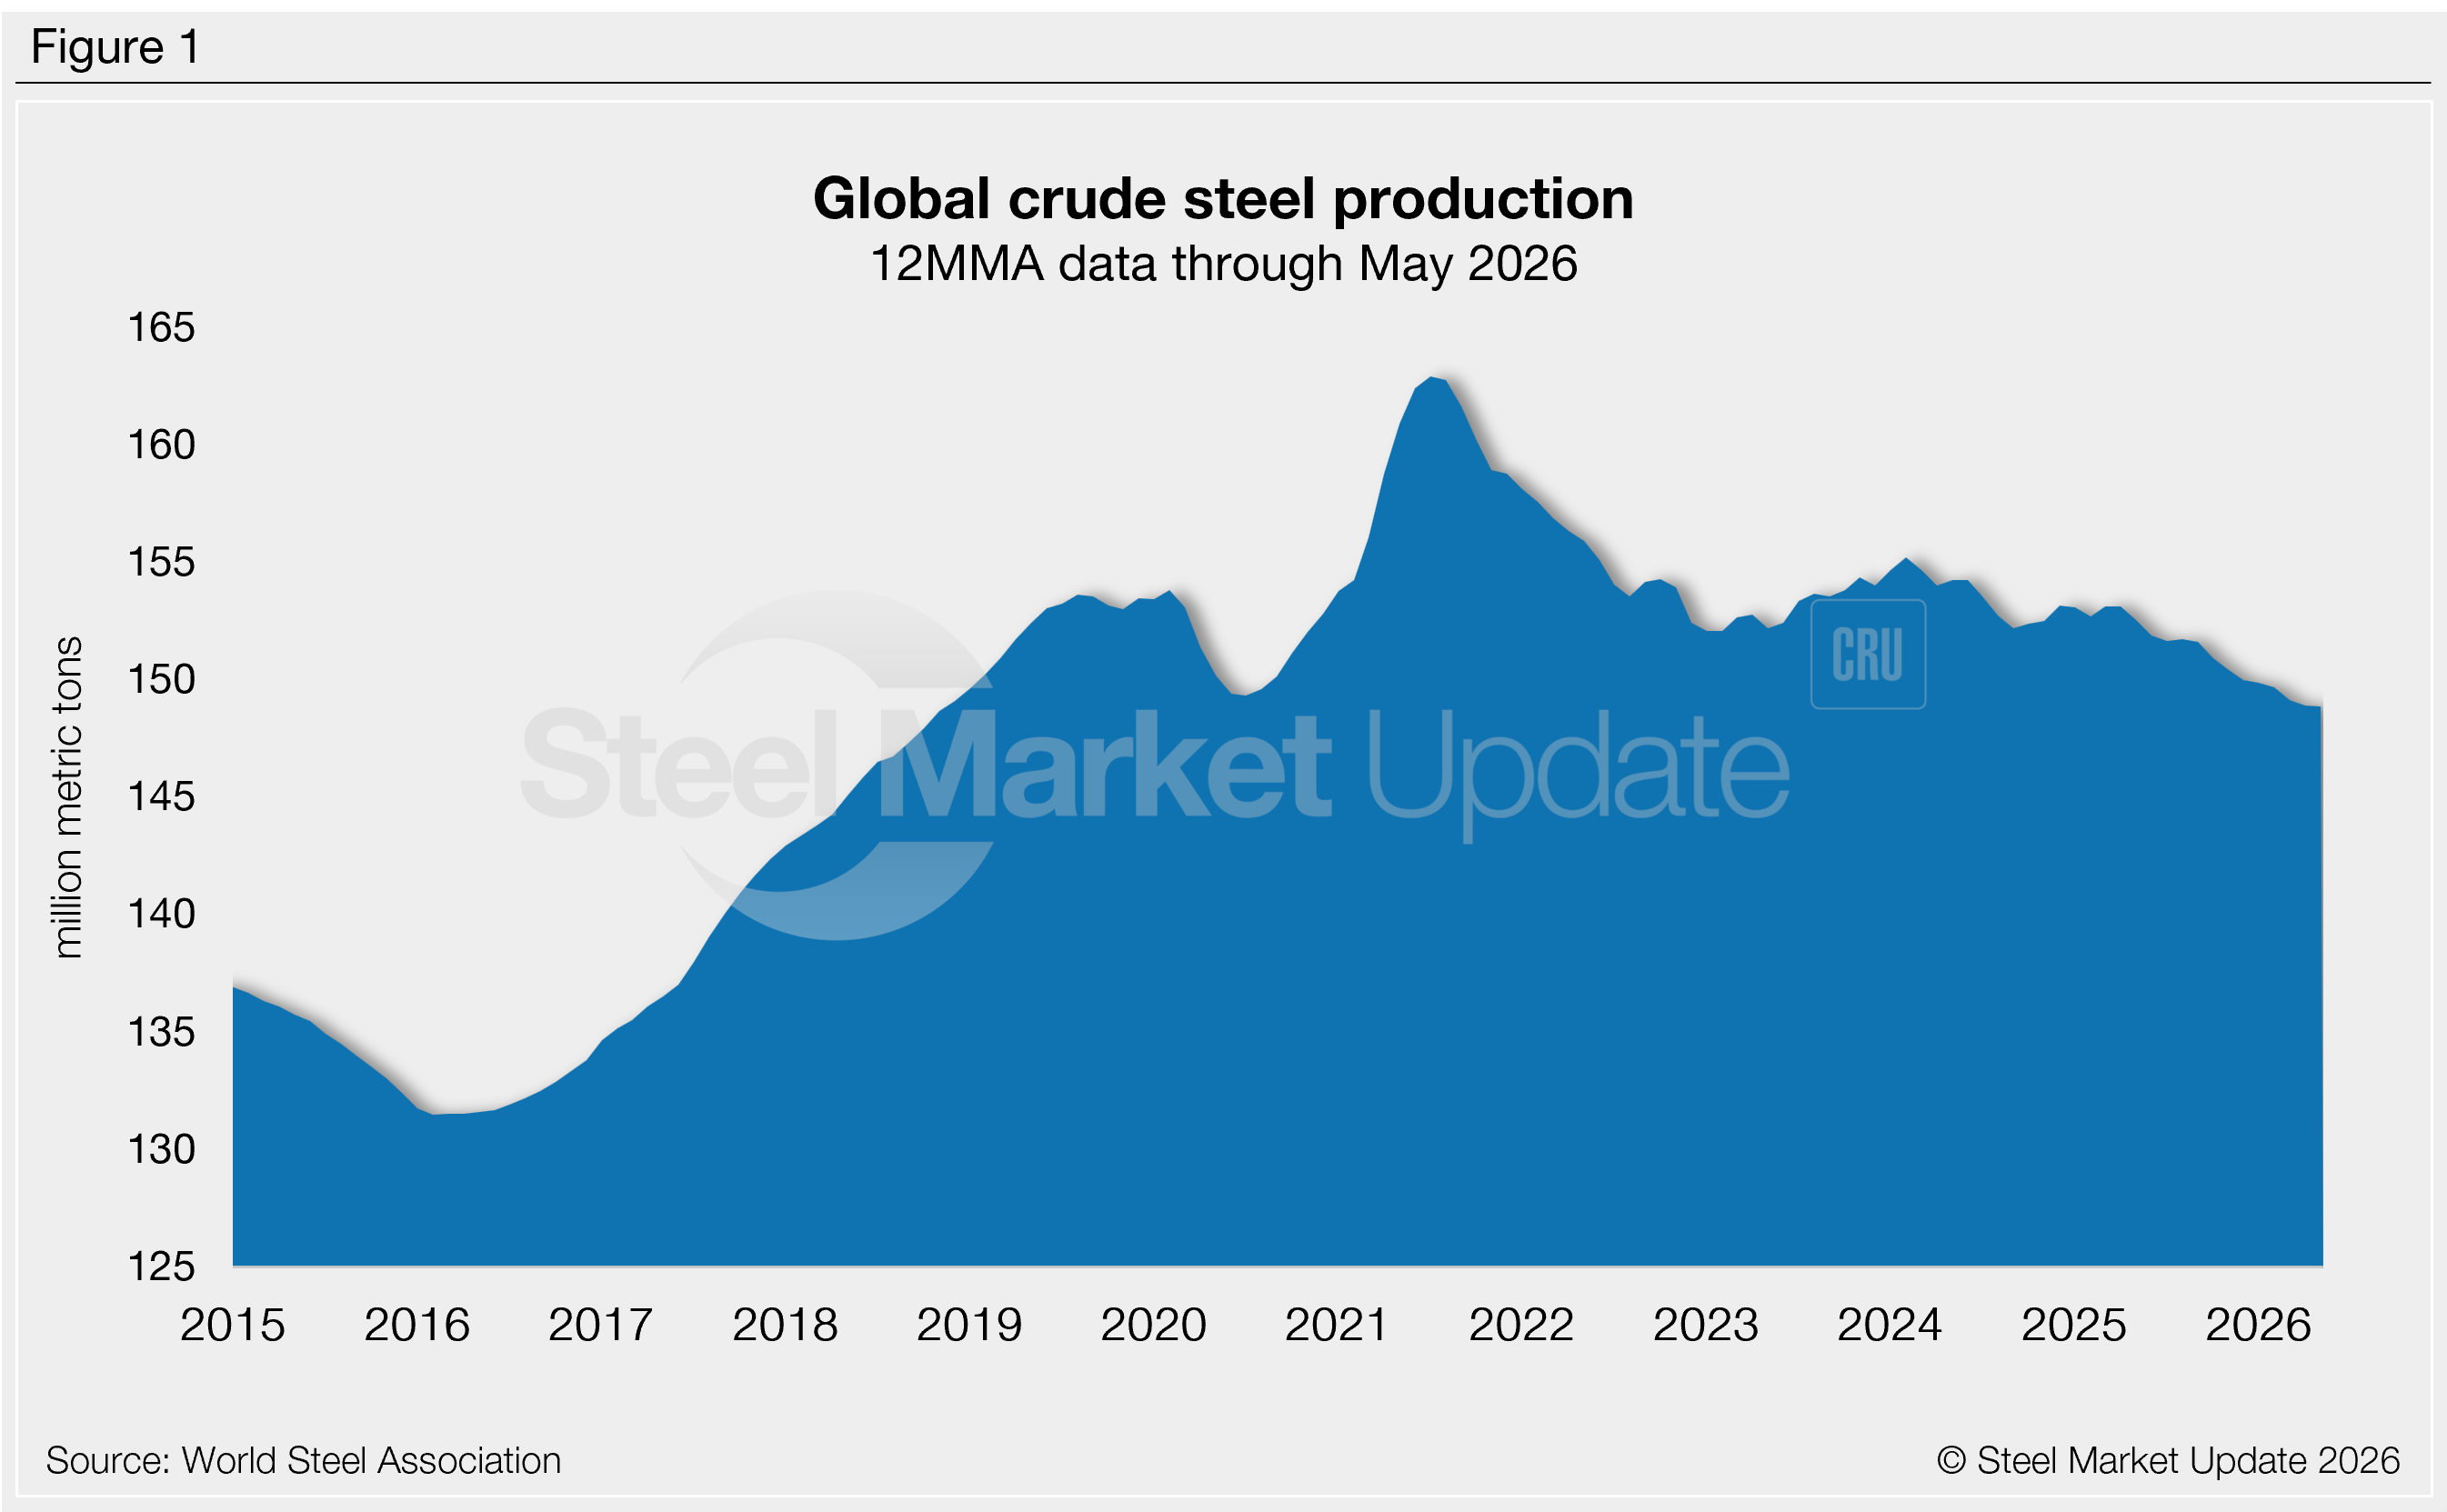
May’s daily production rate was 5.09 million mt per day, down 0.4% from April’s 5.11 million mt, and even further behind the 11-month high of 5.18 million mt seen in March.
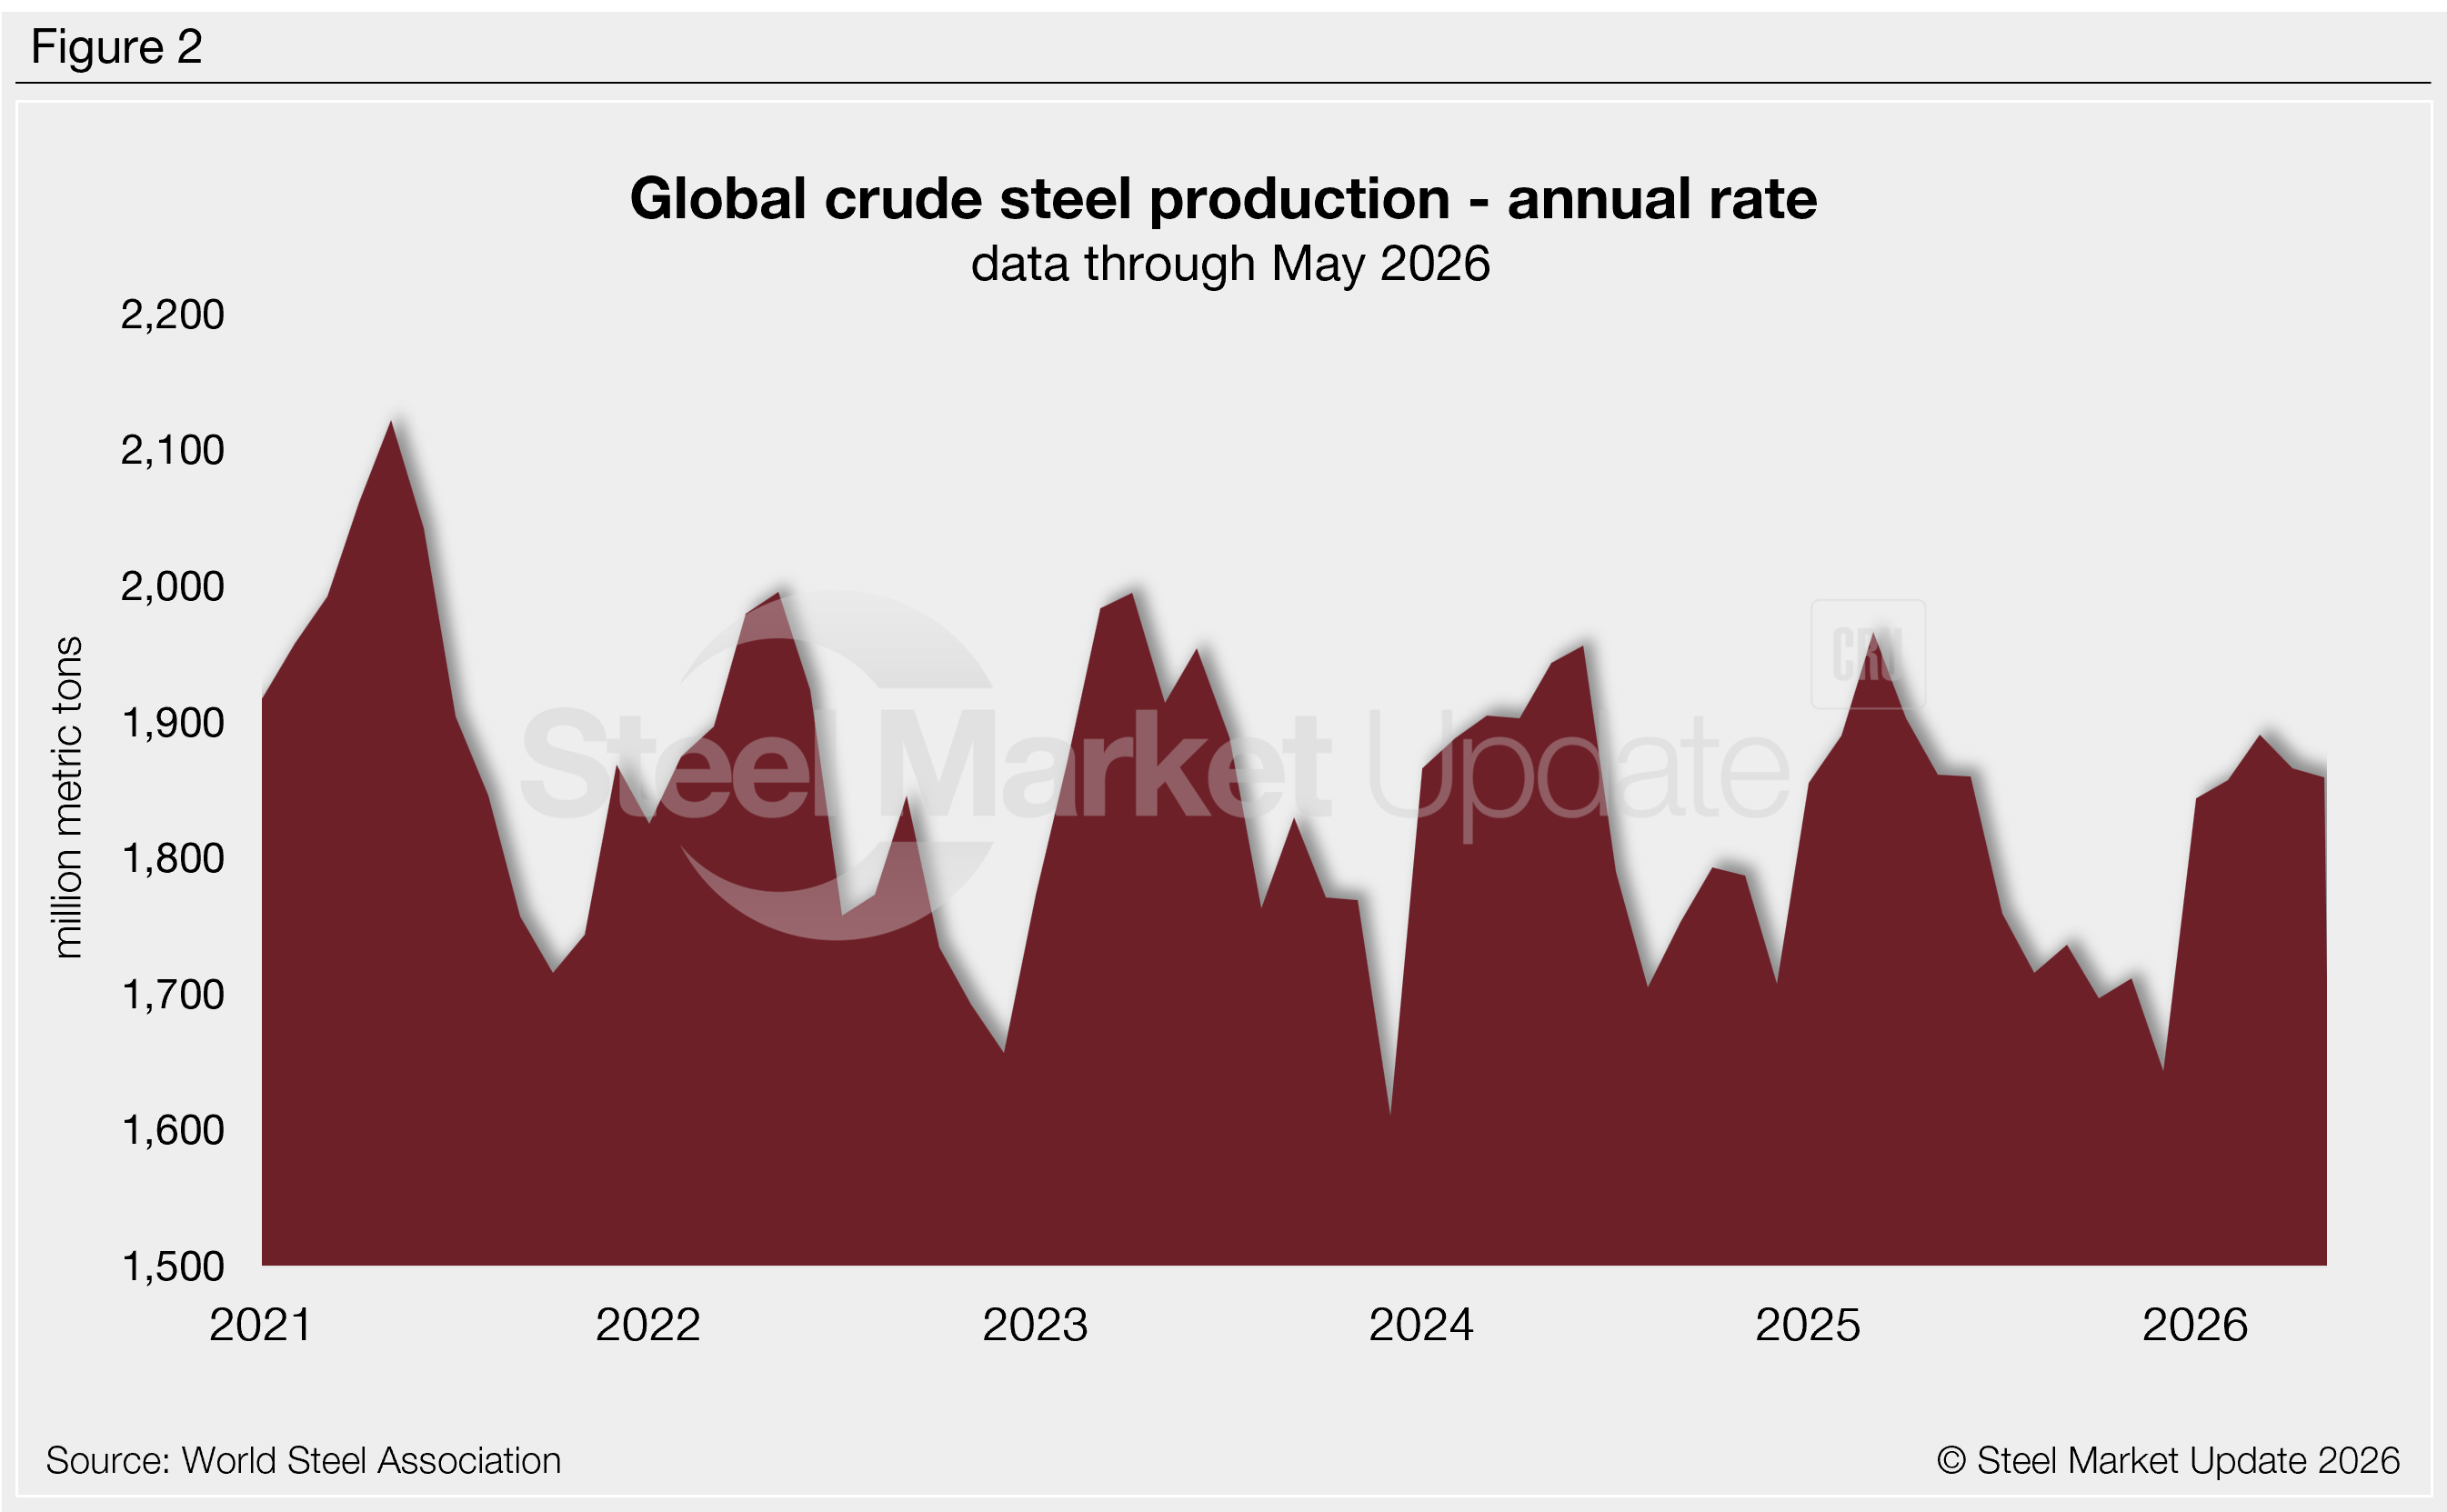
In the last year, daily production has fallen as low as 4.50 million mt (December). At May’s rate, annualized global production would total ~1.86 billion mt (Figure 2). Compared with the same month in previous years, this annualized production rate is 40% below 2025 levels and 7% below the 2023 and 2022 levels.
Seasonal trends show contraction
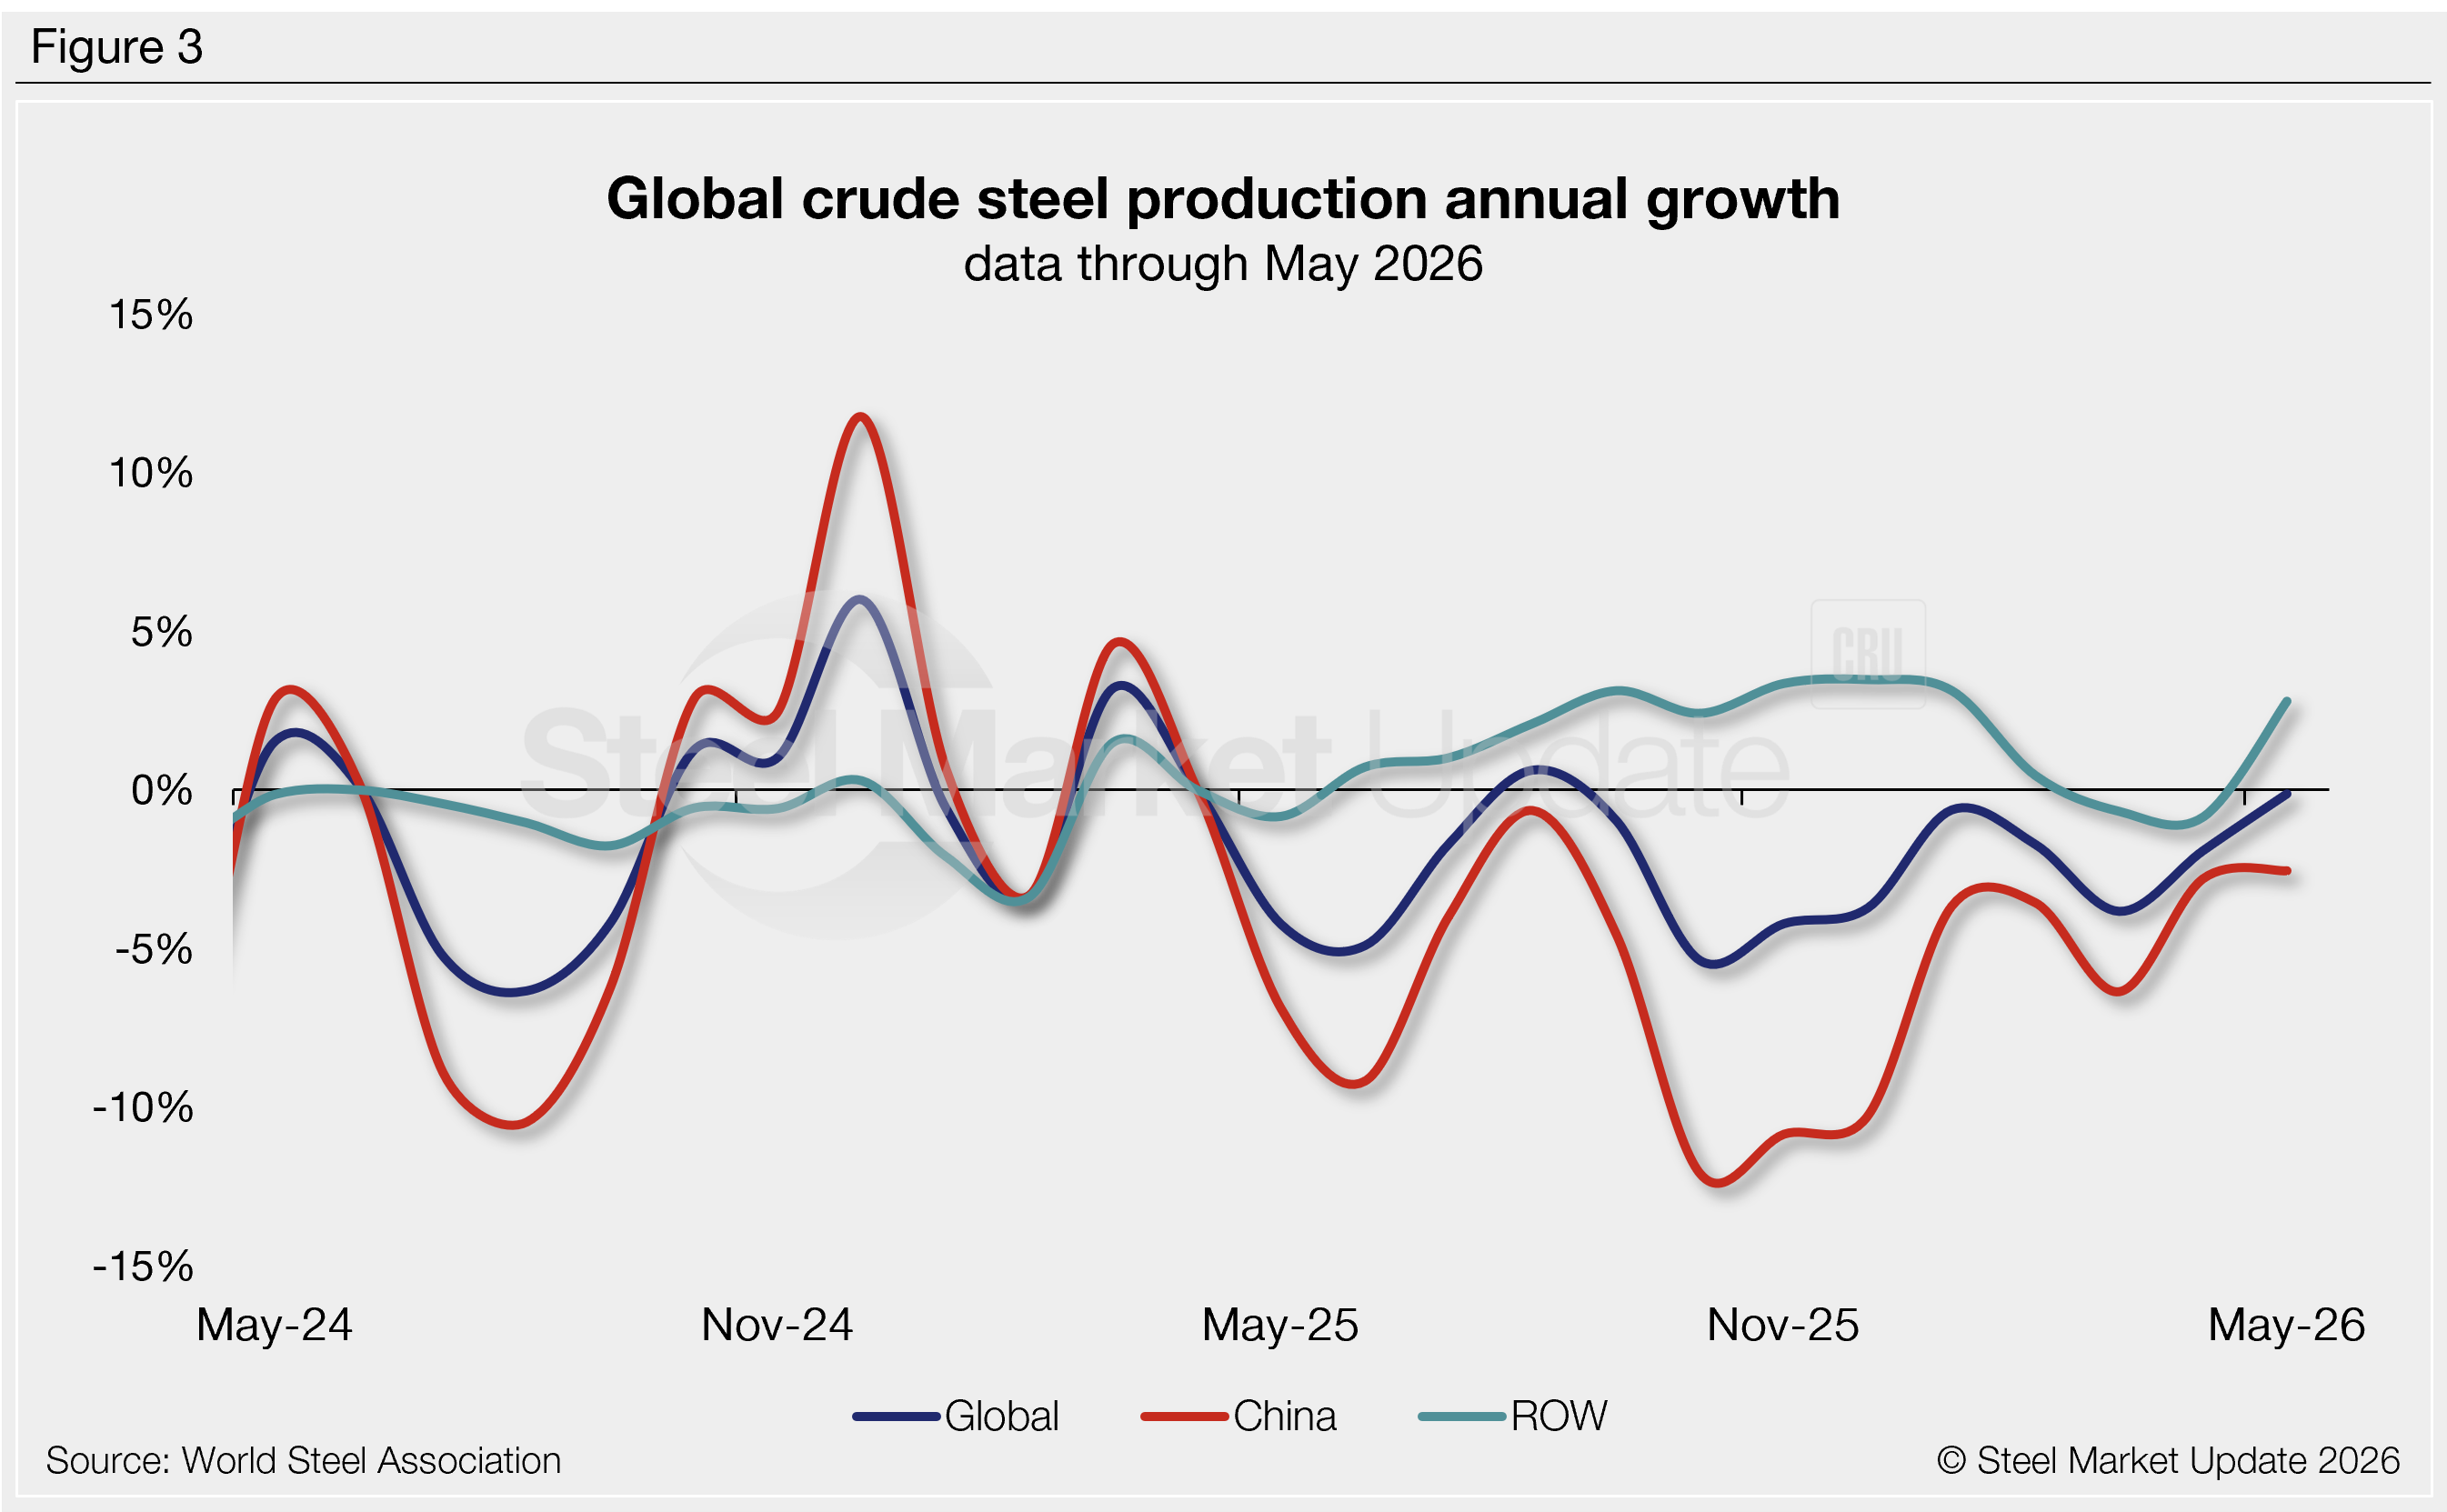
Steel production is highly seasonal, with output typically strongest in the spring months and weaker in the second half of the year. Annual comparisons can help see past seasonal variations. Figure 3 shows the year-over-year (y/y) growth rates for total global production, as well as for China and the rest of the world (ROW).
May output was just 0.1% lower than the same month of 2025, and the ninth consecutive month to experience negative annual growth. Chinese output was down 2.5% y/y, marking 14 months of negative growth, while ROW production was up 5.3%.
China vs. rest of world
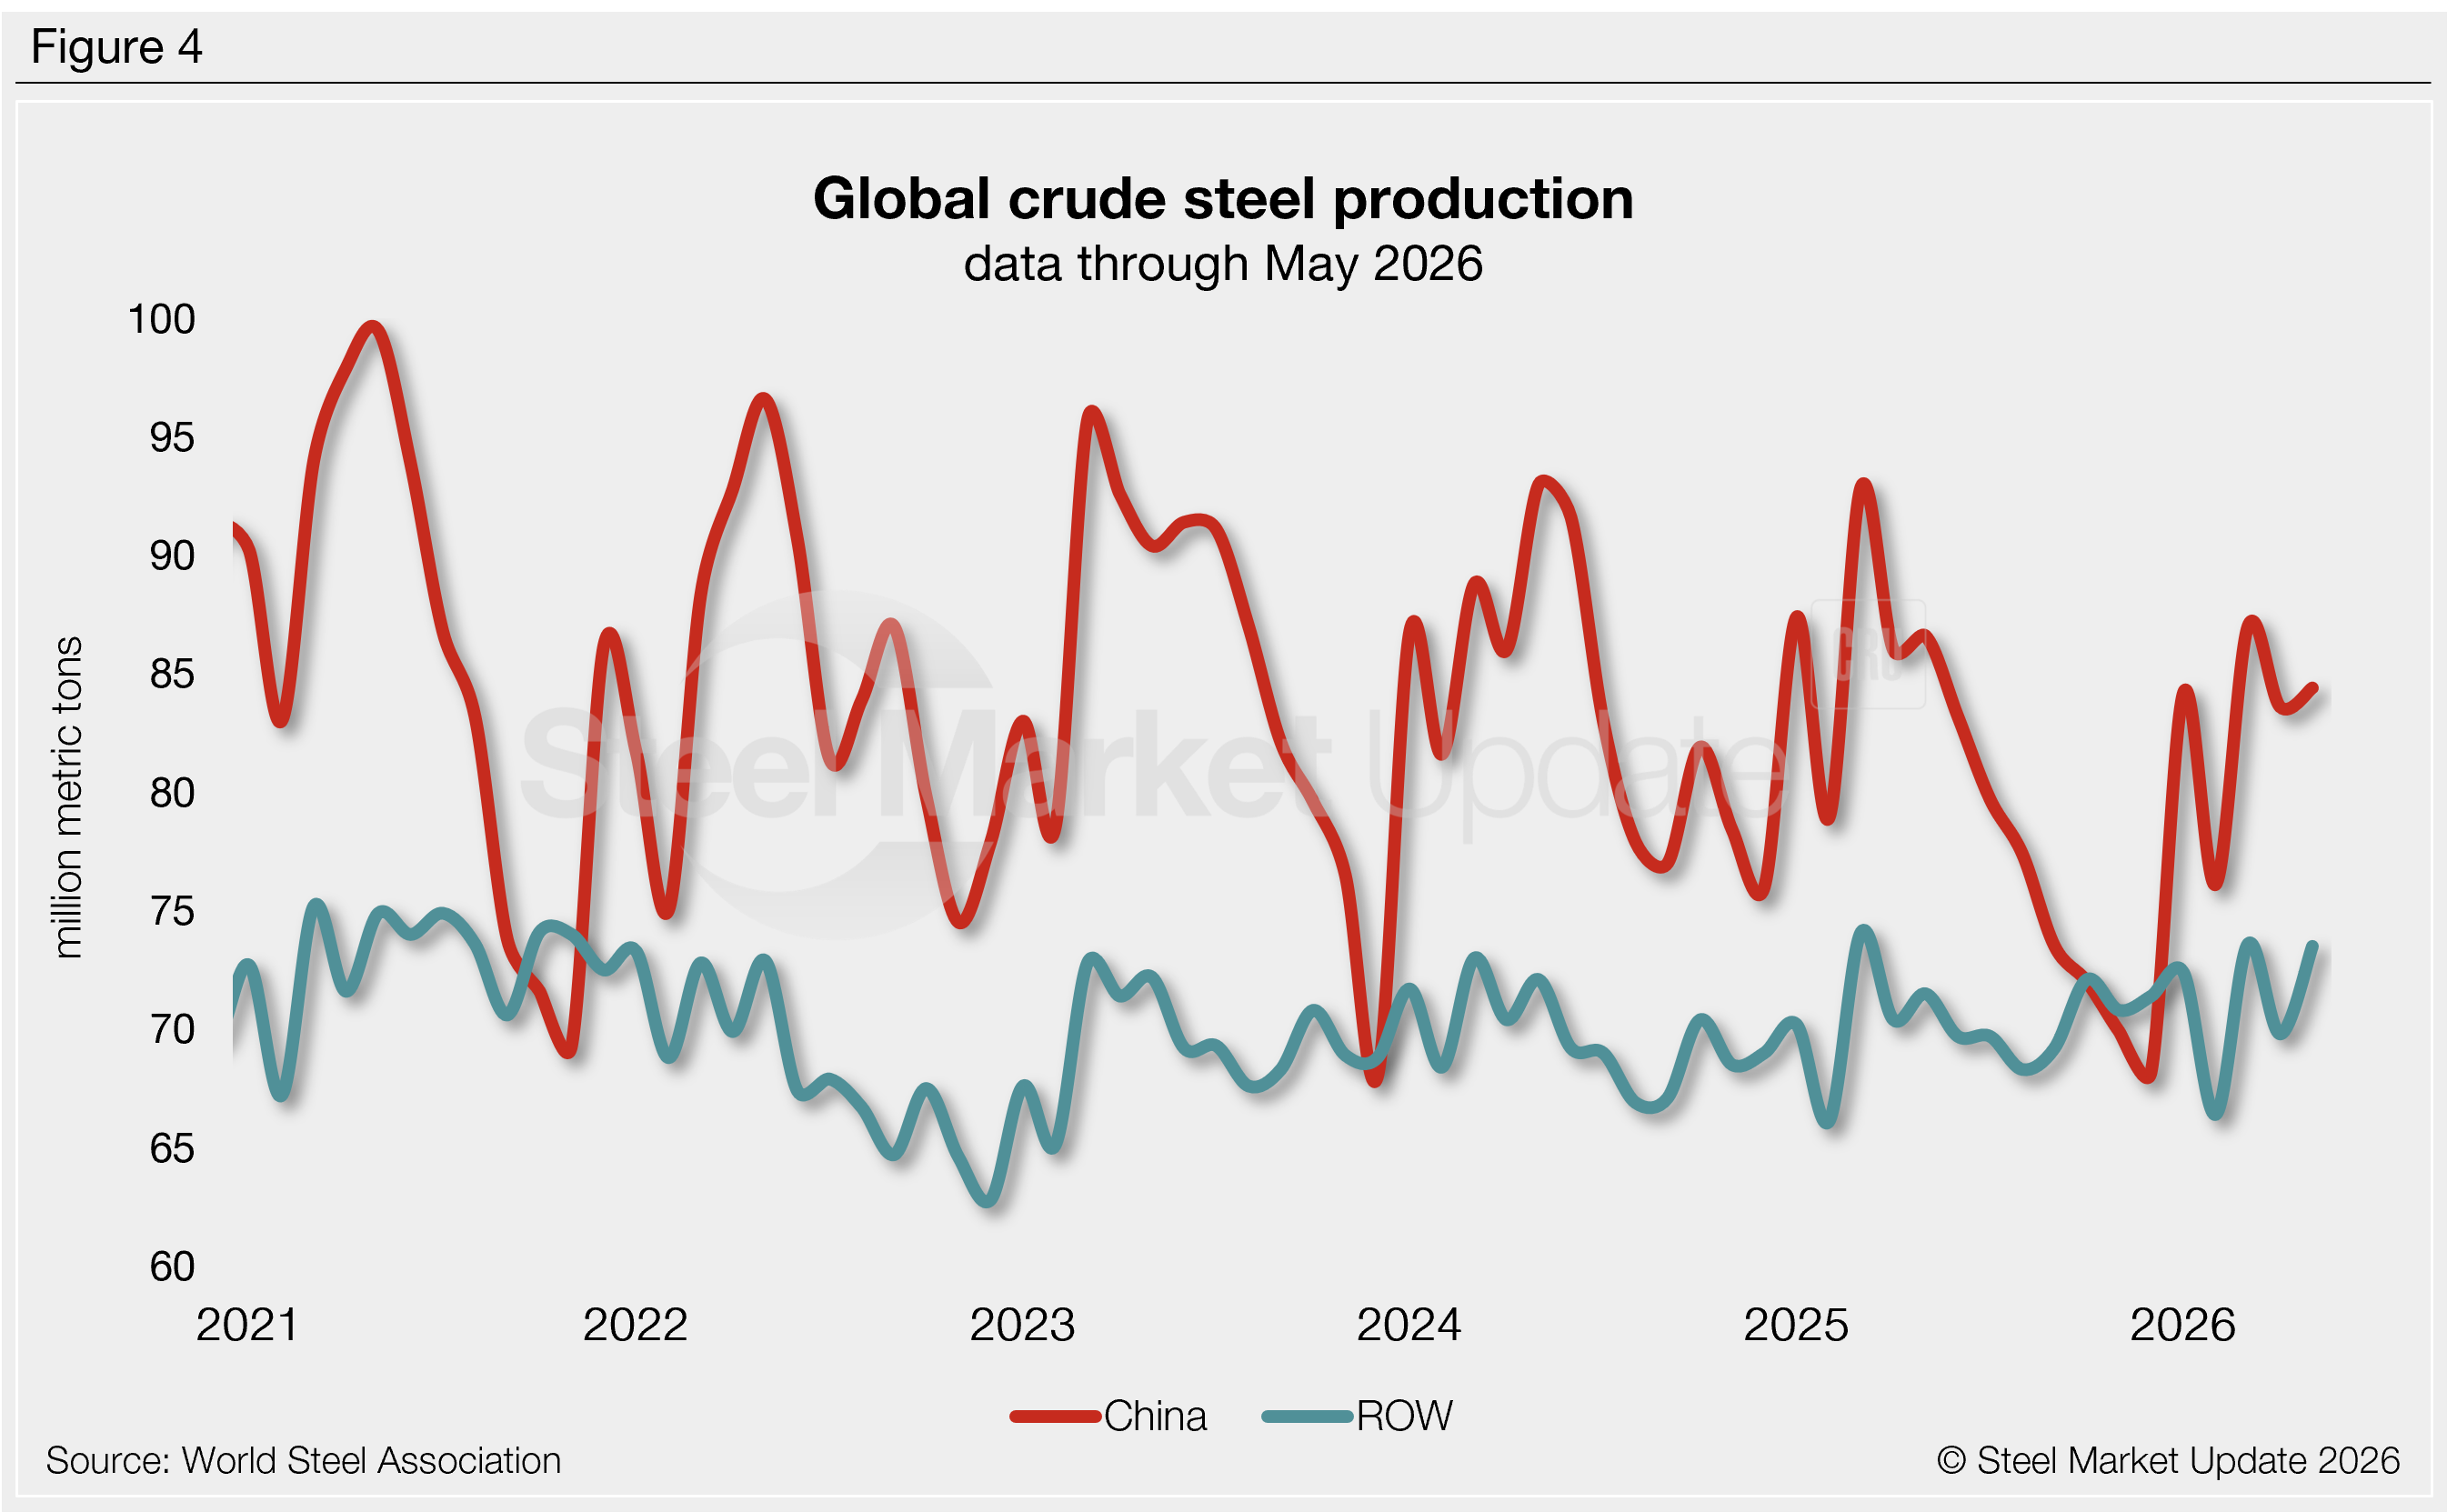
China accounted for 53% of global production in May with output of 84.4 million mt, up 1% from May 2025 (Figure 4). Chinese production has averaged 78.2 million mt per month in the past year. Since 2023, China has consistently accounted for 50-57% of total global output.
ROW steel output rose more than 5% m/m and just below the one-year high of 73.6 million mt set in March. May’s output totaled 73.5 million mt. ROW production has averaged 70.5 million mt per month across the last year.
Other top-producing countries
India maintained its position as the second-largest steel producer in May, accounting for 9% of global output. Other significant producers included the United States at 5%, Japan at 4%, South Korea and Russia at 3%, and Turkey, Germany, and Brazil at 2%.
Comparing year-to-date (YTD) output by country to the same period of 2025 reveals modest shifts in market share. In the first five months of 2026, Russian production was down 10% from the same period of 2025, and China was down 4%. Meanwhile, YTD output in India and Germany was up 8% and 9% y/y, respectively. The United States and Türkiye were up 7%.
Most notably, ahead of all, was Vietnam, with a 27% gain y/y on a YTD basis.