

Market Data
May 22, 2026
Global steel production eases 4% in April
Written by Brett Linton
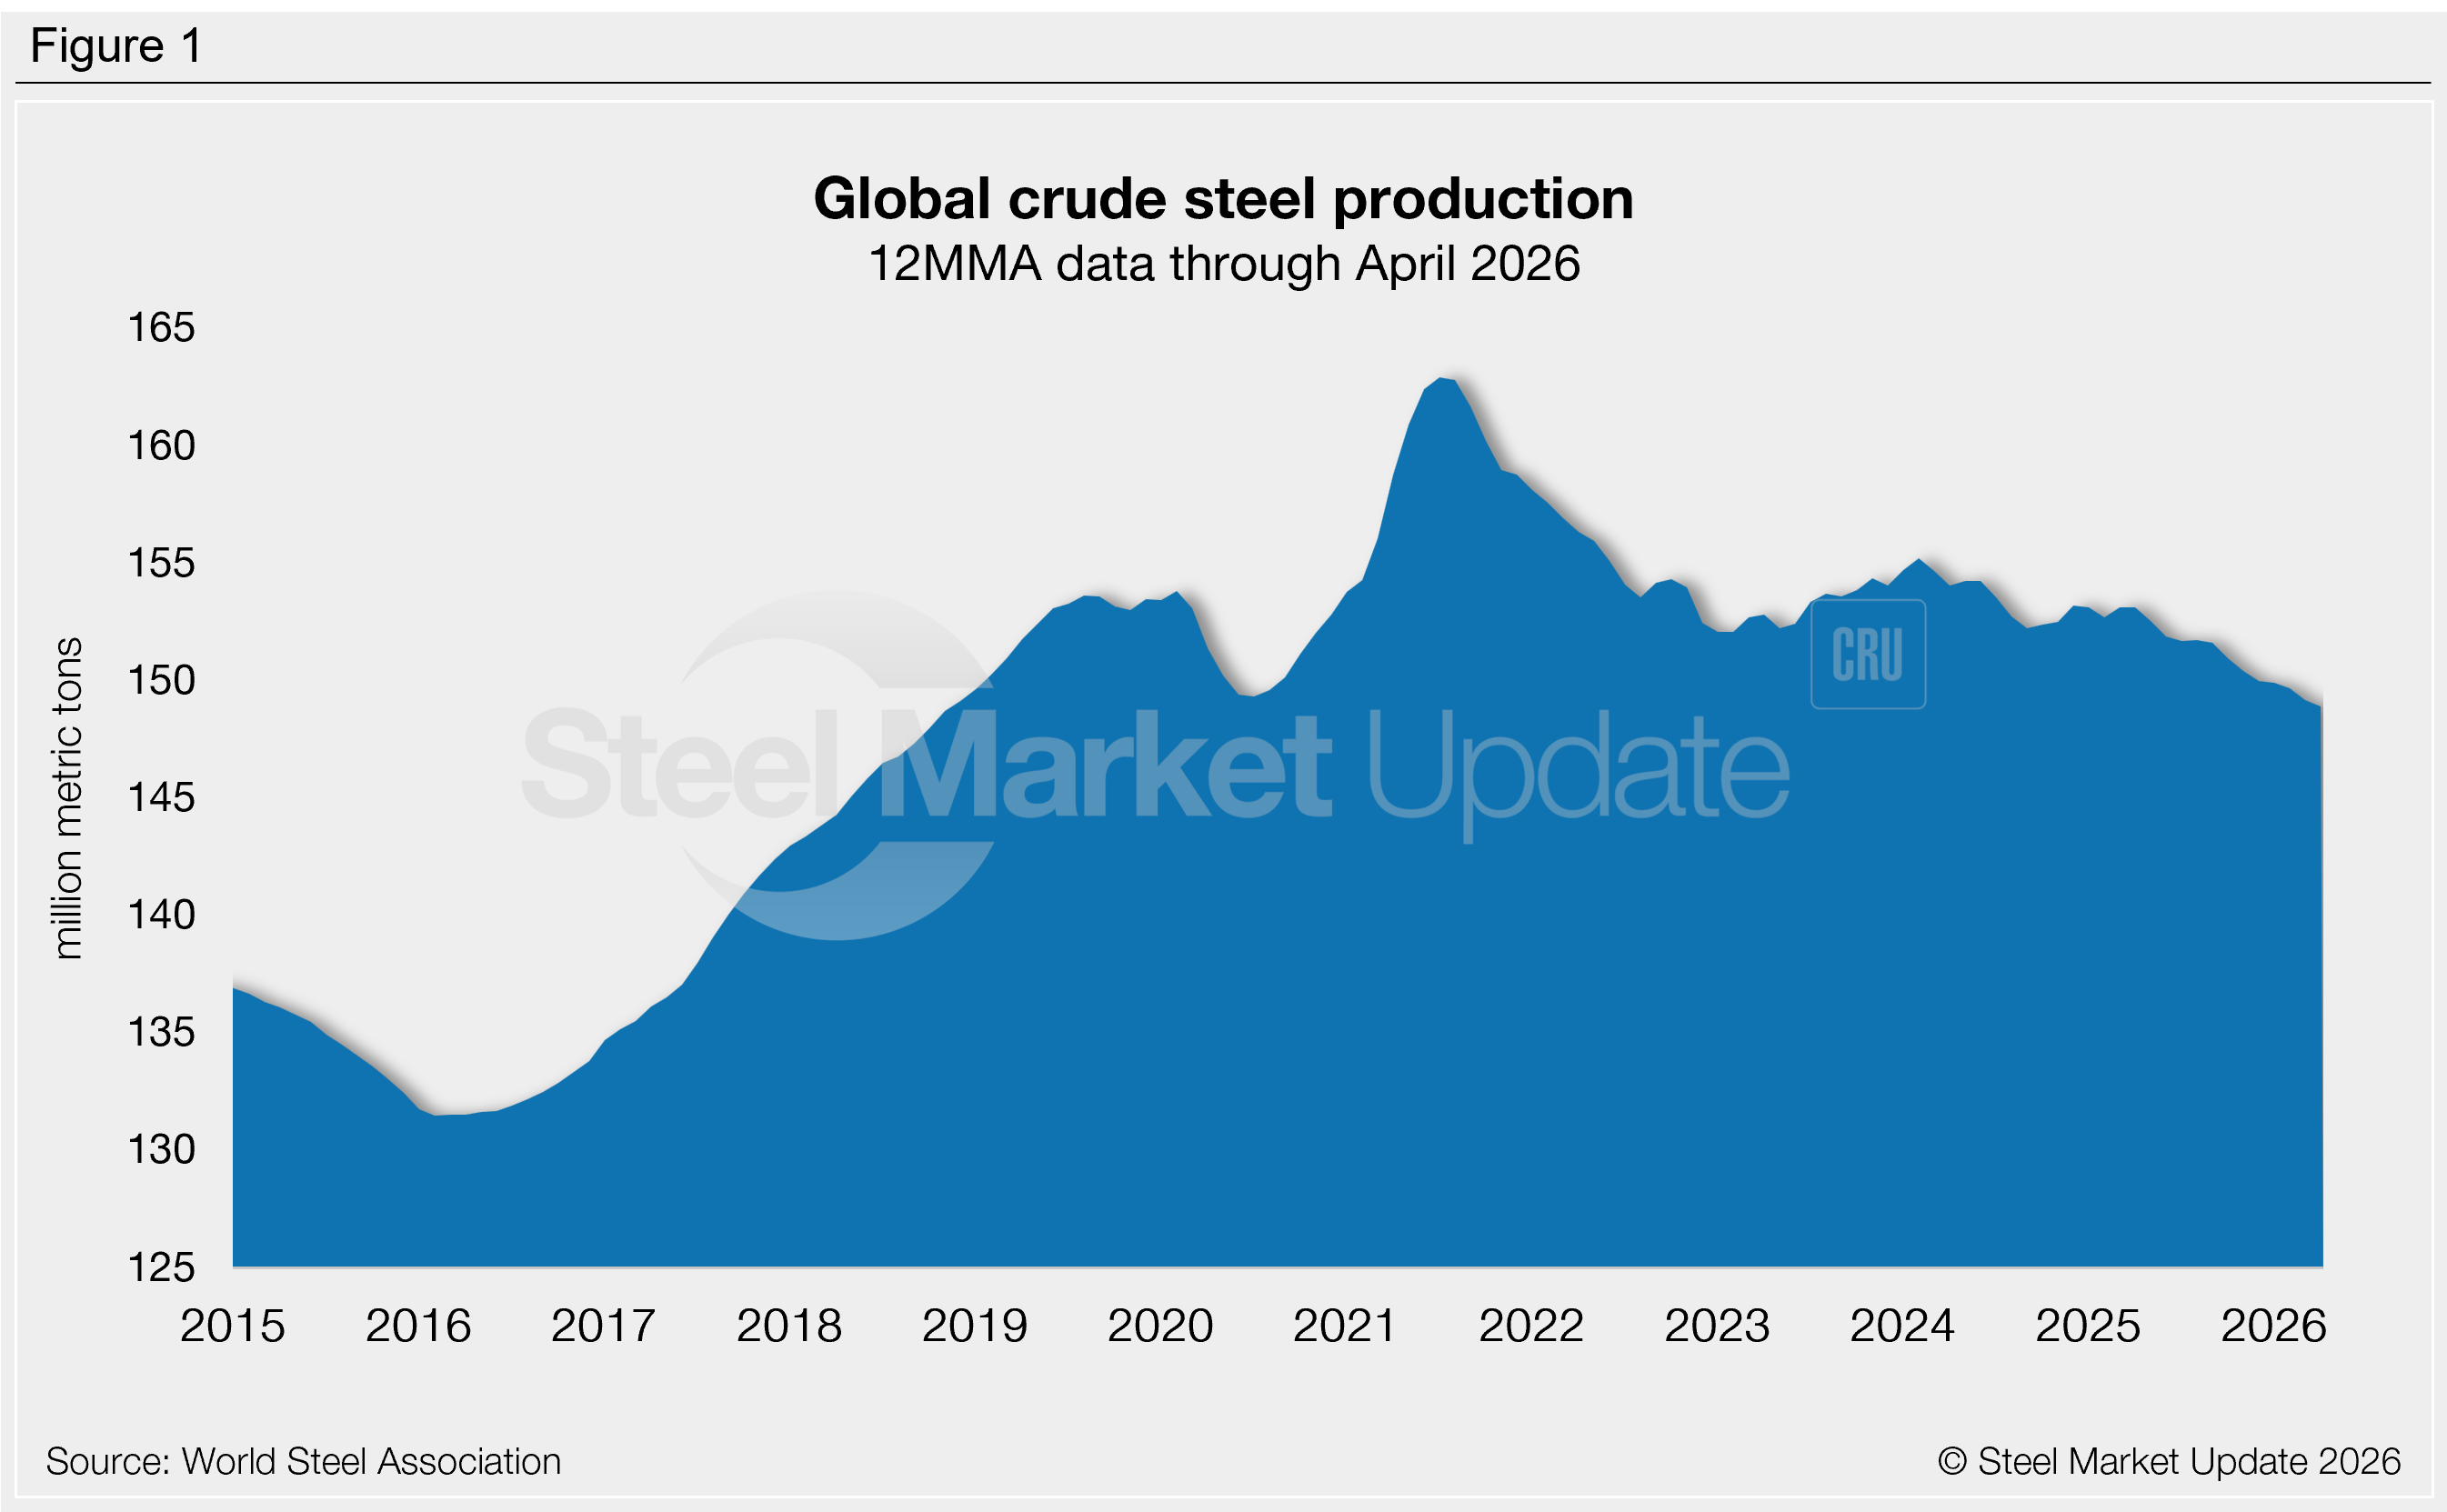
Following a one-year high in March, the total volume of raw steel produced around the globe slipped 4% in April to an estimated 153.4 million metric tons (mt), according to the World Steel Association (worldsteel). April production was roughly 5 million tons above last year’s average monthly rate, but weak compared with previous years.
On a 12-month moving average (12MMA) basis, annual production has averaged 148.9 million mt per month across the past year. This is the lowest rate recorded since November 2018, down 3% from the same period one year prior (Figure 1). Before last September, annual output had generally hovered between 152 million mt and 154 million mt for over three years, similar to pre-pandemic levels.
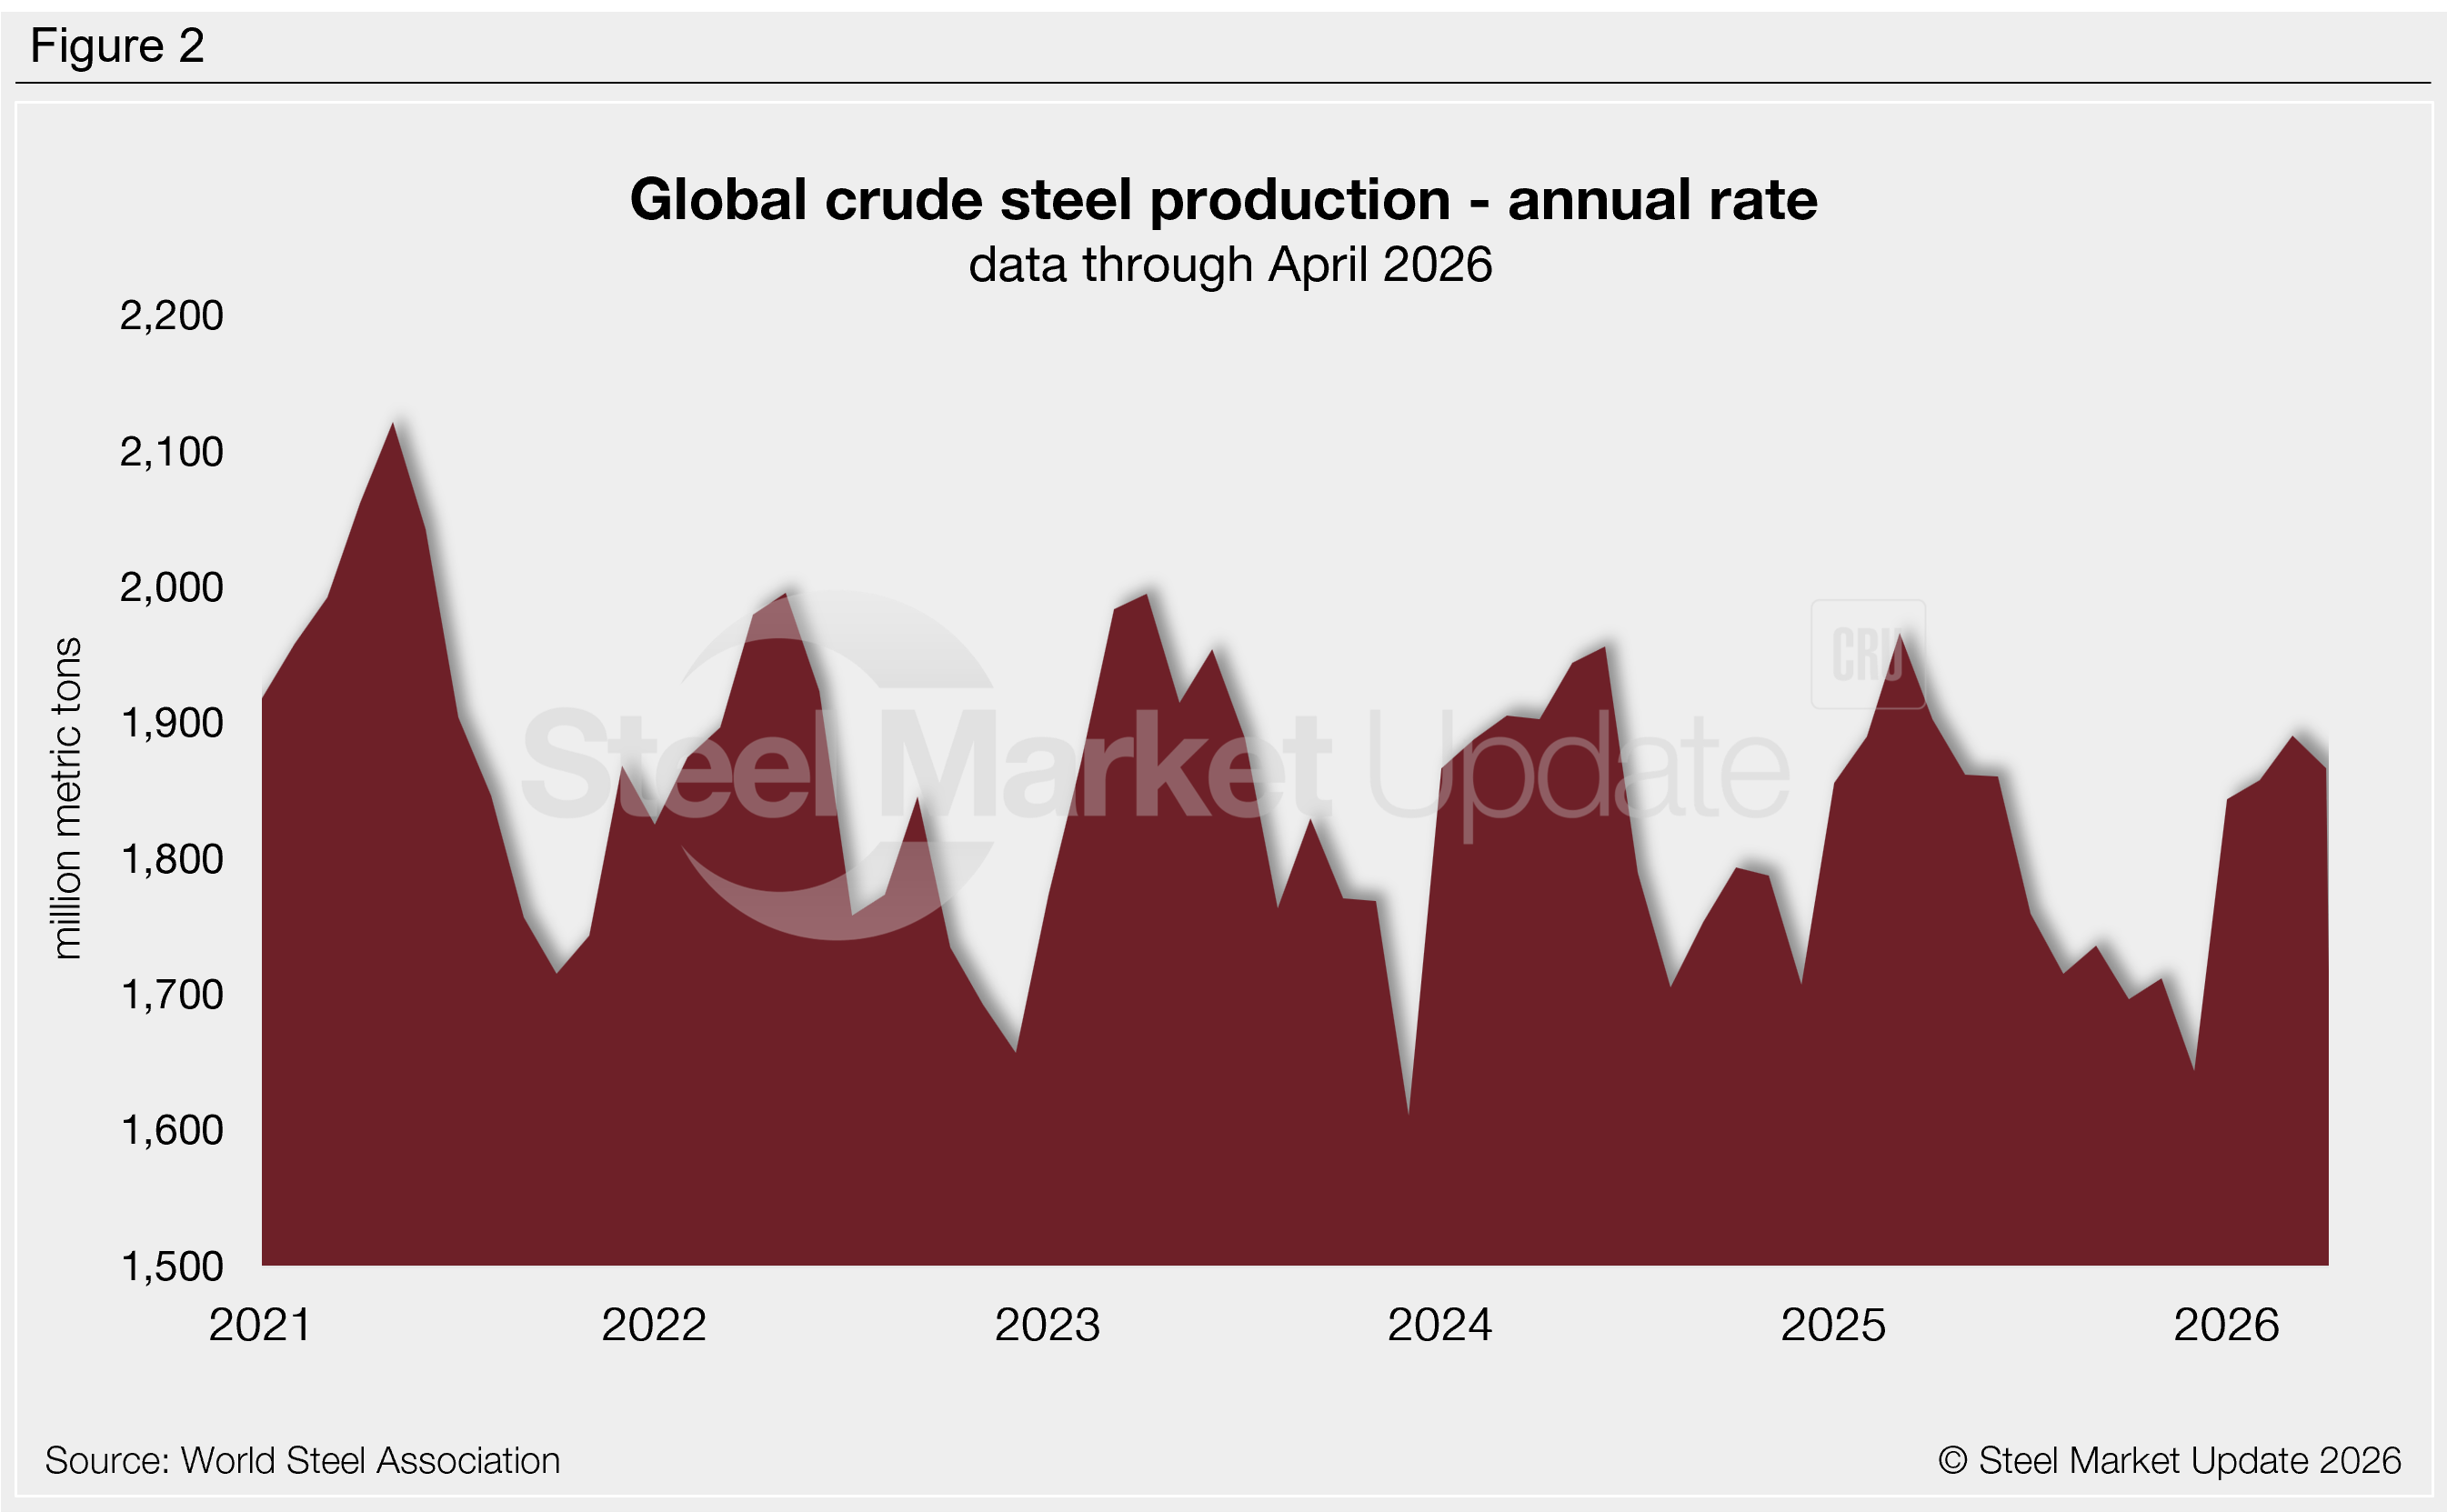
April’s daily production rate was 5.11 million mt per day, down 1% from March’s 11-month high of 5.18 million mt, In the last year, daily production has fallen as low as 4.50 million mt (December). At April’s rate, annualized global production would total approximately 1.87 billion mt (Figure 2). Compared with the same month in previous years, this annualized production rate is 2% below the 2025 and 2024 levels and 6% below the 2023 and 2022 levels.
Seasonal trends show contraction
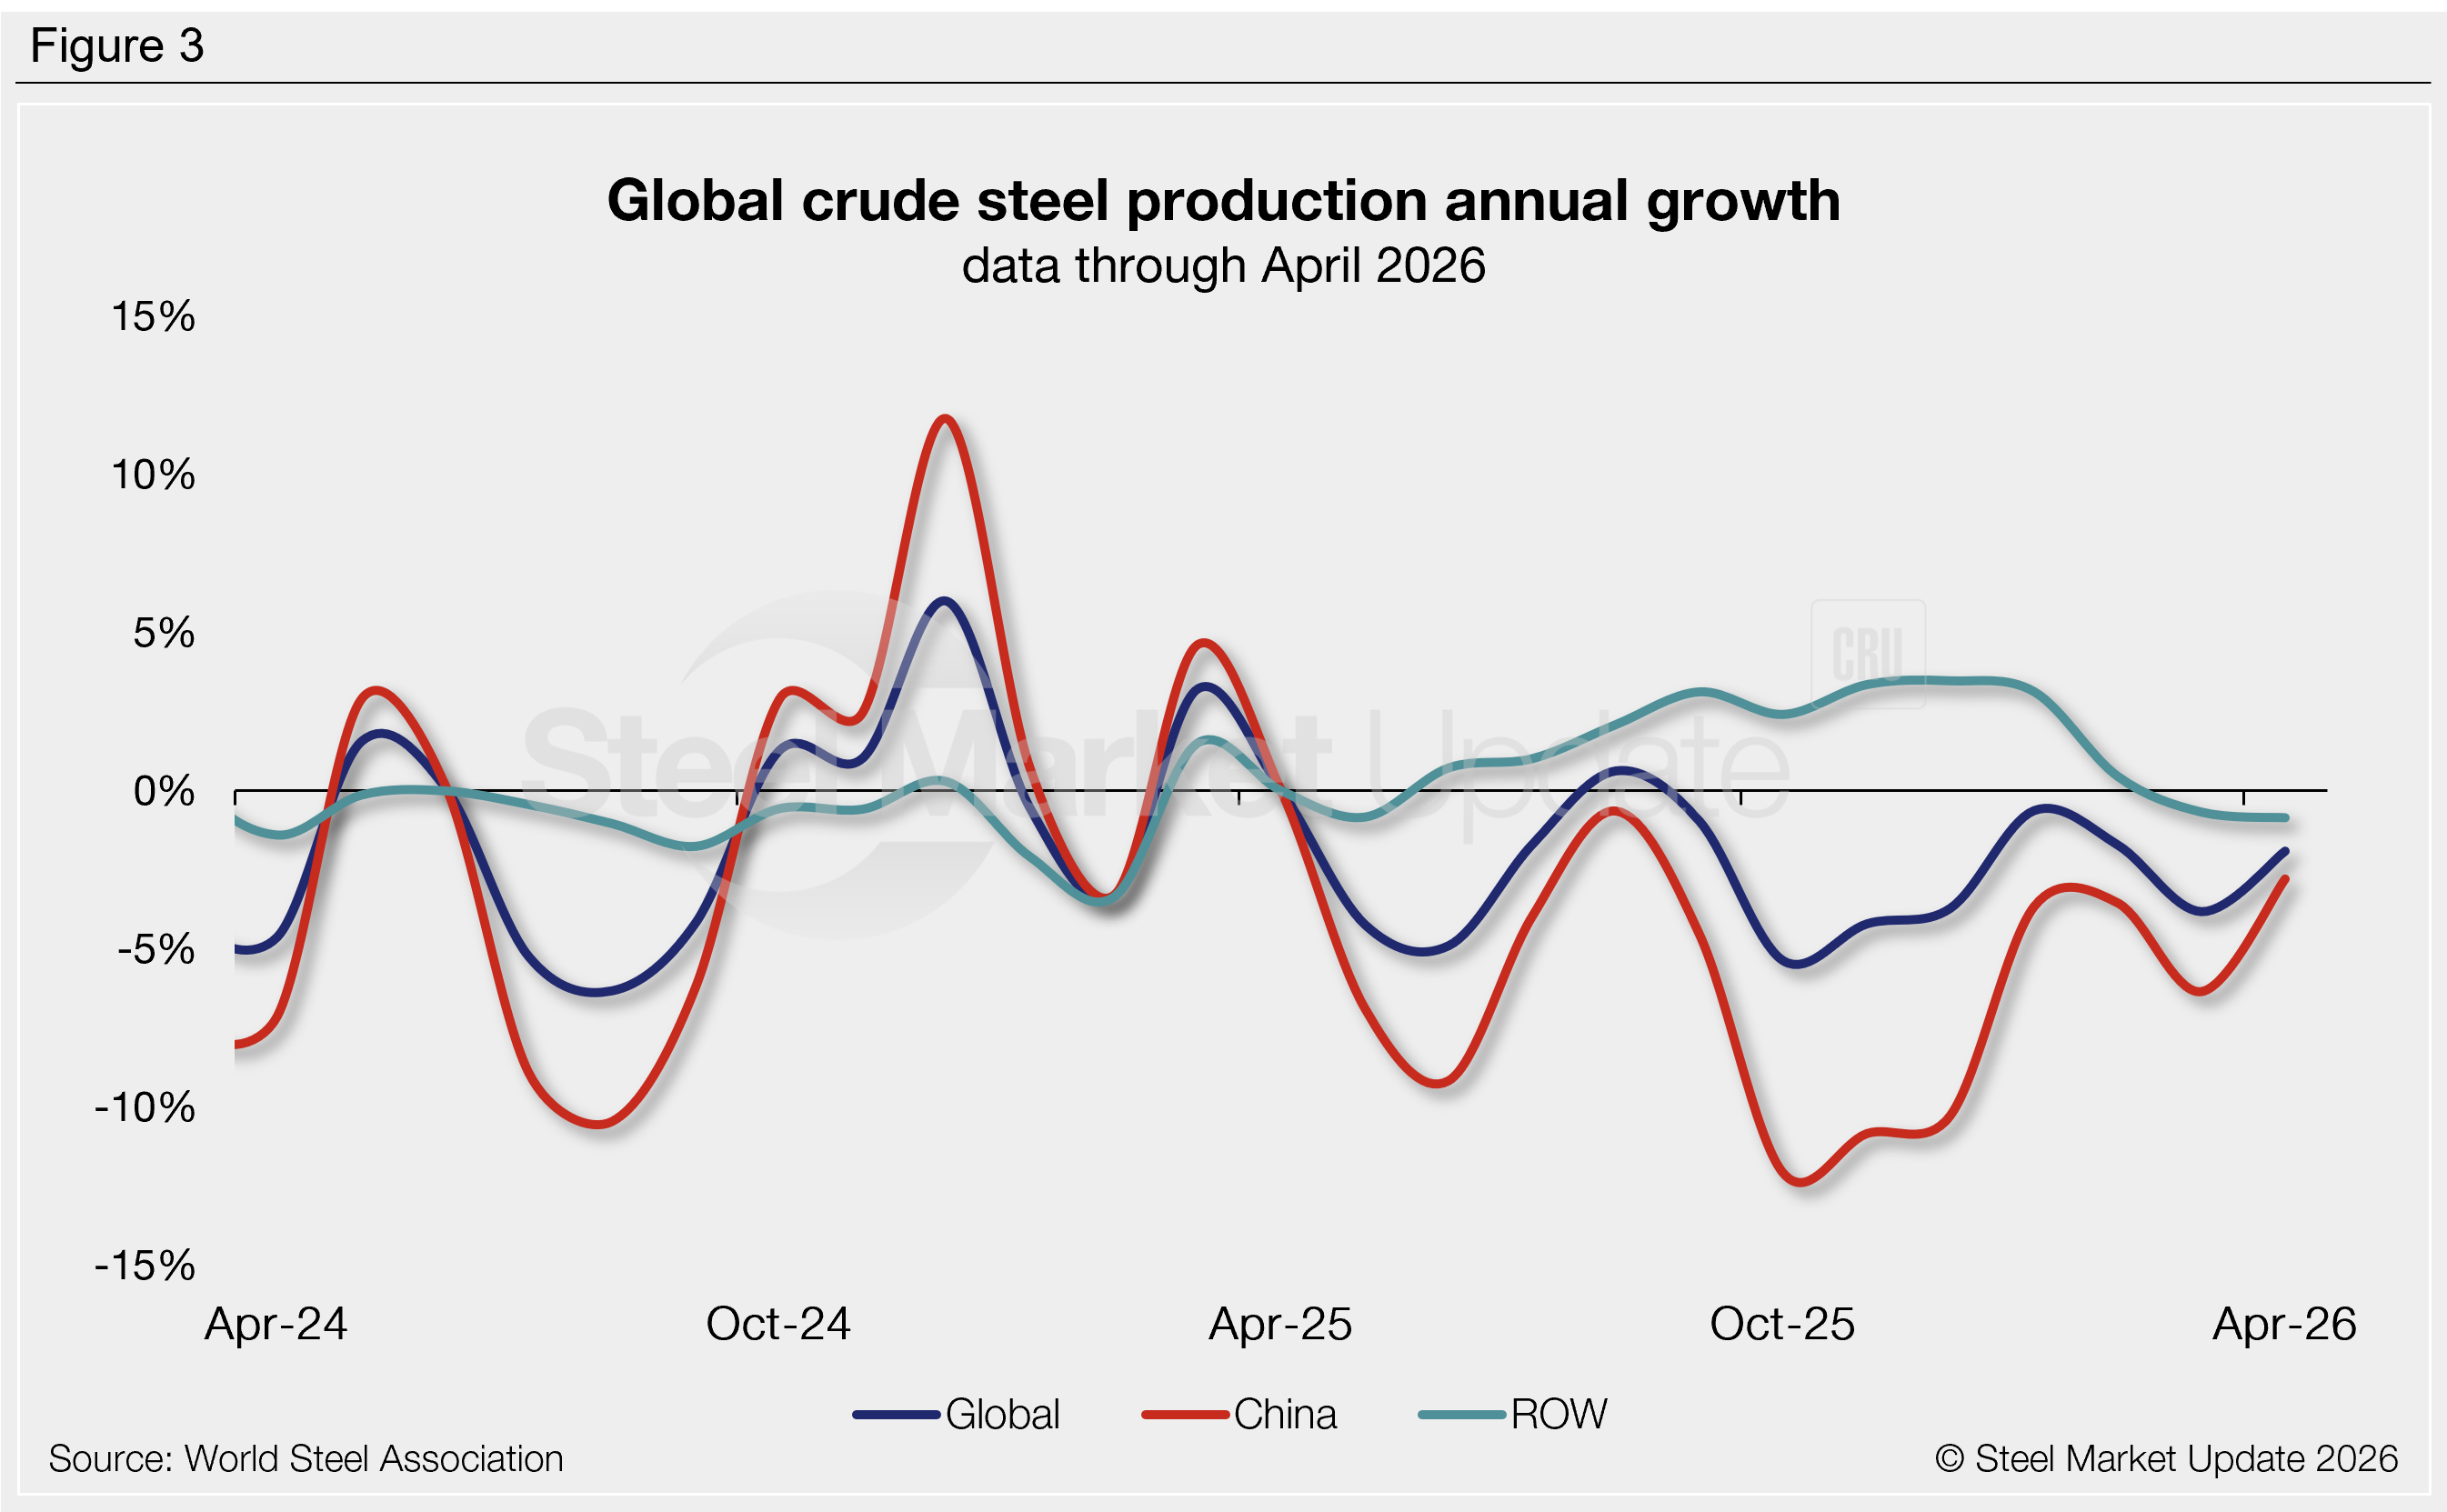
Steel production is highly seasonal, with output typically strongest in the spring months and weaker in the second half of the year. Annual comparisons can help see past seasonal variations. Figure 3 shows the year-over-year (y/y) growth rates for total global production, as well as for China and the rest of the world (ROW).
April output was 2% lower than the same month of 2025, the eighth consecutive month to experience negative annual growth. Chinese output was down 3% y/y, marking one full year of negative growth, while ROW production was down 1%.
China vs. rest of world
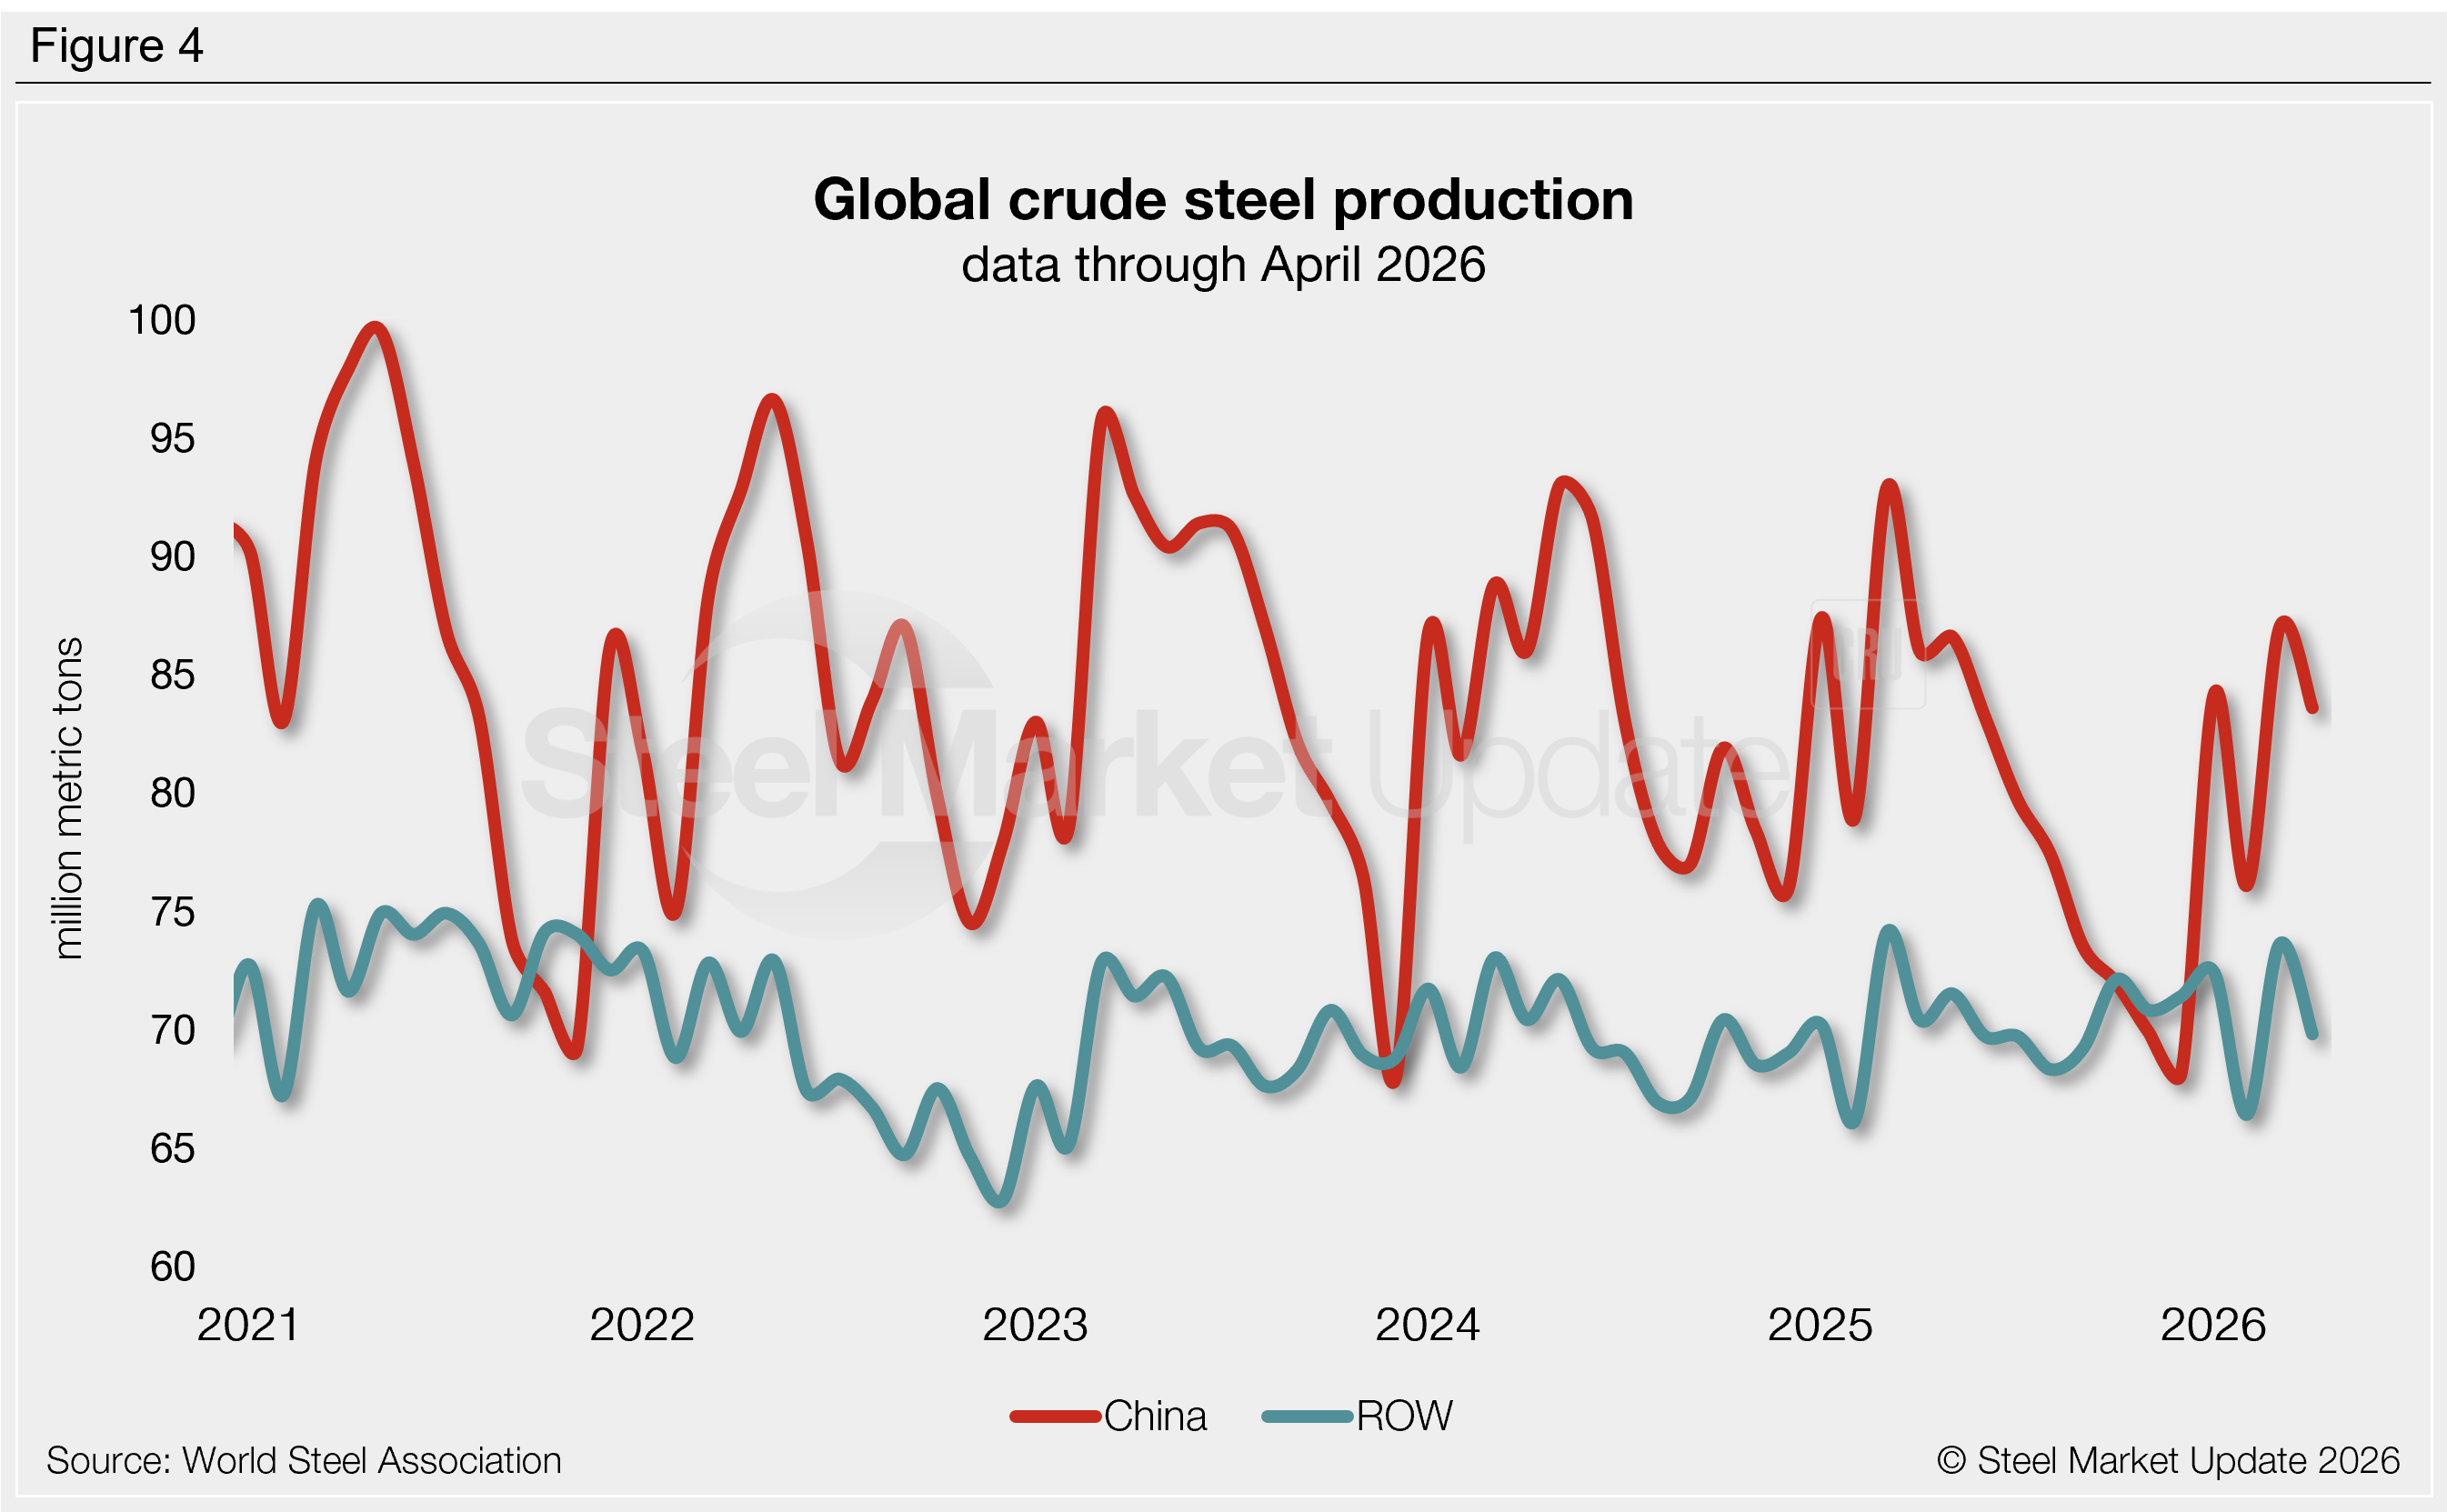
China accounted for 54% of global production in April with output of 83.6 million mt, down 4% from March (Figure 4). Chinese production has averaged 78.5 million mt per month in the past year. Since 2023, China has consistently accounted for 50-57% of total global output.
ROW steel output fell 5% from the one-year high of 73.6 million mt set in March, totaling 69.8 million mt in April. ROW production has averaged 70.4 million mt per month across the last year.
Other top-producing countries
India maintained its position as the second-largest steel producer in April, accounting for 9% of global output. Other significant producers included the United States at 5%, Japan at 4%, South Korea and Russia at 3%, and Turkey, Germany, and Brazil at 2%.
Comparing year-to-date (YTD) output by country to the same period of 2025 reveals modest shifts in market share. In the first four months of 2026, Russian production was down 12% from the same period of 2025, and China was down 4%. Meanwhile, YTD output in India and Germany was up 9% y/y, Vietnam was up 8%, the United States was up 7%, and Turkey was up 6%.


