Prices

April 20, 2017
Foreign Steel Imports: SMU Opinion - Items at Risk
Written by John Packard
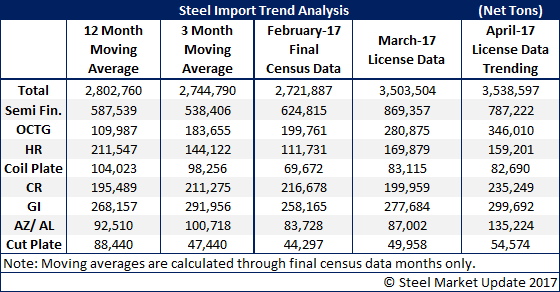
The U.S. Department of Commerce released the latest update on foreign steel import license request on Tuesday evening. The data suggest that April will be similar to that of March where license data is at 3.5 million net tons. Both March and the April trend a well above both the 12 month and 3 month moving averages and have to be quite disturbing to the domestic steel industry.
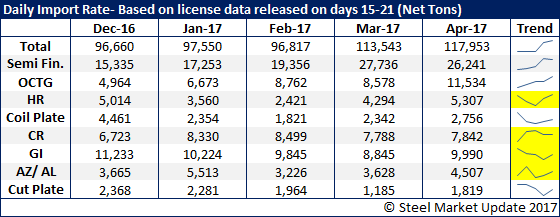
We pointed out in recent articles on this subject that the domestic steel mills continue to be the largest importers of record. Semi-finished steels (slabs, billets) saw licenses above 800,000 tons in March (12-month moving average is 587,539 tons) and we are trending toward another big month in April based on the license data through the 18th of the month.
Oil Country Tubular Goods (OCTG) are surging and (in our opinion) will be the first item to come under scrutiny by the Trump Administration. OCTG is one item where the surge in tonnage can be clearly seen (note table below). The 12-month moving average of OCTG is 109,987 net tons per month and we are trending near, or above, 300,000 net tons in both March and April. Korea. which dropped as low as 16,390 net tons in August 2016, for April already has requested 118,046 net tons as of the 18th of April! Who can forget the images of US Steel CEO Mario Longhi in the Oval Office with President Trump and the President telling USS that new pipe was going to be made in the U.S.A. The President has already called on Secretary Wilbur Ross to conduct an investigation based on national security interests into steel imports…
What other products could be found to be “at risk”? In our opinion, cold rolled and coated steels (galvanized and Galvalume).
SMU went back and looked at cold rolled monthly averages for calendar years 2012, 2013 and 2014. What we found was 2012 & 2013 the average was 108,000 net tons per month and then that jumped to 215,000 net tons per month in 2015. The average for the past twelve months (where Final Census data has been published) is 195,489 net tons. Both March and the April 2017 trend based on license data is above the 12-month moving average and double what we saw in 2012 & 2013.
The galvanized monthly average in 2012 was 167,000 tons, 2013 was 173,000 tons and 2014 rose to 276,000 tons. The 12-month average is 268,157 tons and for March and April the trend is above the 12-month moving average and almost double the 2012 & 2013 averages.
Other Metallic which is mostly Galvalume (aluminum/zinc coated steels) averaged 55,000 tons in 2012, 60,000 tons in 2013 and then 85,000 tons in 2014. The 12-month moving average (Final Census) is 92,510 tons. March 2017 is going to be close to the 12-month average while April 2017 is trending toward 20-50,000 tons greater than that average and more than double the 2012 & 2013 numbers.
We don’t show this graphic to our readers all the time but, Steel Market Update does keep track of the trend and we provide a little graph at the end of the table below to provide a visual for our readers. What you are looking at is the trend for daily license requests in the 15th-21st part of each month referenced. As you can see there are a number of items that are trending up even though many of these items are subject to ongoing antidumping and countervailing duty investigations.