Prices

October 5, 2017
HRC Futures Finding Support...BUY THEM DIPS!!!
Written by David Feldstein
The following article on the hot rolled coil (HRC) futures markets was written by David Feldstein. As the Flack Global Metals Director of Risk Management, Dave is an active participant in the hot rolled futures market, and we believe he provides insightful commentary and trading ideas to our readers. Besides writing futures articles for Steel Market Update, Dave produces articles that our readers may find interesting under the heading “The Feldstein” on the Flack Global Metals website, www.FlackGlobalMetals.com. Note that Steel Market Update does not take any positions on HRC or scrap trading and any recommendations made by David Feldstein are his opinions and not those of SMU. We recommend that anyone interested in trading HRC or scrap futures enlist the help of a licensed broker or bank.
In order to win at pool, you need to think a few steps ahead and line up your shots accordingly.

Remember these guys and their 232 investigation?
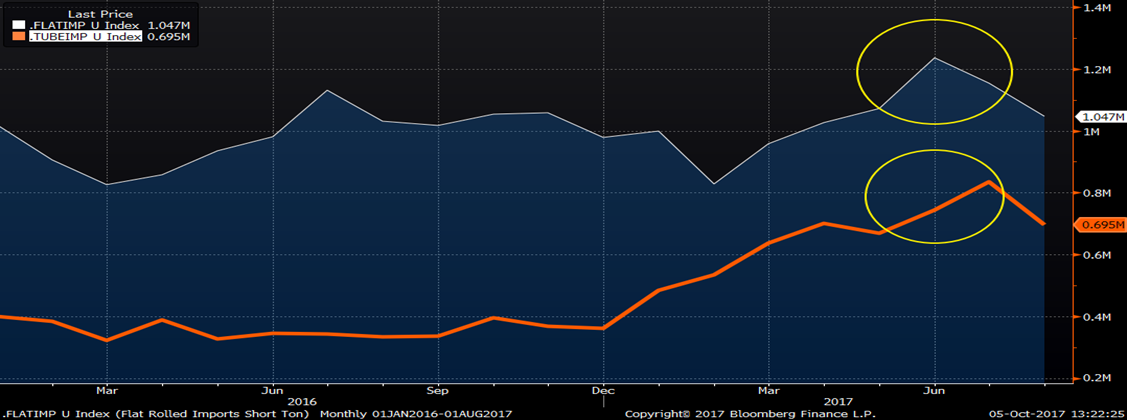
So far, the effect of this investigation looks to have been a sharp increase in imported flat rolled and tube products (see below) and perhaps a demand pull forward from buyers attempting to hedge policy risk.
Monthly Flat Rolled Imports (orange) and Tube Imports (white)
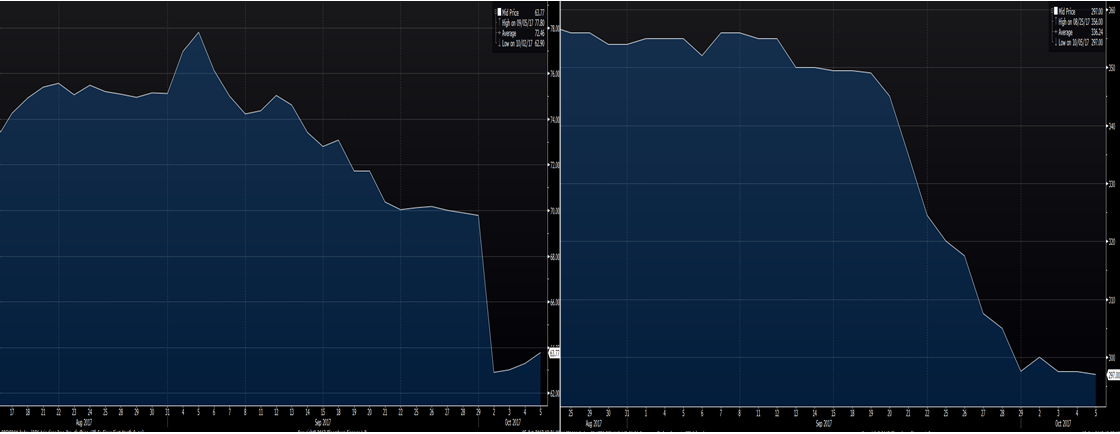
In addition to this increase in supply, raw material prices have been falling hard and fast in recent weeks. The front month iron ore future is down 18 percent to $63.77/t from a high of $77.8/t on Sept. 5, while the Platts TSI Turkish Scrap index has fallen 16 percent to $297.50 from a high of $356/t on August 18.
Front Month SGX Iron Ore Futures & The TSI Daily Turkish Scrap Index
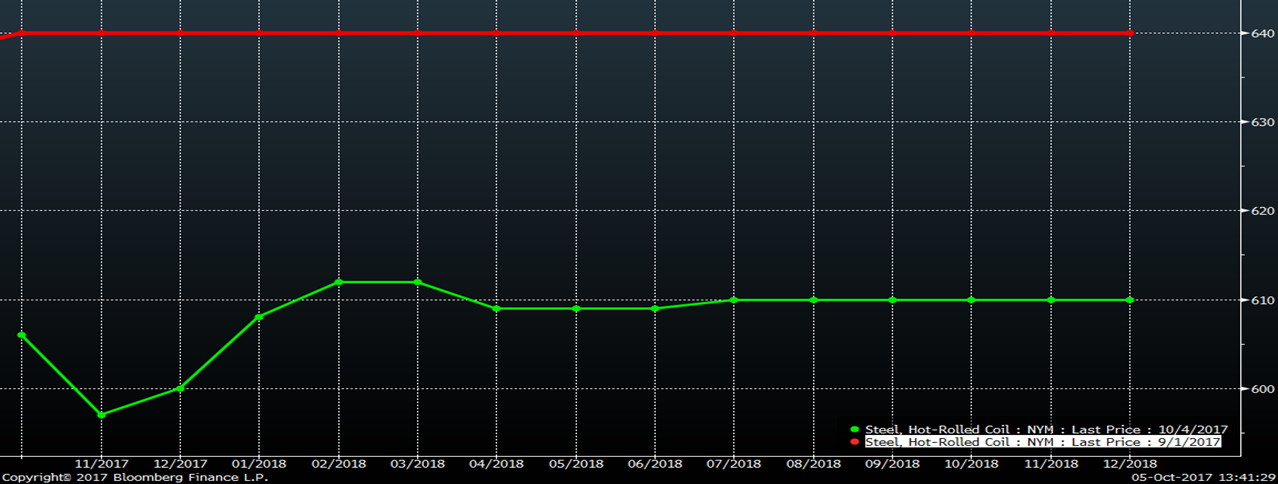
The increase in imports, the demand pull forward and falling raw materials have pressured HRC prices lower since early September. CME HRC futures have fallen $30-40/st from $640 on Sept. 1 to the $600 – $610 range as of Wednesday night’s settlements.
The CME Midwest HRC Futures Curve
For now, the October CME Midwest HRC future has found support just above the long-term uptrend line.
October CME Midwest HRC Futures
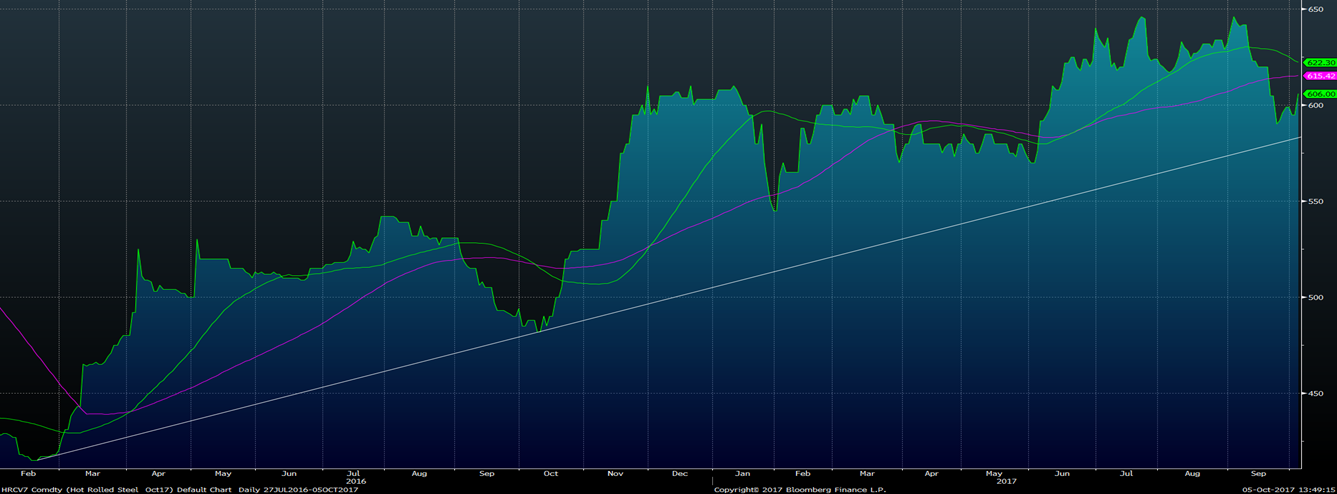
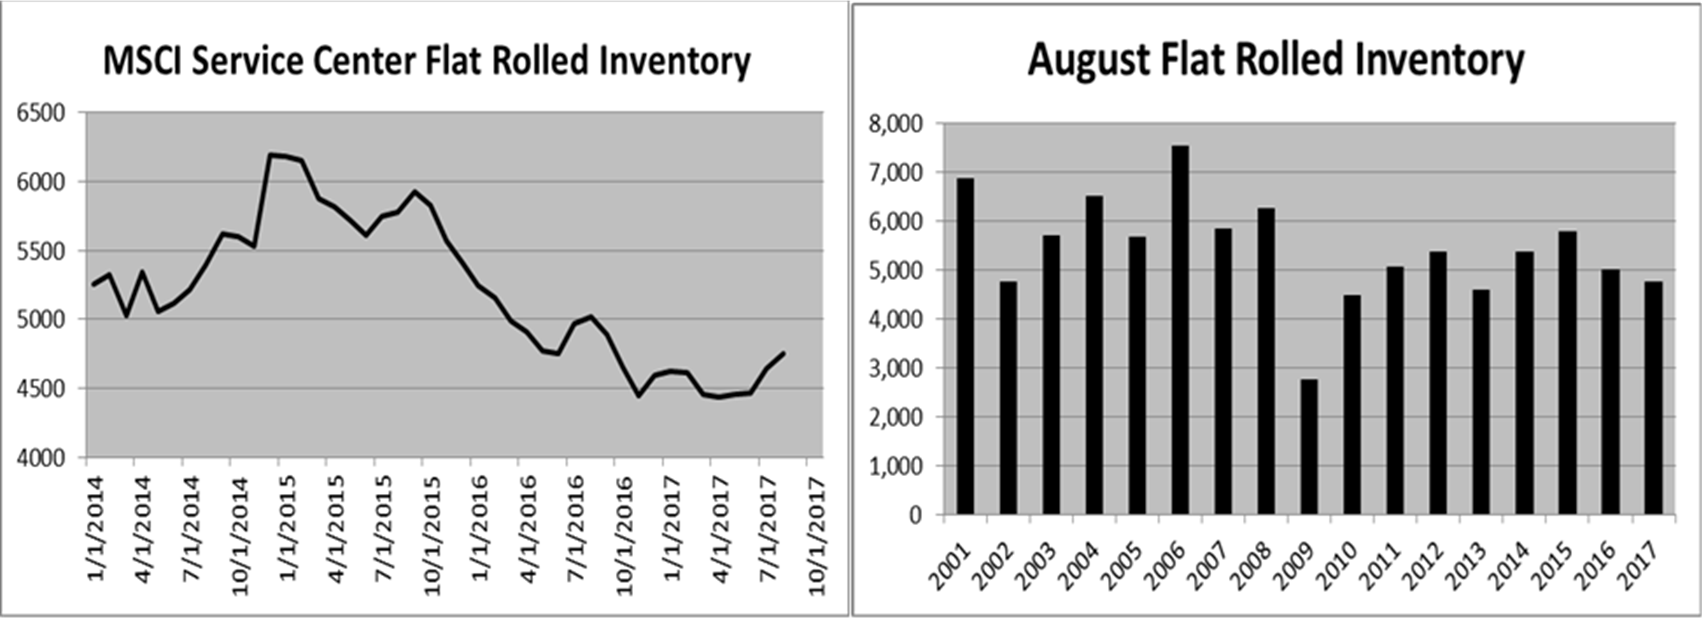
Let’s revisit the shooting pool metaphor. Throughout 2017, this article has had one big theme, “buy the dips.” Looking forward at the next couple “shots,” there are major developments to be considered on the supply front. First, there is the downtrending import license data that is expected to fall hard and fast due to initial concerns of the Section 232 investigation hampering import deals in June and July followed by crashing U.S. flat rolled premiums relative to R.O.W depressing deals in August and September. Second, there is up to 1.2m short tons of domestic flat rolled production to be pulled offline in Q4 due to planned mill maintenance and over 30m tons of Chinese production cuts planned over the next three months in an effort to fight pollution. Lastly, the MSCI, ISM and Durable Goods Reports continue to indicate depleted inventory levels at service centers and OEMs.
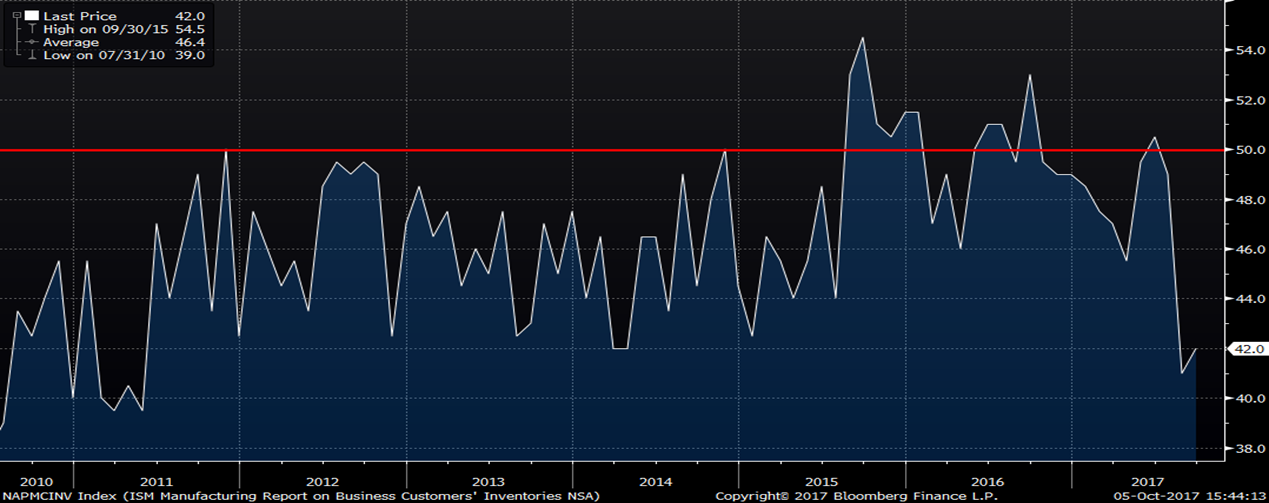
ISM Manufacturing PMI Customers’ Inventory
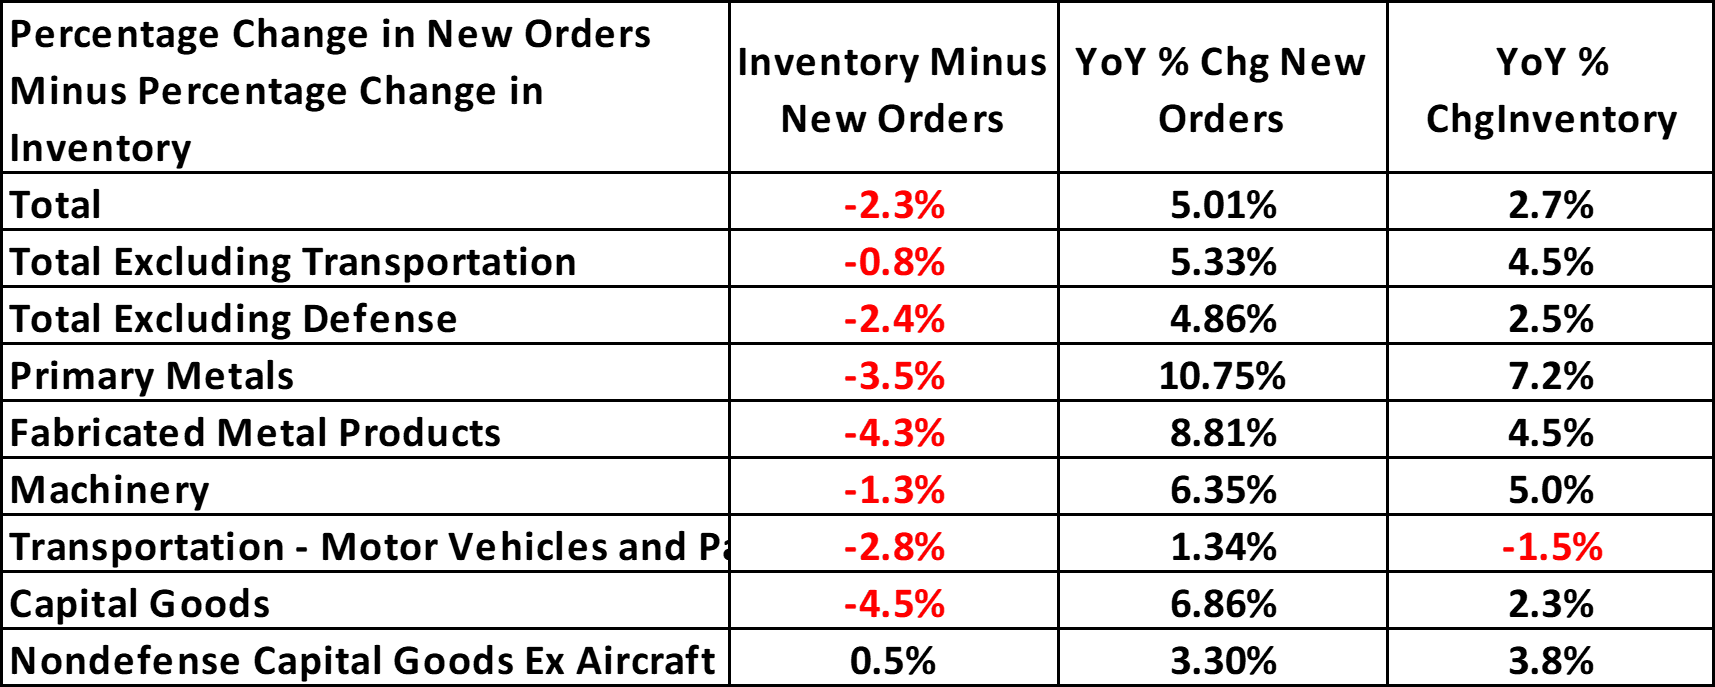
This table takes the YoY percentage change in nominal unadjusted U.S. dollars for inventory and subtracts the YoY percentage change in nominal unadjusted U.S. dollars for new orders. As you can see, almost every category is in need of replacing inventory sold on new orders. In other words, while inventory has increased YoY, inventory hasn’t increased by enough to replace all of the goods sold.
August Durable Goods New Orders and Inventory YoY Percentage Change
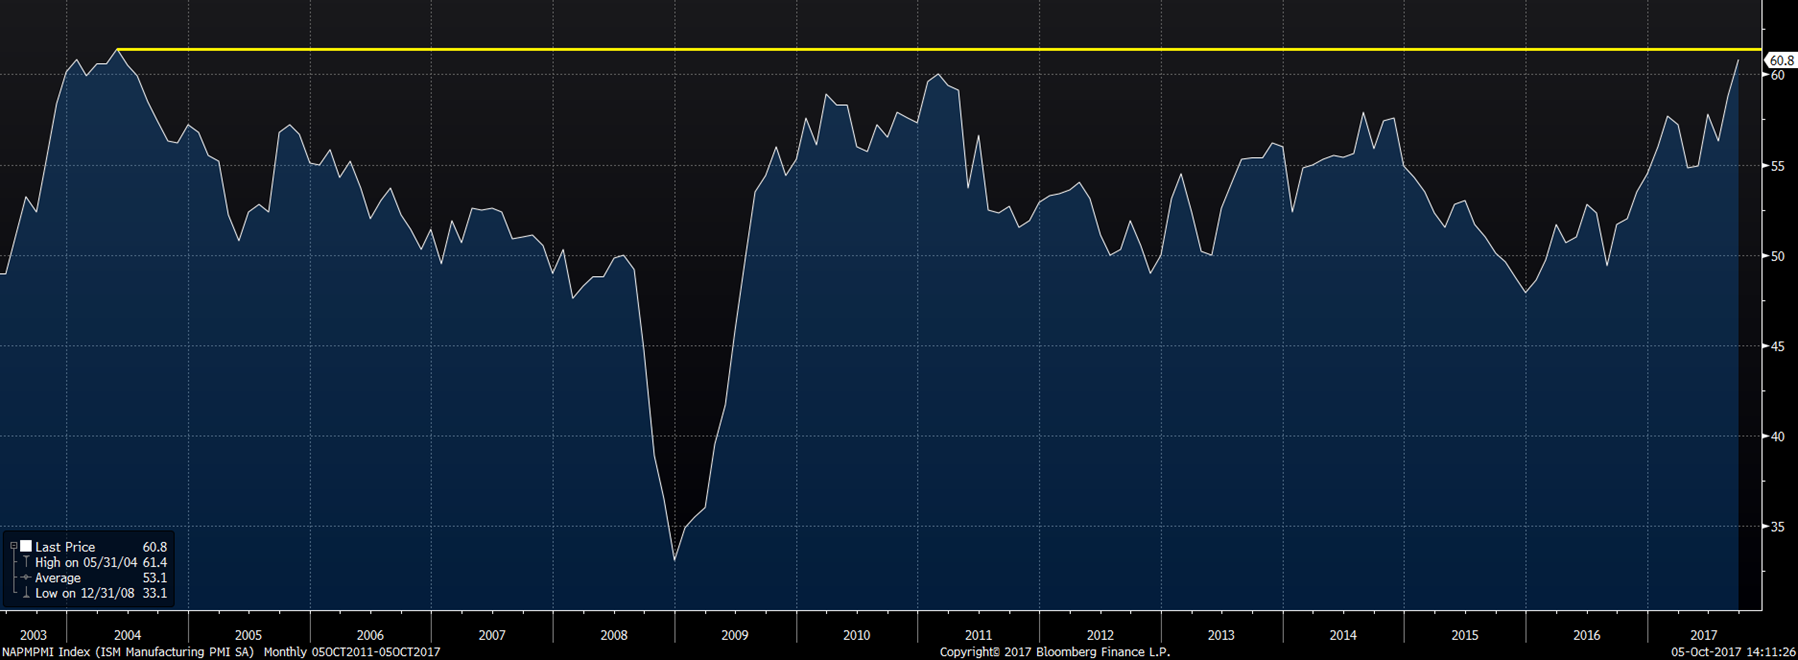
Supply looks to be contracting in the coming months with customers’ inventory at depleted levels. On the demand front, you have the ISM Manufacturing PMI at 60.8, the highest level since May 2004, while the ISM Manufacturing PMI new orders subindex is up to a very healthy 64.6.
ISM Manufacturing PMI (white) and ISM Manufacturing New Orders Subindex (orange)
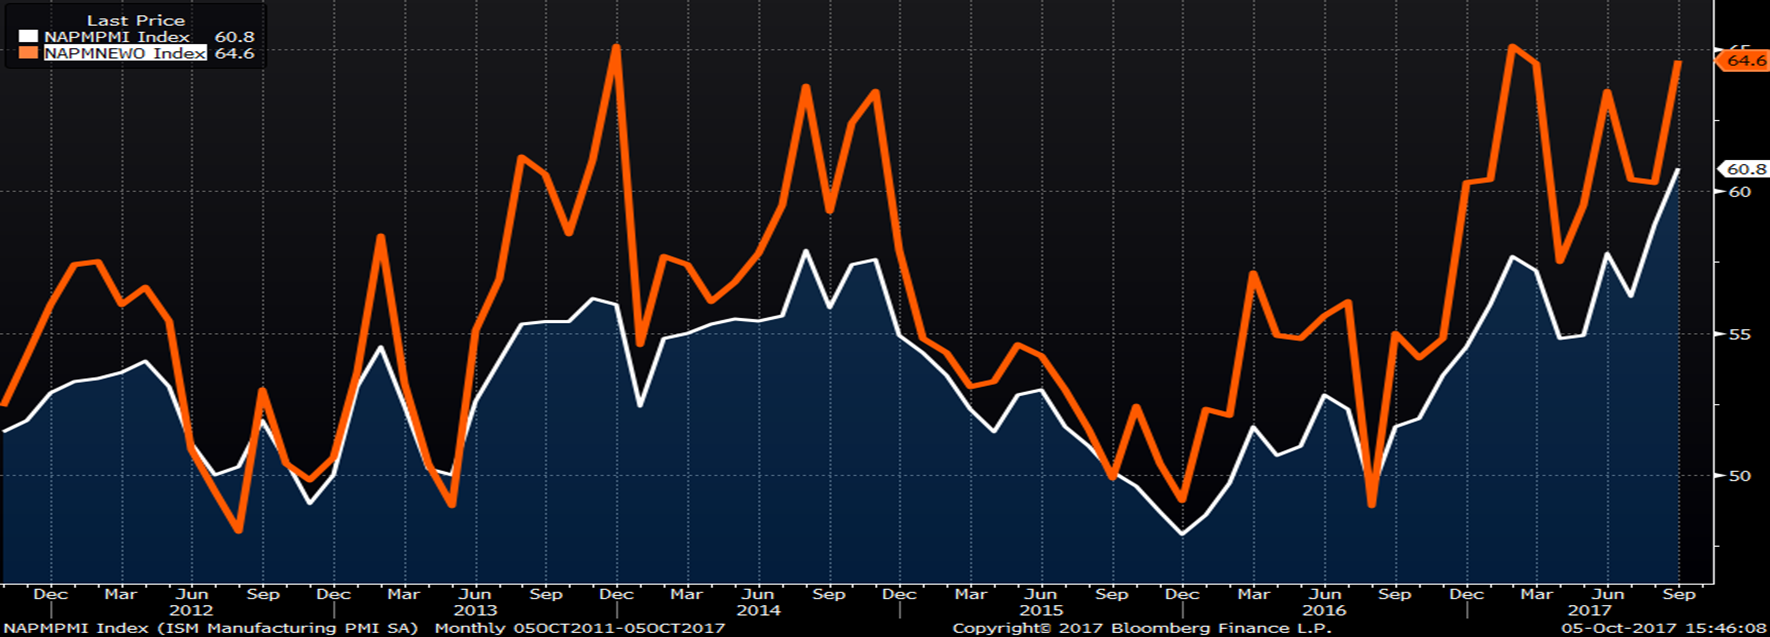
ISM Manufacturing PMI
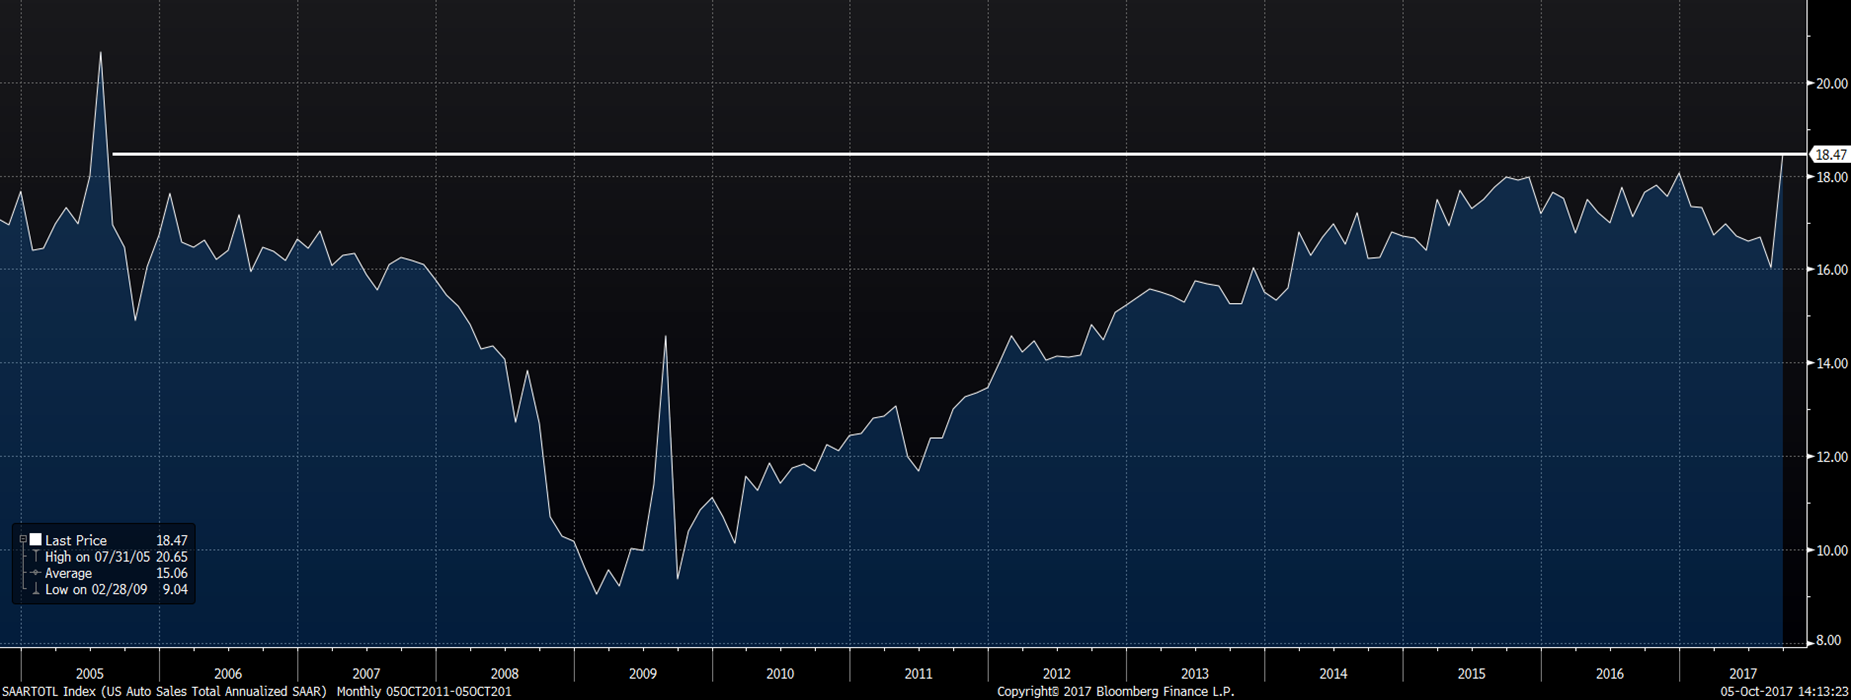
September auto sales were at the highest annualized rate since July 2005.
September US Auto Sales SAAR
Steel demand will be boosted by the rebuild and replacement of an estimated $150 billion of destruction caused by this year’s hurricanes.
In the months ahead, supply and demand look to be favoring higher prices. However, iron ore and scrap prices remain very uncertain. So…

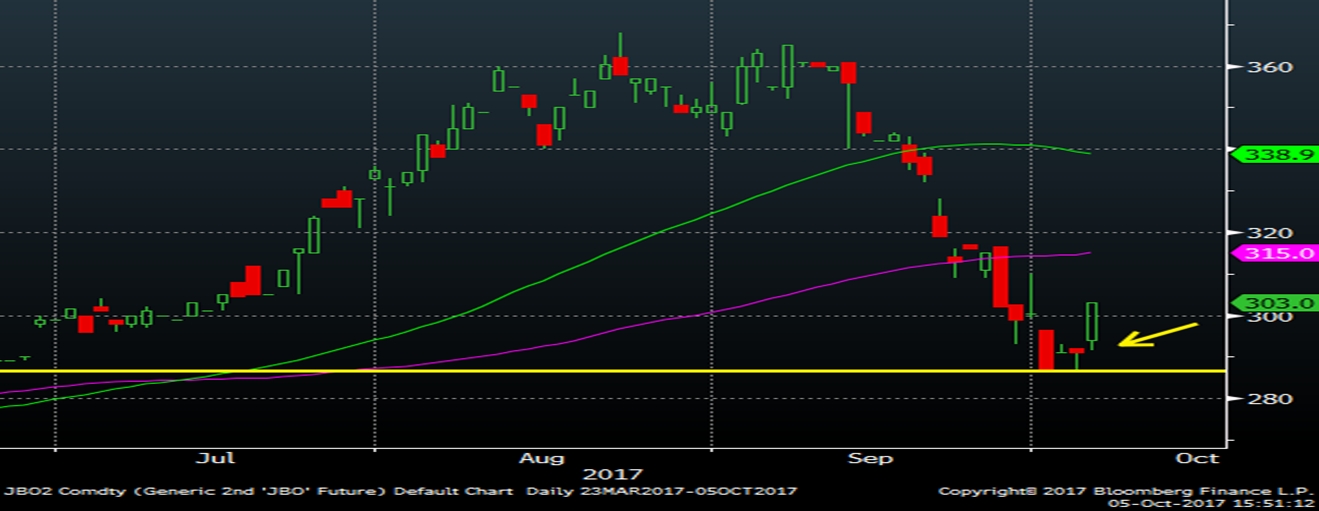
The chart below of the November LME scrap future has what’s called a “confirmed hammer pattern” (yellow arrow), indicative of a trend reversal with a long-term uptrend line for support down at $265. Watch the $285 level.
2nd Month Rolling LME Turkish Scrap Future
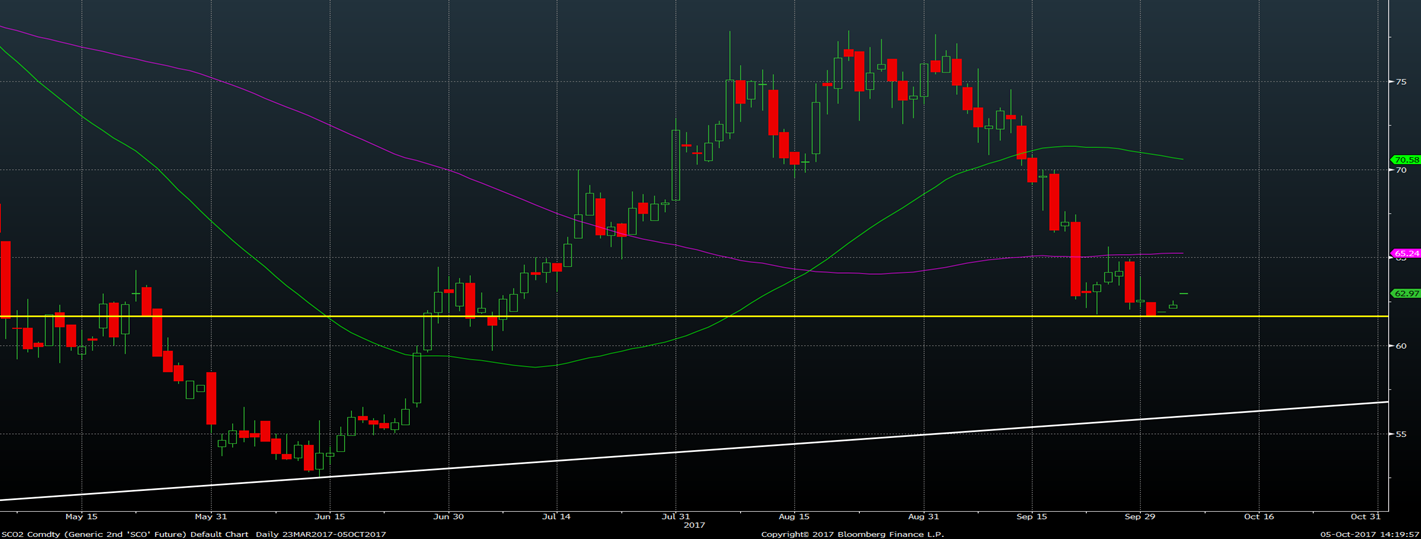
The chart below of November SGX iron ore futures is showing a similar pattern as that of scrap. However, iron ore futures trading has ground to a halt this week as China is celebrating its week long Golden Week Holiday. Watch the $62 level to see if it holds. However, if these levels in scrap and ore don’t hold, next stop is the uptrend lines and then look out below if those don’t hold.
2nd Month Rolling SGX Iron Ore Future
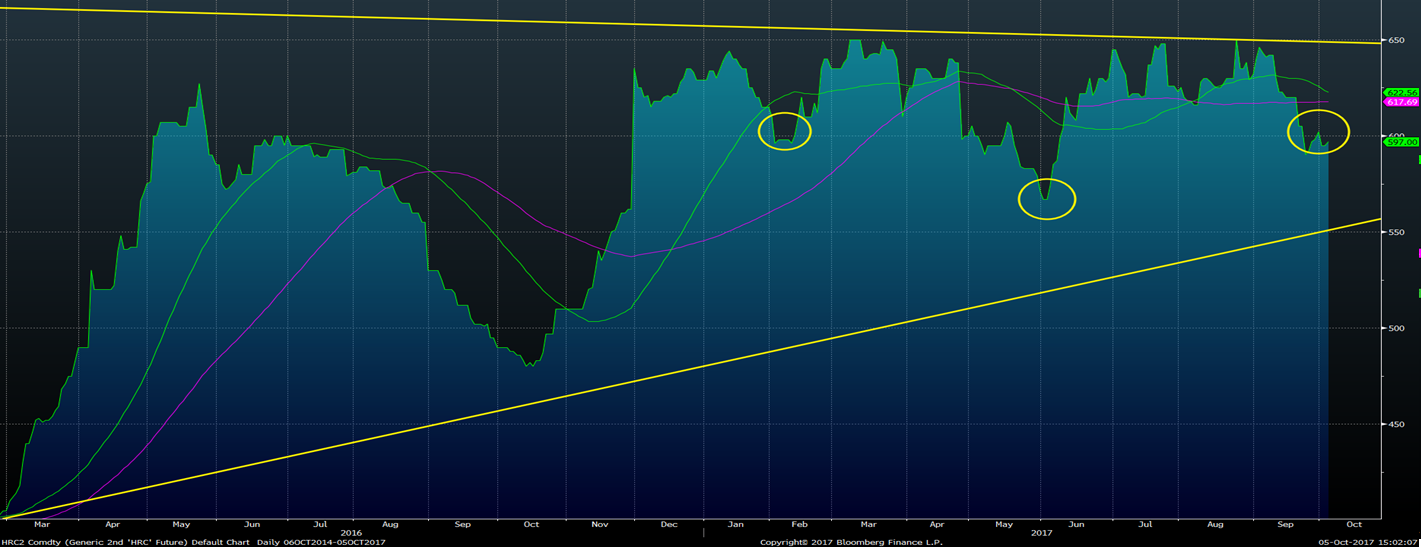
Now back to HRC futures. The chart below of the rolling 2nd month CME HRC future shows it trading just above the long-term uptrend line. Just like ore and scrap, if price finds support here, it should rally and if trading breaks below the trend line, prices could fall sharply. Next, notice the three circles. If prices rally out of these levels and then march higher to $650, a “reverse head and shoulders” pattern would have been created. If prices break above $650, confirming the “head and shoulders” pattern, look for a major rally to follow.
2nd Month Rolling CME Midwest HRC Future
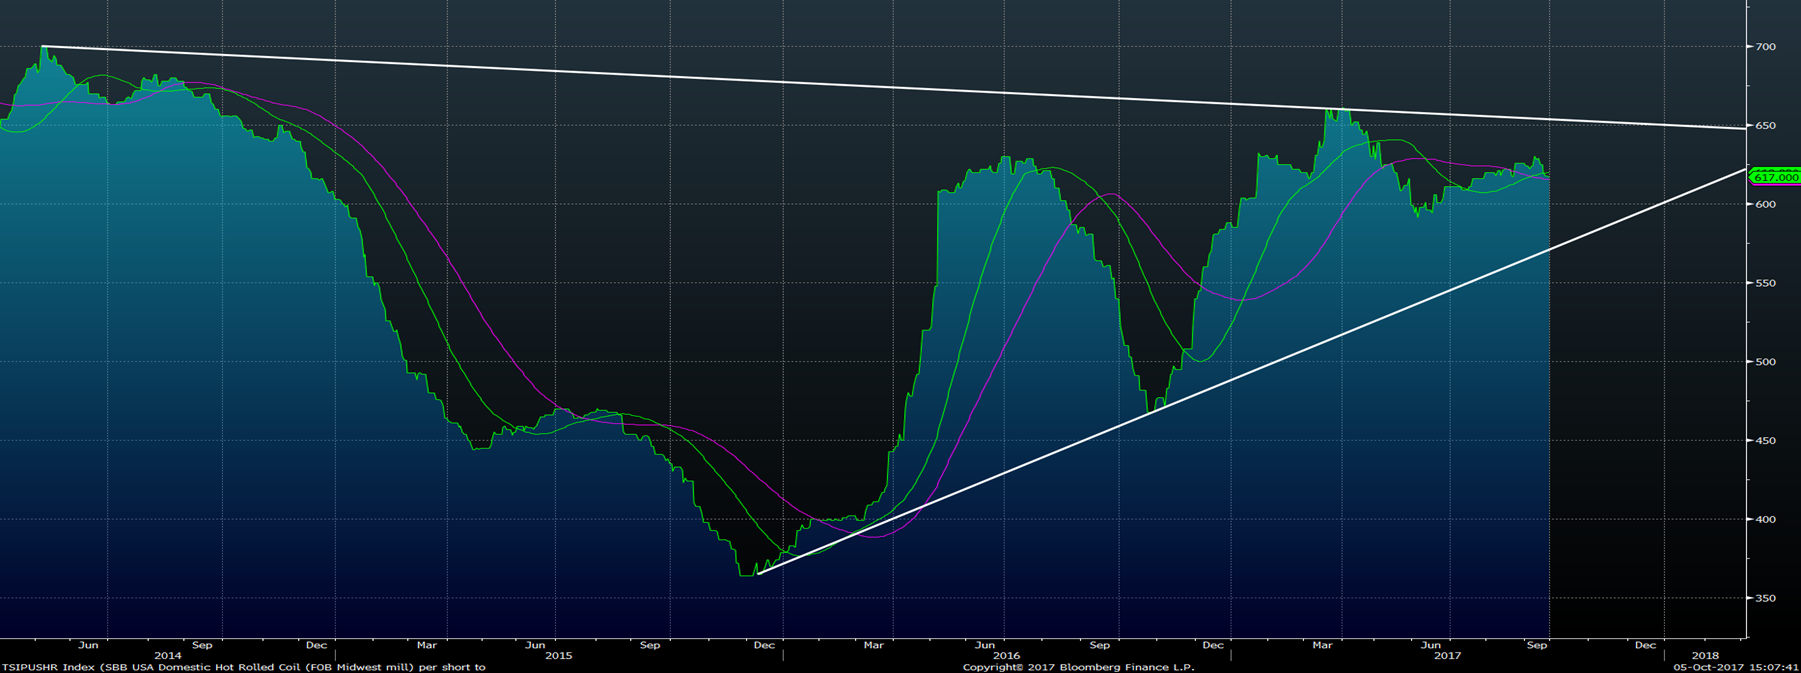
This chart is the TSI Daily Midwest HRC Index back to 2014. The pattern here is called a “triangle.” There is a long-term downtrend from the index topping out at $700 in May 2014 and the shorter long-term uptrend starting at $365 in December 2015 creating a “triangle.” Typically, when prices form a “triangle,” volatility compresses as prices trade into the apex until prices break above or below one of the trend lines. After the break, there tends to be a major move that follows. So this is telling us to watch for some major volatility to come sometime in the next few months.
TSI Daily Midwest HRC Index
It’s probably not a great time to take upside forward price risk considering the fundamental and technical data listed herein. Much better to stick with what’s been working so…..
Buy Them Dips!
The opportunity might present itself in HRC futures at any time, so pay close attention to President Trump’s tweets, keep your local broker on speed dial and remember Ferrous Bueller’s philosophy…
“Life moves pretty fast. If you don’t stop and take a look around once in a while, you could miss it.”