

Prices

December 12, 2019
Hot Rolled Futures: The Bear Market is Dead; Ferrous Rally Time!
Written by David Feldstein
The following article discussing the global ferrous derivatives markets was written by David Feldstein. As an independent steel market analyst, advisor and trader, we believe he provides insightful commentary and trading ideas to our readers. Note that Steel Market Update does not take any positions on HRC or scrap trading, and any recommendations or comments made by David Feldstein are his opinions and not those of SMU or the CRU Group. We recommend that anyone interested in trading steel futures enlist the help of a licensed broker or bank.
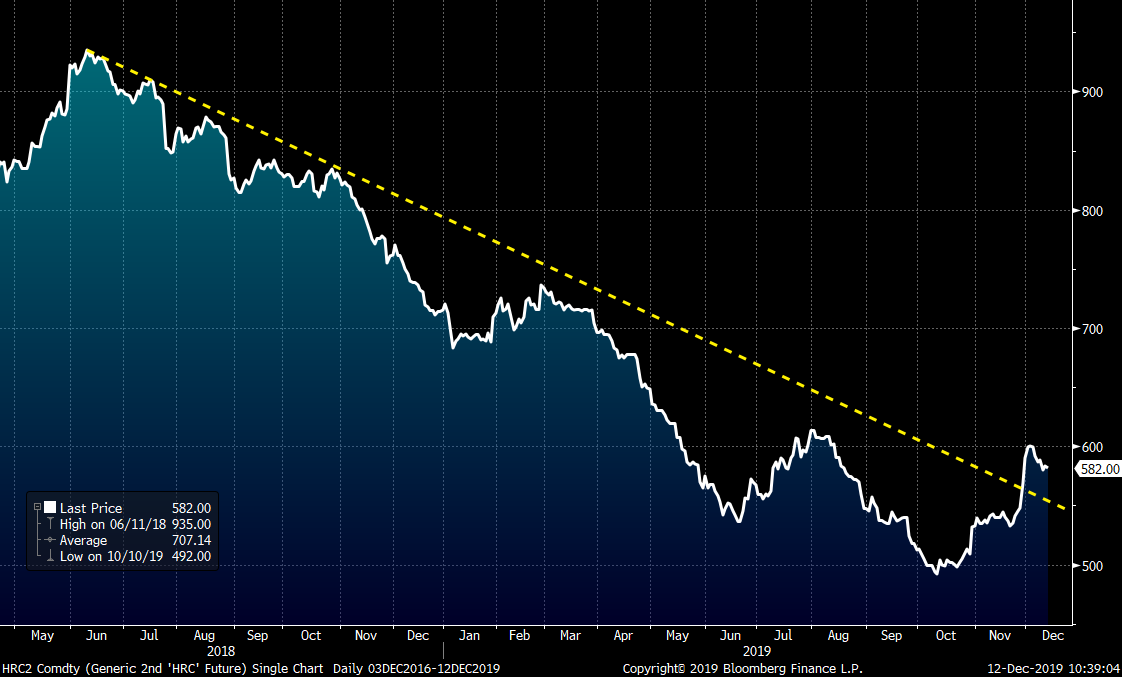
The bear market that started in July 2018 is over. I use July 2018 as the start of the bear market only in retrospect because at the time, flat rolled markets were unknowingly coming to the end of one of the longest and most explosive rallies in Midwest HRC history. What looks to be occurring now is a shift from the brutally long 16-month bear market to a nascent bull market with the low set in mid-October at $492 on the rolling 2nd month CME Midwest HRC future.
Rolling 2nd Month CME Midwest HRC Future
The collective global economic strength in manufacturing began to fragment at the end of 2017. A discussion of what factors caused this is beyond the scope of this article, but where it started was Europe. As 2018 unfolded, slowing industrial growth moved to Asia and then eventually to the U.S. Throughout this period, slowing growth and destocking brought intense deflationary pressure on a number of asset classes; steel and scrap bore the brunt of it. The chart of the U.S. 10-year Treasury provides a roadmap of this deflation. The 10-year rates peaked last November just above 3.2 percent and steadily fell all year until bottoming in September. The Federal Reserve uses the fed funds rate as a blunt tool to generate or slow growth. Lower rates stimulate the economy and that is exactly what the lower rates have done.
U.S. 10-Year Treasury Rate
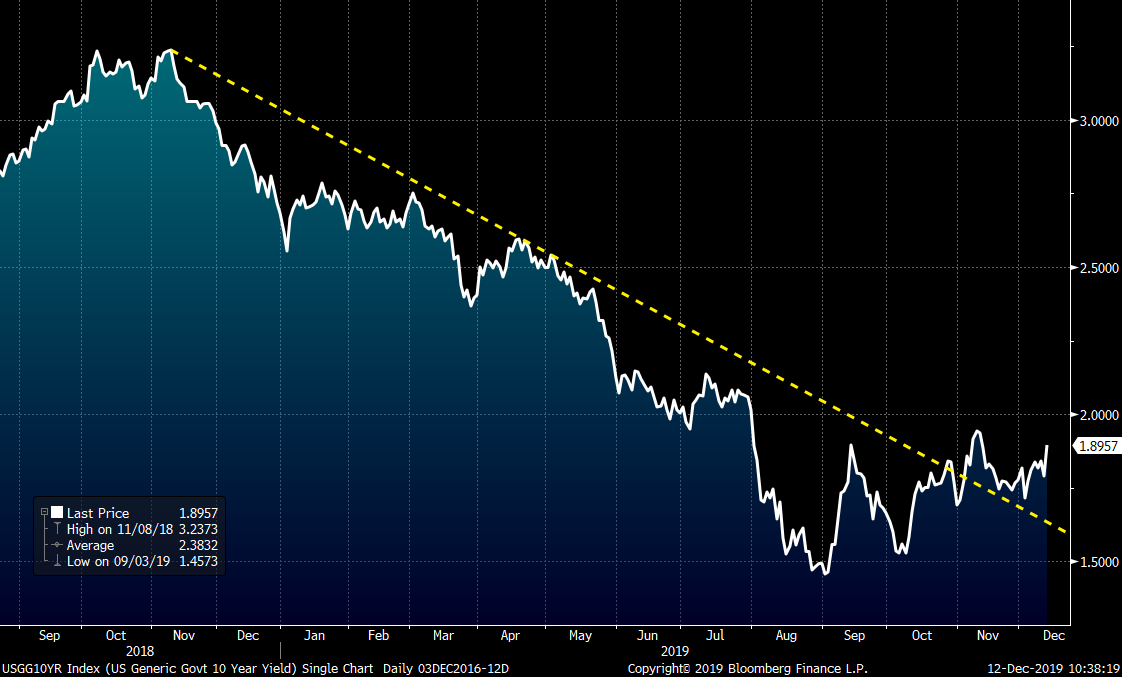
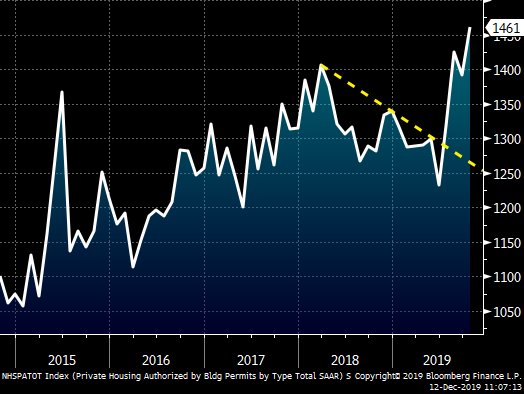
However, the effect of lower rates works with a lag and that effect is starting to manifest itself. The chart pattern seen above in the 10-year rate is similar to the pattern seen in nonfarm payrolls, residential housing, auto sales, hot rolled, scrap, iron ore, copper, oil, etc. The arrows are all pointing in the same direction. For instance, this chart is of U.S. building permits and is not only another example of this pattern, but also indicates a very good spring and summer for residential construction is to come. Look at that spike higher!!
U.S. Building Permits S.A.A.R.
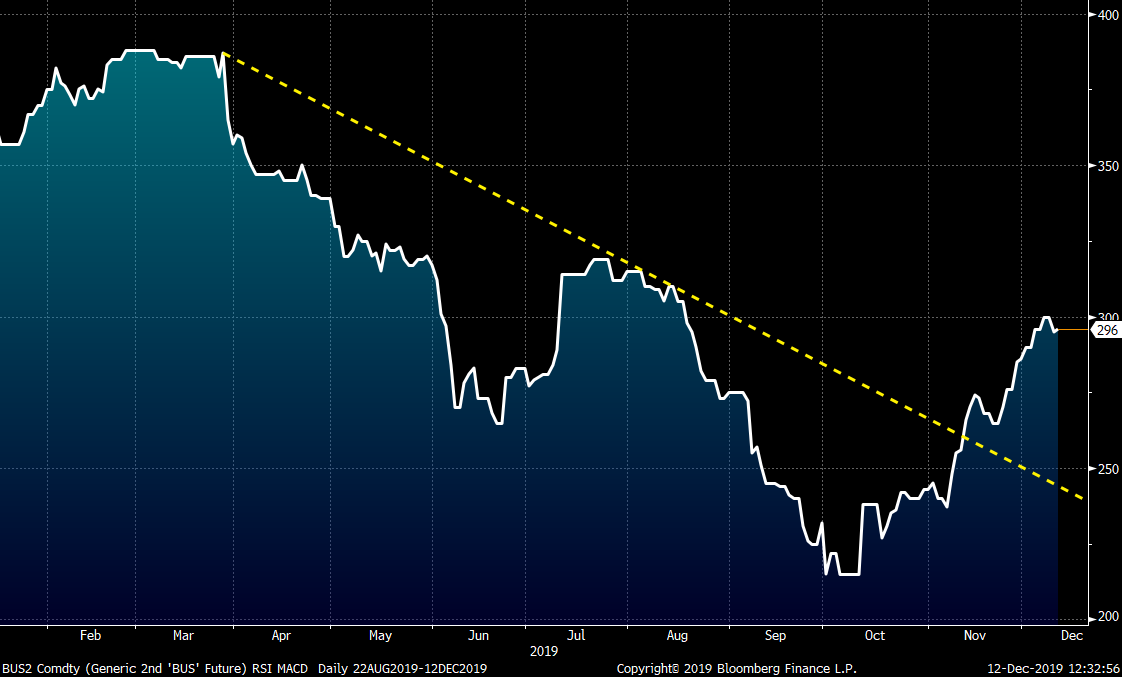
Rolling 2nd month busheling futures now (February) have also participated in the rally from the lows, breaking above their downtrend while trading as high as $300 last week.
Rolling 2nd Month CME Busheling Future
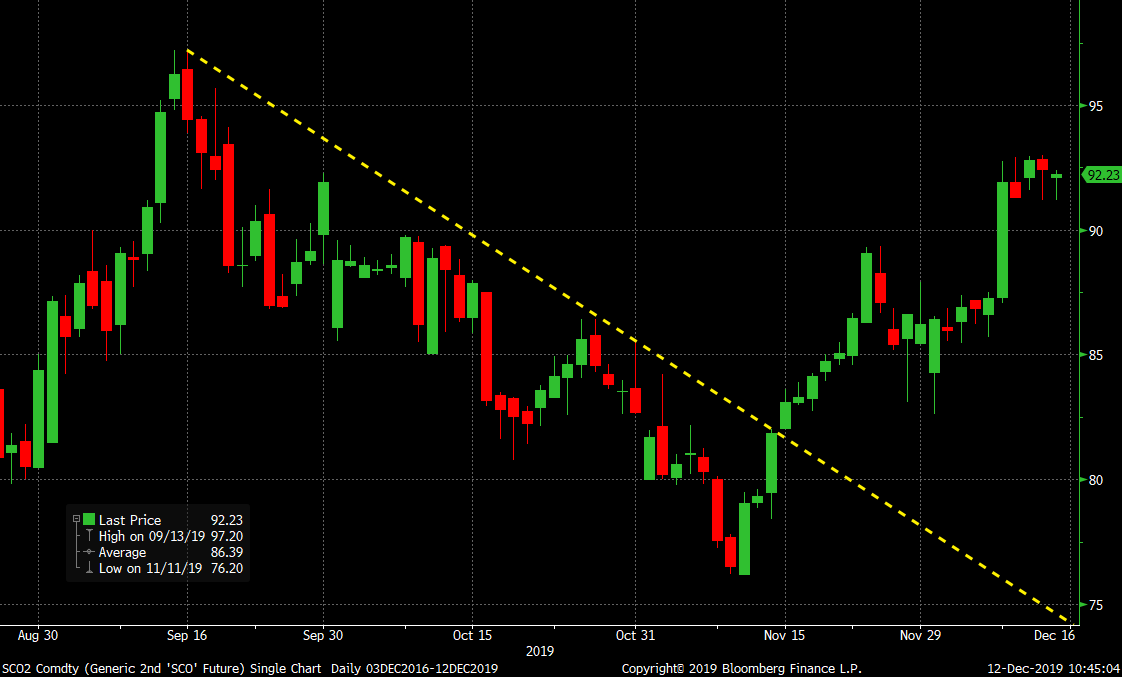
Iron ore was the first product to break through its downtrend and it broke above it with authority. This is a candlestick chart of the rolling 2nd month SGX iron ore future. Candlestick charts show the opening and closing prices. If the “candle’s” color is green, it means it closed above where it opened (strength). If it is red, it means it closed below where it opened (weakness). On Nov. 12, it opened at $76.20 and then made a higher high for 10 consecutive days to close at $86.30 on Nov. 25. The price action in ore has been the kind you see in a bull market. Large up days accompanied by quiet, flat and down days.
Rolling 2nd Month SGX Iron Ore Future
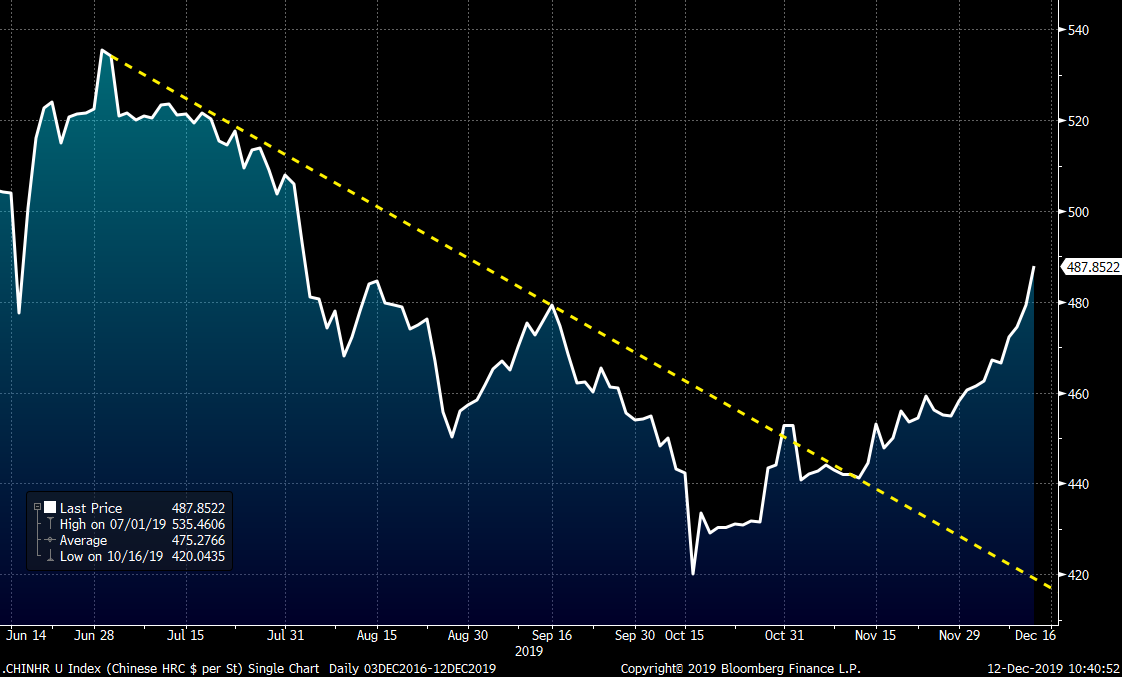
Chinese HRC followed ore’s lead higher and has rallied $67/st off its low of $420/st ending today at $487/st. The strength in the price action of these products left me wondering if China’s government was stimulating their old economy.
Rolling 2nd Month SHFE Chinese Hot Rolled Coil Future USD/st
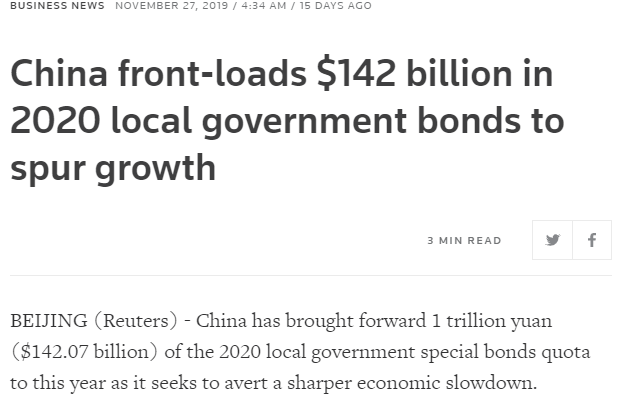
On the day before Thanksgiving, China announced it had brought forward $142 billion of 2020 spending into Q4 to stimulate the economy. China is fighting the trade war with their bread and butter play; infrastructure spending. What’s interesting about $142 billion is it is equal to one trillion yuan, and one trillion yuan is just as much a message as anything else. An old and favorite tactic of the Chinese, the government is sending a signal that there will be more spending to encourage speculation.
In 2016, prices in Chinese HRC exploded higher from $275/st in mid-February to $450/st by mid-April. Midwest HRC followed shortly after rallying from $400 in March to $625 by June. Keep an eye on China.
The domestic landscape has shifted over the course of the year. At this time last year, flat rolled exports had decreased by about as much as flat rolled imports decreased, having little net effect. One could argue the net zero effect was even more negative on Midwest pricing as tons that would have been otherwise exported remained in the Midwest. This can be evidenced by the compression in the differential between the Midwest and Houston hot rolled prices.
However, things have changed dramatically since then. Last week, October export data showed a massive drop in net imports (imports minus exports) YoY. This first table shows the year-over-year change in tons and on a percentage basis for October for the following categories:
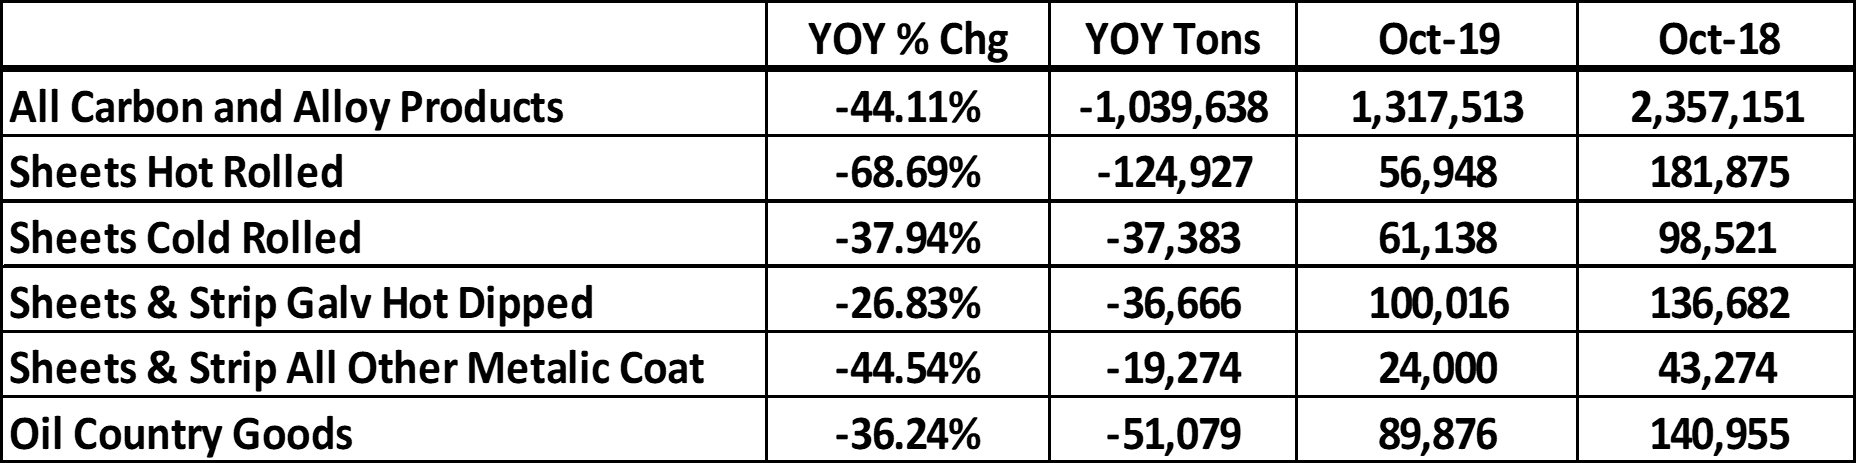
Year over year, October net imports of HR + CR + HDG + AZ/AL is down almost 220k. Annualized that is 2.6m tons or the annual capacity of Nucor Berkeley.
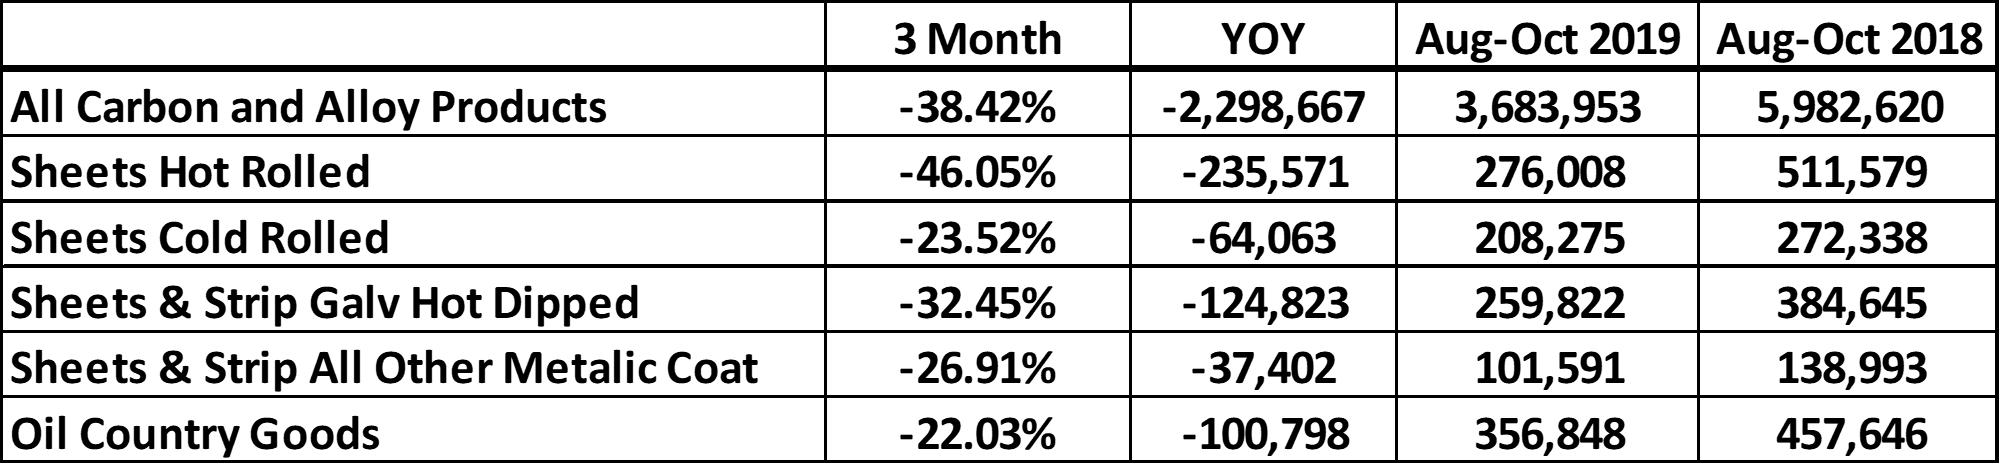
This table adds the three months from August through October. HR + CR + HDG + AZ/AL total a 462k ton year-over-year decrease over the same three-month period; annualized they total over 1.8m, close to the capacity of Big River (1.5m), Gallatin (1.6m) and North Star BlueScope (2.1m). Consider the effect of one of those mills being shut down.
Another bullish supply side data point, service center inventory has fallen to the lowest level since Q2 2010.
At the beginning of this year, prices were at $700 with Nucor raising prices and futures trading as high as $750. Things changed abruptly and they can change abruptly again. Nothing is certain, but keep in mind we are in a nascent bull market. Perhaps prices test the $520 area once more. Perhaps we remain in a range as in 2017. Perhaps China goes berserk again as in 2016. Keep an open mind as things are changing very fast and “if you don’t stop and take a look around once in a while, you could miss it.”
Happy holidays until we meet again in 2020!!!


