

Market Data

July 15, 2015
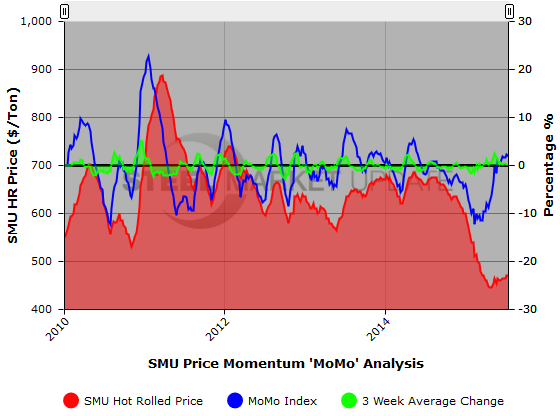
SMU HR Price MoMo Index and 3 Week Average Change
Written by Brett Linton
The Steel Market Update (SMU) Price MoMo Index for hot rolled steel in the United States was positive (indicating higher prices) for the eighth consecutive week. This follows a 39 week negative streak (falling prices). MoMo, a trailing indicator, is measured as a percentage and shows the relation of the current U.S. hot rolled coil (HRC) price movements against the previous 12-week average spot price as recorded by Steel Market Update. A positive MoMo index indicates hot rolled steel prices are increasing, while a negative index indicates a decline in prices.
MoMo should not be confused with the SMU Price Momentum Indicator which is a forward looking indicator and is currently pointing toward higher pricing over the next 30 to 60 days.
MoMo was measured at 1.81 percent this week, meaning that the current HRC price is higher than the average price over the last 12 weeks.
The change in MoMo can be a useful indicator in depicting the severity of price movements and evaluating the directional trend for flat rolled steel prices. The week-over-week change in MoMo was -0.46 percent, following a change of +0.67 percent last week. This negative change indicates that the movement in hot rolled prices is decelerating in comparison to the previous week.
To get a wider sense of the change in the MoMo Index, we calculate a 3-week average change. The 3-week average change in the MoMo Index is +0.04 percent, following a change of +0.16 percent the week before. This shows that the movement in hot rolled prices is ever so slightly accelerating when viewed over a longer period.
The graph below demonstrates the relationship between the SMU hot rolled coil price, the SMU Price MoMo Index, and the three week moving average change in the MoMo Index. Published in our Tuesday evening issue, the SMU HRC price range for this week is $460-$480 per ton with an average price of $470, unchanged from last week.
SMU Note: You can view the graphic on our Price MoMo Index below, but to use its interactive capabilities you must read this article in the Steel Market Update website. If you need any assistance, contact us at info@SteelMarketUpdate.com or 800-432-3475.
{amchart id=”138″ SMU HR Price MoMo Index and 3 Week Average Change – Prices Pricing Hot Rolled}


