

Market Data

June 2, 2016
Key Market Indicators - May 31, 2016
Written by Peter Wright
An explanation of the Key Indicators concept is given at the end of this piece for those readers who are unfamiliar with it.
![]() The total number of indicators considered in this analysis is currently 34.
The total number of indicators considered in this analysis is currently 34.
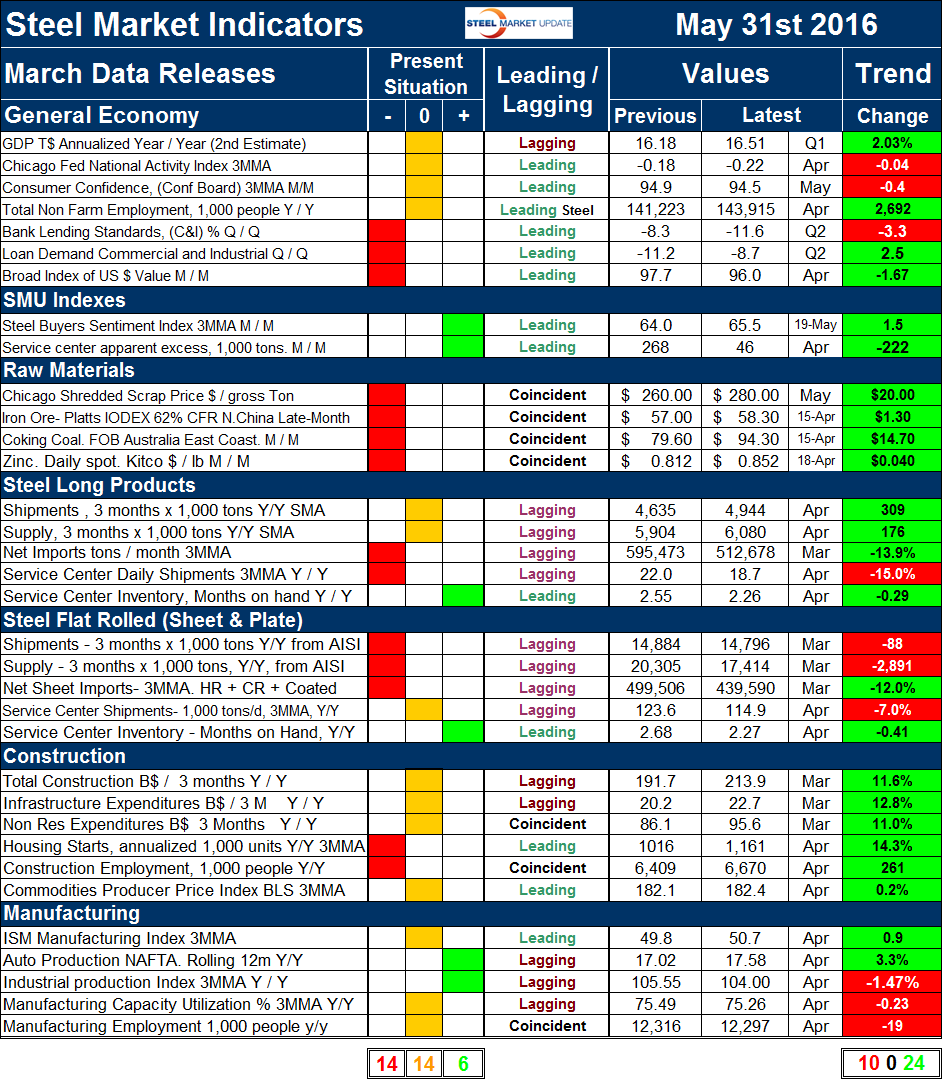
Please refer to Table 1 for the view of the present situation and the quantitative measure of trends. Readers should regard the color codes in the present situation column as a quick look at the current market condition. The “Trend” columns of Table 1 are also color coded to give a quick visual appreciation of the direction in which the market is headed. All data included in this table was released in May, the month or specific date to which the data refers is shown in the second column from the far right and all data is the latest available as of May 31st.
Present Situation
There was a decrease of one negatives since we last published this review on March 31st and an increase of one positive. We currently regard 6 of the 34 indicators to be positive, 14 to be neutral and 14 to be negative on a historical basis. The present situation of the general economy with the exception of loan demand and the value of the US $ is OK. Not great and not unsatisfactory by historical standards. Last week’s update of the growth of GDP in Q1 was revised up from the first estimate. All the raw materials prices currently have a negative present situation. Shipments and supply of long products through April based on SMA data were looking better than for flat rolled through Mach based on AISI data. (AISI reports lag the SMA).
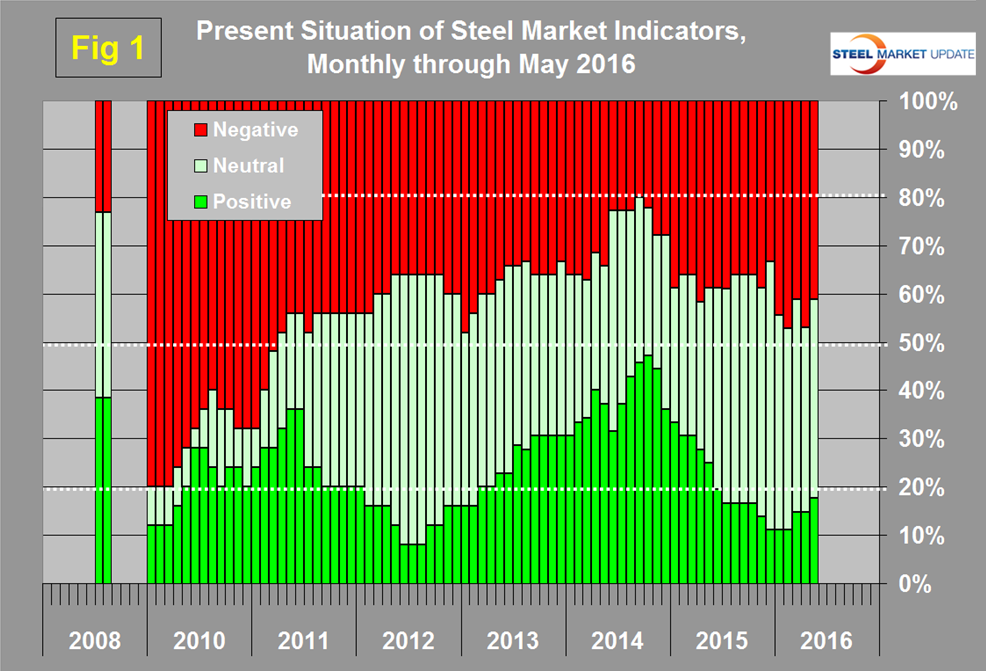
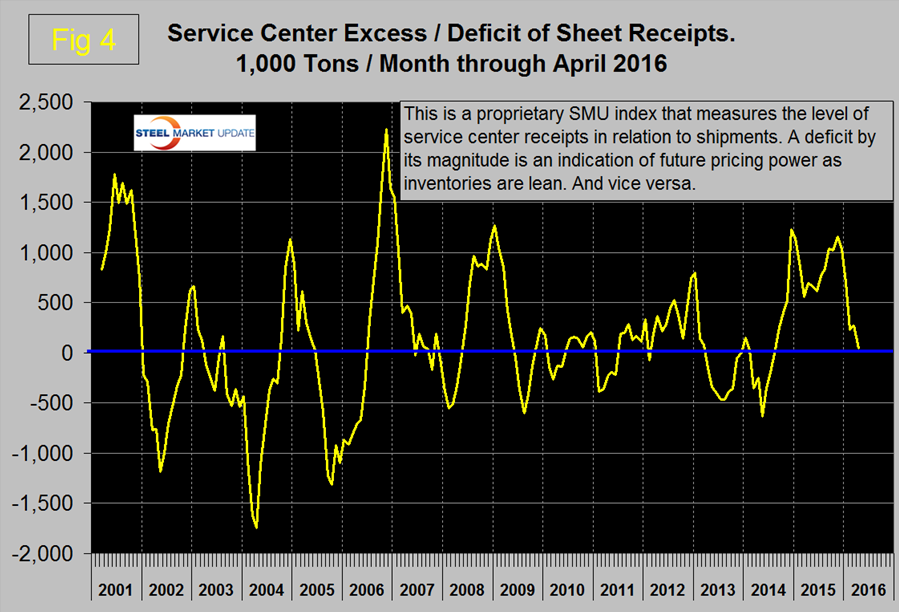
Changes since the last update were as follows: Bank lending standards for commercial and industrial loans were revised from neutral to negative as banks tightened their lending standards. Service center apparent excess declined sharply as shown in the graph below and was revised from neutral to positive. Shipments of long products were revised from negative to neutral as volume in 3 months through April exceeded 4.5 million tons for the first time since the recession. Service center shipments of flat rolled products were revised from negative to neutral as volume exceeded 110,000 tons. There was no change in our perception of any of the construction and manufacturing indicators. Figure 1 shows the change in our assessment of the present situation since January 2010 on a percentage basis. The number of indicators classified as positive peaked at 47.2 percent in October 2014 and steadily declined to 11.1 percent in the three months through last December. By May 31st the positives had risen to 17.6 percent. Through the course of 2015 there was not much change in the number of indicators that we considered to be historically negative, what happened was that the decline in the positive indicators occurred as a shift to neutral.
Trends
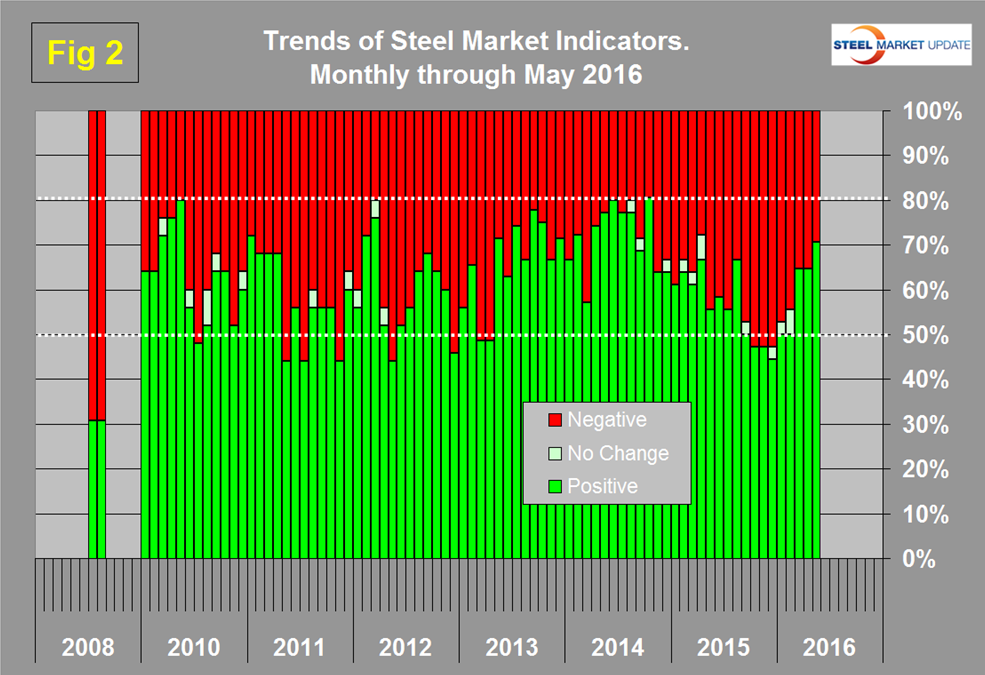
The proportion of indicators trending positive through May 31st was 70.6 percent with 29.4 percent trending negative. There has been a tremendous surge in positives since December when only 44.4 percent of indicators were trending positive. Most values in the trends columns are three month moving averages (3MMA) to smooth out what can be very erratic monthly data. Figure 2 shows the trend of the trends. In October 2014 the proportion trending positive was 80.6 percent which coincided with the highest month of total steel supply since the recession. There was a steady deterioration through 2015. At the end of 2015 the proportion trending positive fell below 50 percent for the first time since March and April 2013. Figure 2 shows the pre-recession situation at the far left of the chart. In August 2008 over 2/3 (69.2 percent) of our indicators were trending negative and the steel market crashed in September of that year.
Changes in the individual sectors since our last update on March 31st are described below. Please note in most cases this is not May data but data that was released in May through the 31st for previous months.
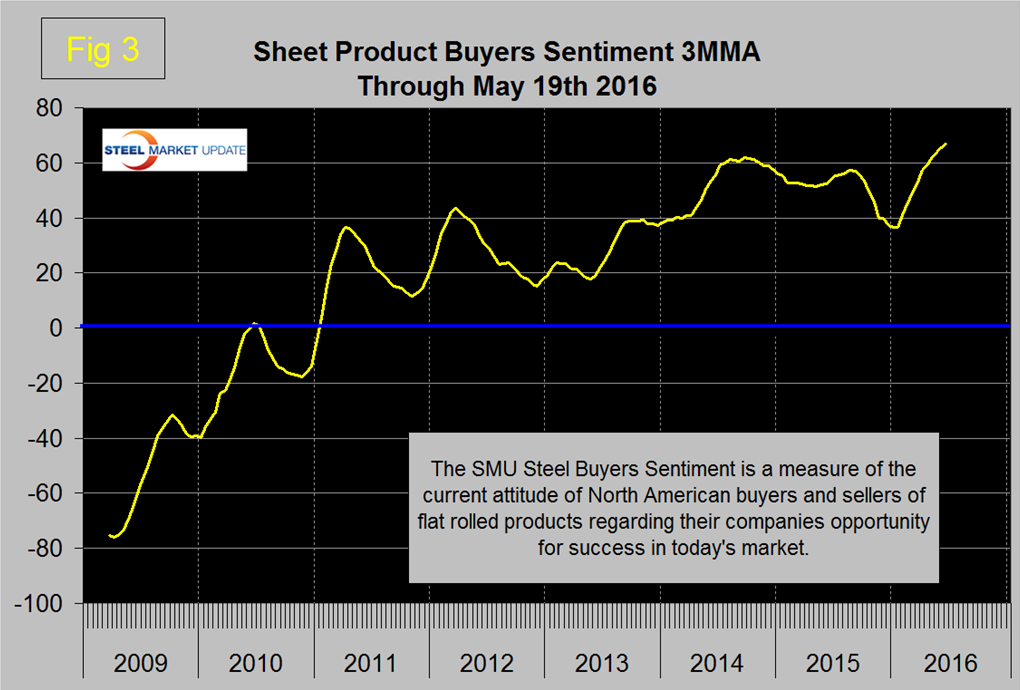
In the general economy, the direction of the Conference Board consumer confidence index and of the Chicago Fed National Activity Index both reversed course and became slightly negative on a 3MMA basis. Even as banks tightened lending standards, demand for commercial and industrial loans strengthened and began to trend positive. Both of the Steel Market Update proprietary indices have been trending positive since our December 31st update. The SMU buyer’s sentiment index at 65.5 on May 19th was at an all-time high since its inception in 2009 as shown in Figure 3.
The calculation of service center excess inventory of sheet products has declined from over a million tons in the last four months of 2015 to a mere 46,000 tons in April. A high excess is indicative of low pricing power therefore we regard this trend as extremely positive (Figure 4).
In the raw materials price section all are now trending positive which has been a major turnaround since July last year when all were trending negative.
In the long product section both shipments and supply have reversed direction and trended positive in the latest data. In the flat rolled section the only change was in net imports which declined, therefore trended positive in March (the latest month for which this can be calculated.) In the construction section all indicators are now flashing green as commodity prices reversed direction and rose in the April PPI data from the Bureau of labor Statistics. This contrasts with manufacturing where three of five indicators are now in retreat. In the April manufacturing employment date there was a reversal to contraction for the first time since February 2010.
Trends in the May data continue to be very encouraging and are accelerating. This series is relatively stable therefore based on the last three months data we conclude that the improvement is for real and that a positive shift in the market is occurring.
We believe a continued examination of both the present situation and direction is a valuable tool for corporate business planning.
Explanation: The point of this analysis is to give both a quick visual appreciation of the market situation and a detailed description for those who want to dig deeper. It describes where we are now and the direction in which the market is headed and is designed to give a snapshot of the market on a specific date. The chart is stacked vertically to separate the primary indicators of the general economy, of proprietary Steel Market Update indices, of raw material prices, of both flat rolled and long product market indicators and finally of construction and manufacturing indicators. The indicators are classified as leading, coincident or lagging as shown in the third column.
Columns in the chart are designed to differentiate between where the market is today and the direction in which it is headed. Our evaluation of the present situation is subjectively based on our opinion of the historical value of each indicator. There is nothing subjective about the trends section which provides the latest facts available on the date of publication. It is quite possible for the present situation to be predominantly red and trends to be predominantly green and vice versa depending on the overall situation and direction of the market. The present situation is sub-divided into, below the historical norm (-) (OK), and above the historical norm (+). The “Values” section of the chart is a quantitative definition of the market’s direction. In most cases values are three month moving averages to eliminate noise. In cases where seasonality is an issue, the evaluation of market direction is made on a year over year comparison to eliminate this effect. Where seasonality is not an issue concurrent periods are compared. The date of the latest data is identified in the third values column. Values will always be current as of the date of publication. Finally the far right column quantifies the trend as a percentage or numerical change with color code classification to indicate positive or negative direction.


