

Market Data

June 22, 2017
Steel Mill Lead Times Inching Up?
Written by Tim Triplett
Steel mill flat rolled lead times, which have generally trended downward this spring, my be showing early signs of lengthening, reflecting new strength in demand for domestic steel products. Mills were successful in collecting a price increase earlier in the month. Despite SMU data that shows service center inventories at “comfortable” levels, some distributors may be shifting purchases to domestic suppliers, buying ahead of a Section 232 ruling that could further restrict steel imports into the United States on national security grounds. SMU will continue to watch this carefully in the days and weeks ahead.
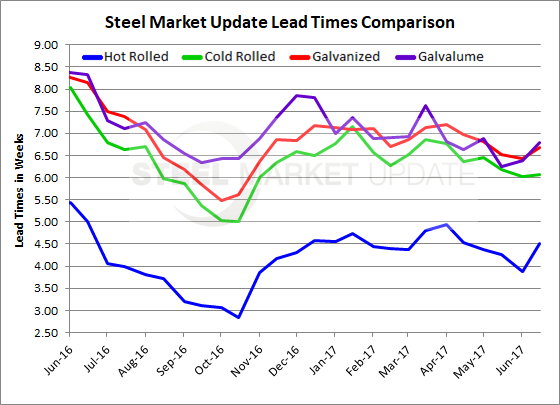
![]() Hot rolled lead times currently average around 4.50 weeks, up from up from 3.88 weeks at the beginning of June and 4.26 weeks a month ago. One year ago, HRC lead times were 5.00 weeks.
Hot rolled lead times currently average around 4.50 weeks, up from up from 3.88 weeks at the beginning of June and 4.26 weeks a month ago. One year ago, HRC lead times were 5.00 weeks.
Cold rolled lead times remained largely unchanged from the beginning of the month at about 6.06 weeks, down slightly from 6.19 weeks this time last month, and from 7.42 weeks at this time a year ago.
Galvanized lead times average 6.68 weeks, up from 6.42 weeks on June 1 and 6.51 weeks a full month ago. One year ago, GI lead times averaged 8.15 weeks.
In Galvalume, lead times average 6.80 weeks, up from 6.38 weeks at the beginning of the month and 6.25 weeks a month ago. One year ago, AZ lead times were reported to be 8.33 weeks.
Note: These lead times are based on the average from manufacturing and steel service centers who participated in this week’s SMU market trends analysis. Our lead times do not predict what any individual may get from any specific mill supplier. Look to your mill rep for actual lead times. Our lead times are meant only to identify trends and changes in the marketplace.


