

Market Data

January 26, 2020
SMU Steel Buyers Sentiment Index: Optimism's Recovering
Written by Tim Triplett
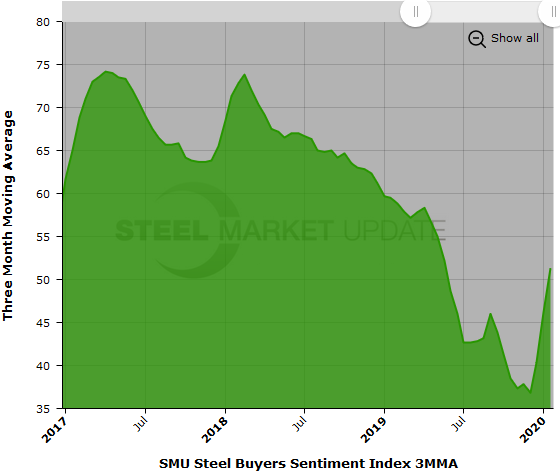
Steel buyers sentiment continued to improve through mid-January with Steel Market Update’s Current Sentiment Index registering +63, its highest reading since November 2018. Sentiment has been on the rise since October when it hit a low of +26, its most pessimistic reading since June 2013. (Historical low was in March 2009 when it hit -85.)
The goal of SMU’s index is to measure how buyers and sellers of steel feel about their company’s ability to be successful today (Current Sentiment Index), as well as three to six months into the future (Future Sentiment Index). Results from SMU’s market trends questionnaire this week are posted as both single data points and as three-month moving averages (3MMAs) to smooth out the trend.
As a single data point, the Current Sentiment reading of +63 is up 13 points from a month ago, and is 37 points higher than its low point three months earlier. Measured as a 3MMA, Current Sentiment is at +51.33, up from +40.33 a month ago, but still below the +59.50 at this time a year ago.
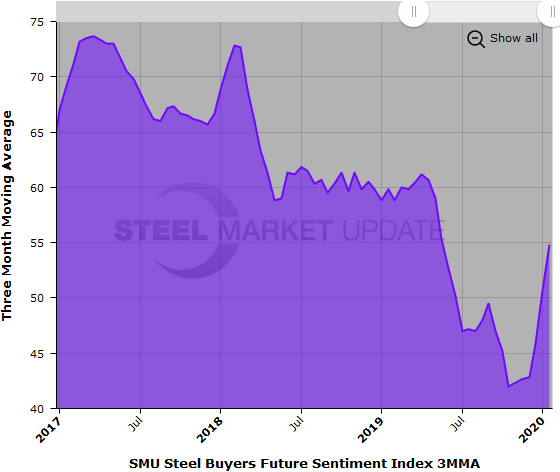
Future Sentiment
Future Sentiment as a single data point also registered +63 in the latest data, up 14 points in the past month. The Future Sentiment 3MMA is +54.83, a big improvement from the six-year low of 42.00 reached in October 2019. At this time last year, the Future Sentiment 3MMA was still higher +59.83.
All the current readings are above zero and on the optimistic half of SMU’s scale, therefore generally positive.
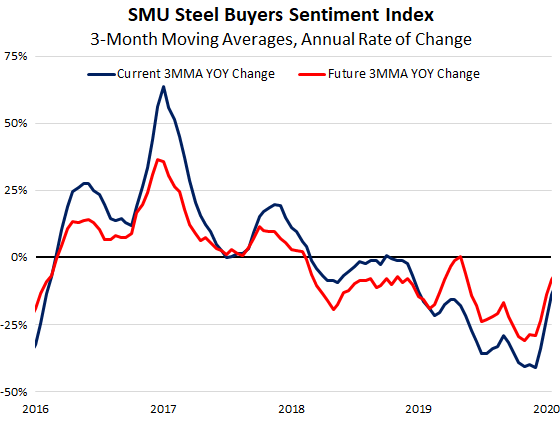
The upturn in sentiment of the past few months can be seen on the right in the chart below, which tracks the annual rate of change in the three-month moving averages.
What Respondents Had to Say
“Demand seems strong and hopefully should trend up with some of the recent trade agreements.” Manufacturer/OEM
“Demand seems to be picking up after some very slow months.” Service Center
“I’m still optimistic about 2020 overall, but more likely in Q3 and Q4.”Manufacturer/OEM
“Business has started off slower than expected in 2020. Usually January is a strong month; not so this year.” Manufacturer/OEM
“With construction activity picking up and net imports continuing to be suppressed, maybe the demand picture can make the supply/demand balance better this year.” Service Center
“Nothing fundamentally has changed. Section 232 tariffs are still distorting market forces, either by artificially higher input costs or restricted tons.” Trading Company
“Price changes are cyclical and will correct sometime later this year, making imports risky. As usually suppliers and buyers overreact and prices will overshoot realistic and sustainable levels, my main business of imports will be considered less.” Trading Company
“Not sure if the mills’ recent radical price increases will keep the market in paralysis until March or April when they will see once again that they were overconfident and arrogant in thinking they could raise steel prices $190/ton in less than 90 days!” Service Center
About the SMU Steel Buyers Sentiment Index
SMU Steel Buyers Sentiment Index is a measurement of the current attitude of buyers and sellers of flat rolled steel products in North America regarding how they feel about their company’s opportunity for success in today’s market. It is a proprietary product developed by Steel Market Update for the North American steel industry.
Positive readings will run from +10 to +100 and the arrow will point to the righthand side of the meter located on the Home Page of our website indicating a positive or optimistic sentiment. Negative readings will run from -10 to -100 and the arrow will point to the lefthand side of the meter on our website indicating negative or pessimistic sentiment. A reading of “0” (+/- 10) indicates a neutral sentiment (or slightly optimistic or pessimistic), which is most likely an indicator of a shift occurring in the marketplace.
Readings are developed through Steel Market Update market surveys that are conducted twice per month. We display the index reading on a meter on the Home Page of our website for all to see. Currently, we send invitations to participate in our survey to more than 600 North American companies. Our normal response rate is 100-150 companies; approximately 40 percent are manufacturers, 45 percent are service centers/distributors, and 15 percent are steel mills, trading companies or toll processors involved in the steel business. Click here to view an interactive graphic of the SMU Steel Buyers Sentiment Index or the SMU Future Steel Buyers Sentiment Index.


