

Market Data

January 26, 2022
Global Steel Production Jumps 10.7% in December
Written by David Schollaert
World crude steel production grew in December, expanding for only the second time in seven months. Steelmakers around the world produced an estimated 158.7 million metric tons of crude steel in December, surging 10.7% or 15.4 million tons from the prior month, according to World Steel Association (worldsteel) data.
Steel production had been trending down since seeing repeated record-breaking output from March through May of last year. The downtrend had been accentuated by aggressive production cuts in China over that period, and December’s gains were no different. Chinese raw steel production grew by 24.4% or 16.9 million metric tons in December versus the prior month.
December’s global total, although the highest mark in five months, was still 9.0% or 15.7 million metric tons below May’s historical high of 174.4 million tons. For the year, world crude steel production in 2021 totaled 1.905 billion metric tons, 3.9% higher than 2020’s total of 1.833 billion metric tons, and 3.5% above 2019’s pre-pandemic total of 1.841 billion metric tons.
The U.S. remained the fourth-largest crude steel producer in the world in December, accounting for 7.2 million metric tons or 4.5% of the global total. U.S. production in December was unchanged from the prior month at 7.2 million metric tons. Compared with the same month last year when the economy was still struggling with COVID disruptions, December’s production was an improvement of 11.9%, but down 1.3% compared to the pre-pandemic period in 2019.
U.S. production for 2021, according to worldsteel, totaled 85.7 million metric tons, 18.0% higher than the same period one year ago but still 2.3% or 2.061 million metric tons behind pre-pandemic levels from 2019.
China produced more than half of the world’s steel, 54.3% or an estimated 86.2 million metric tons in December, as Chinese production was up 24.4% month on month. When compared with December 2020, Chinese production was down 5.5%, yet 2.3% above pre-pandemic levels from 2019.
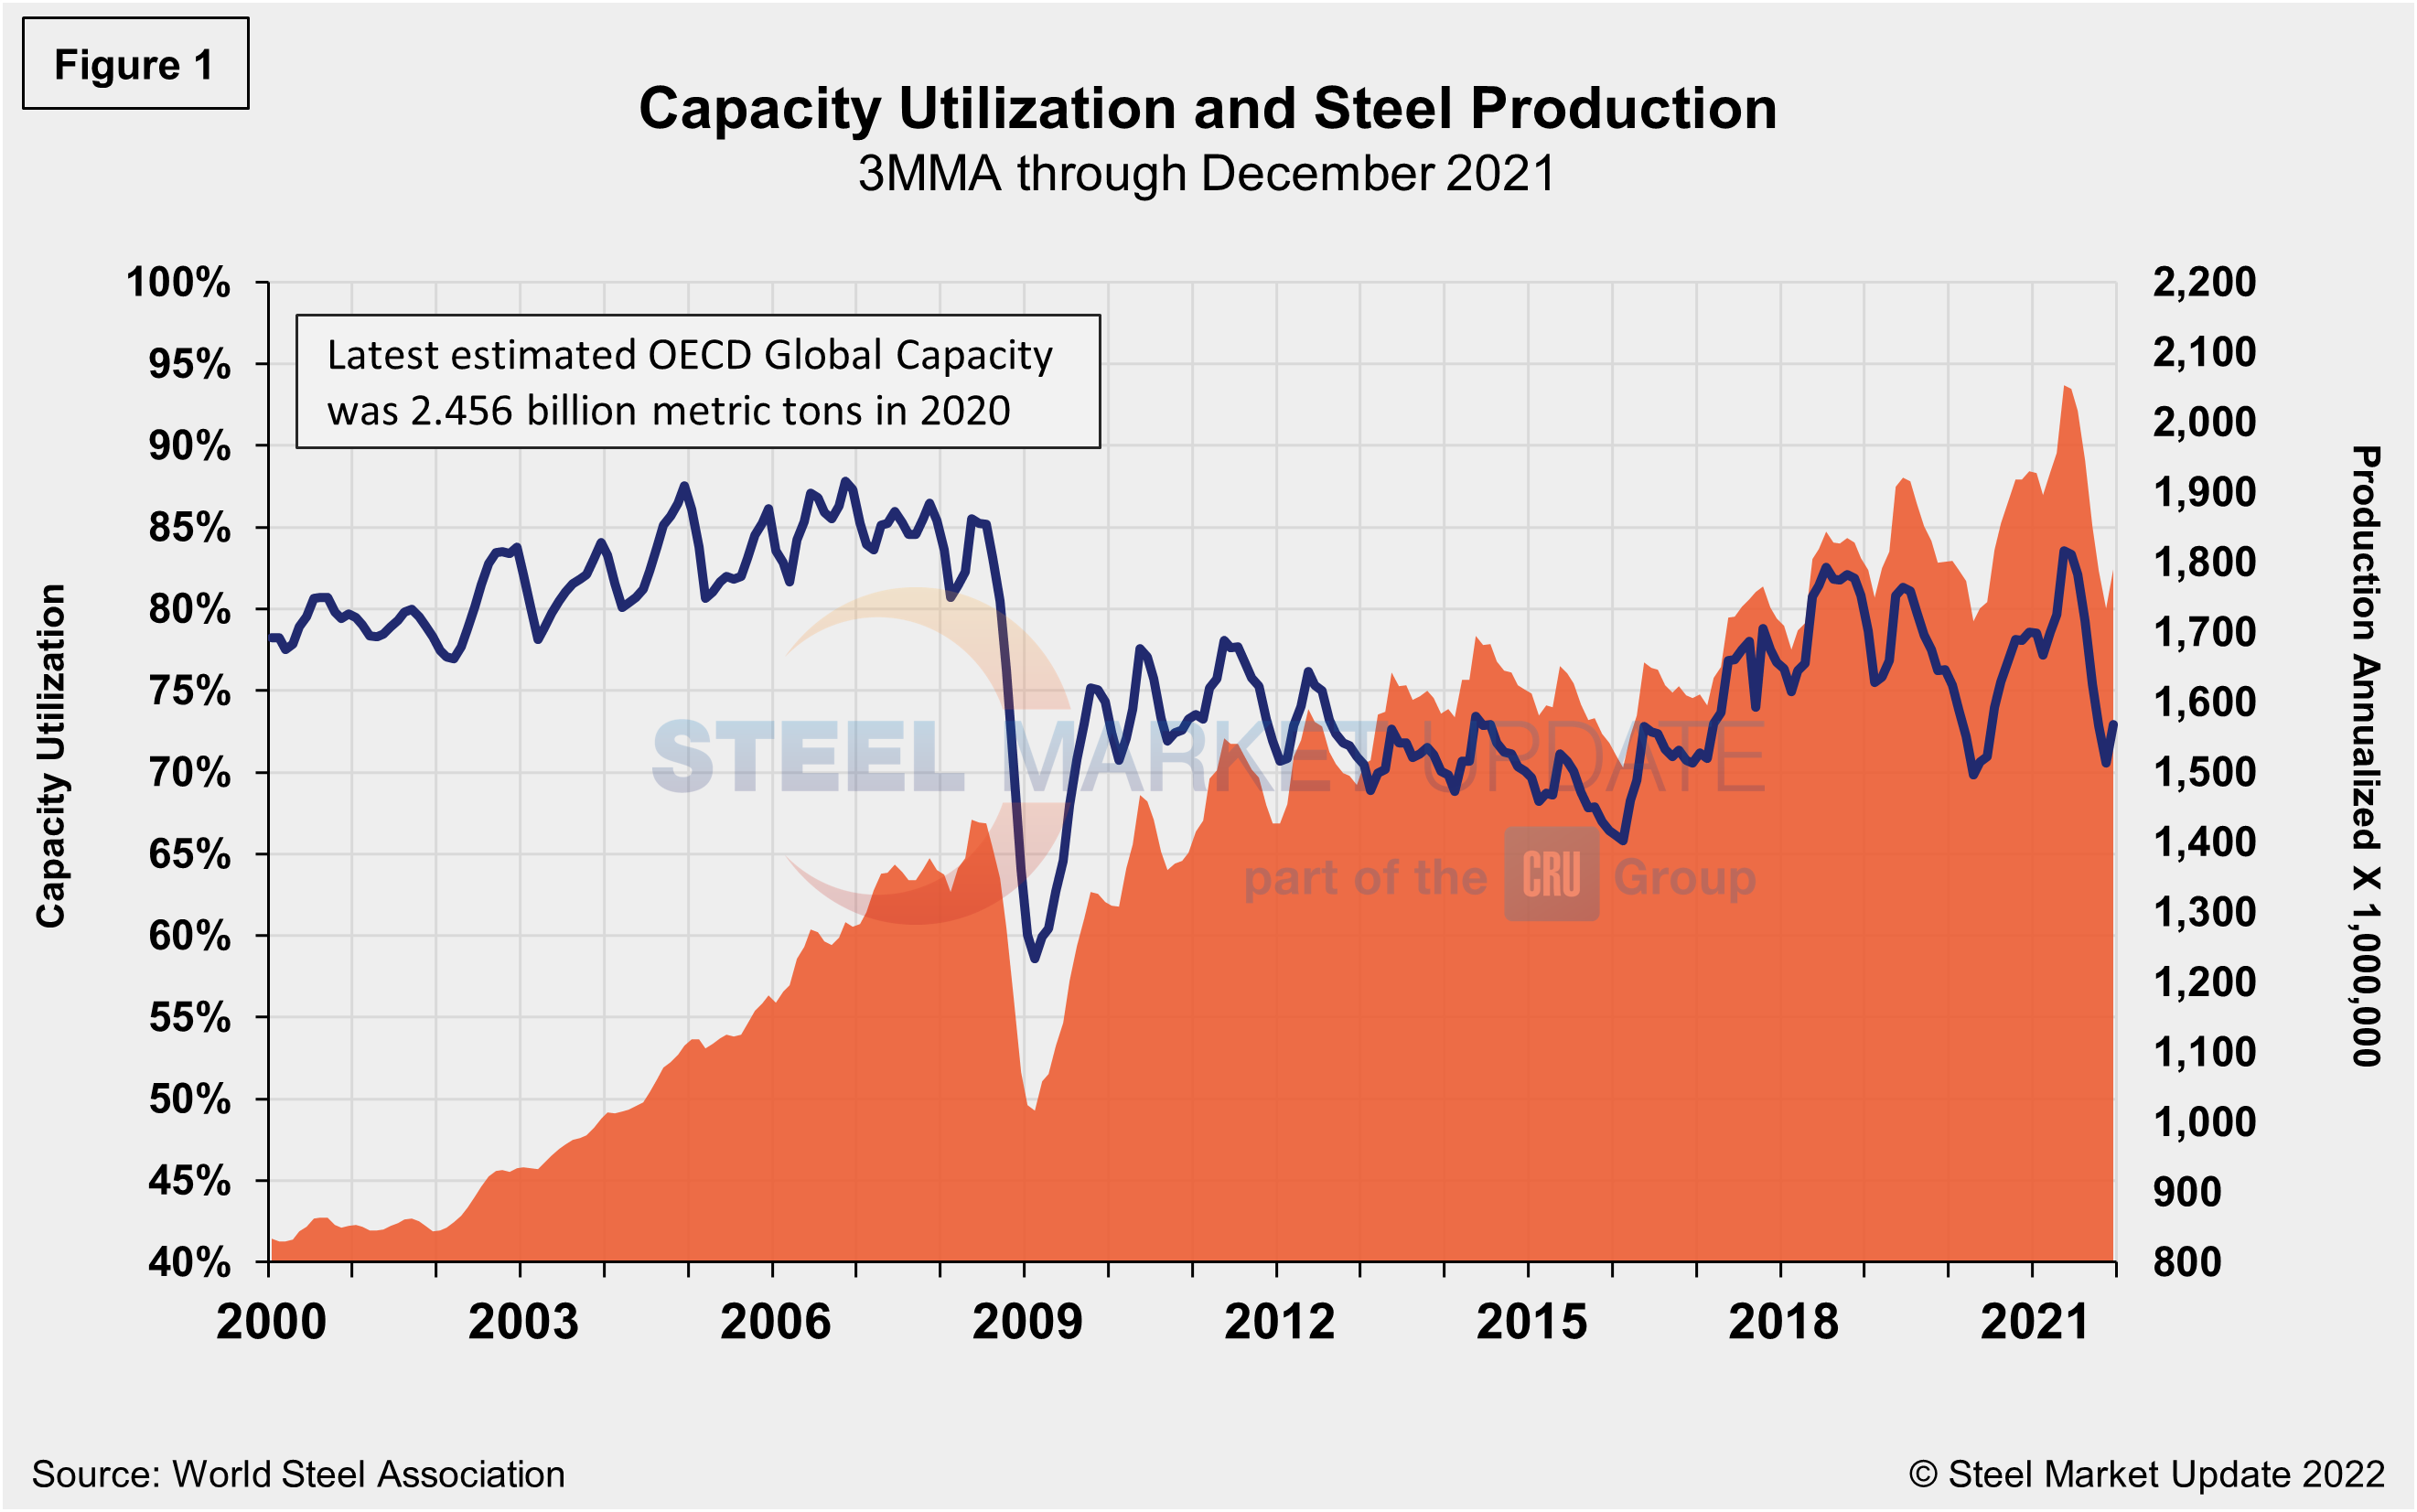
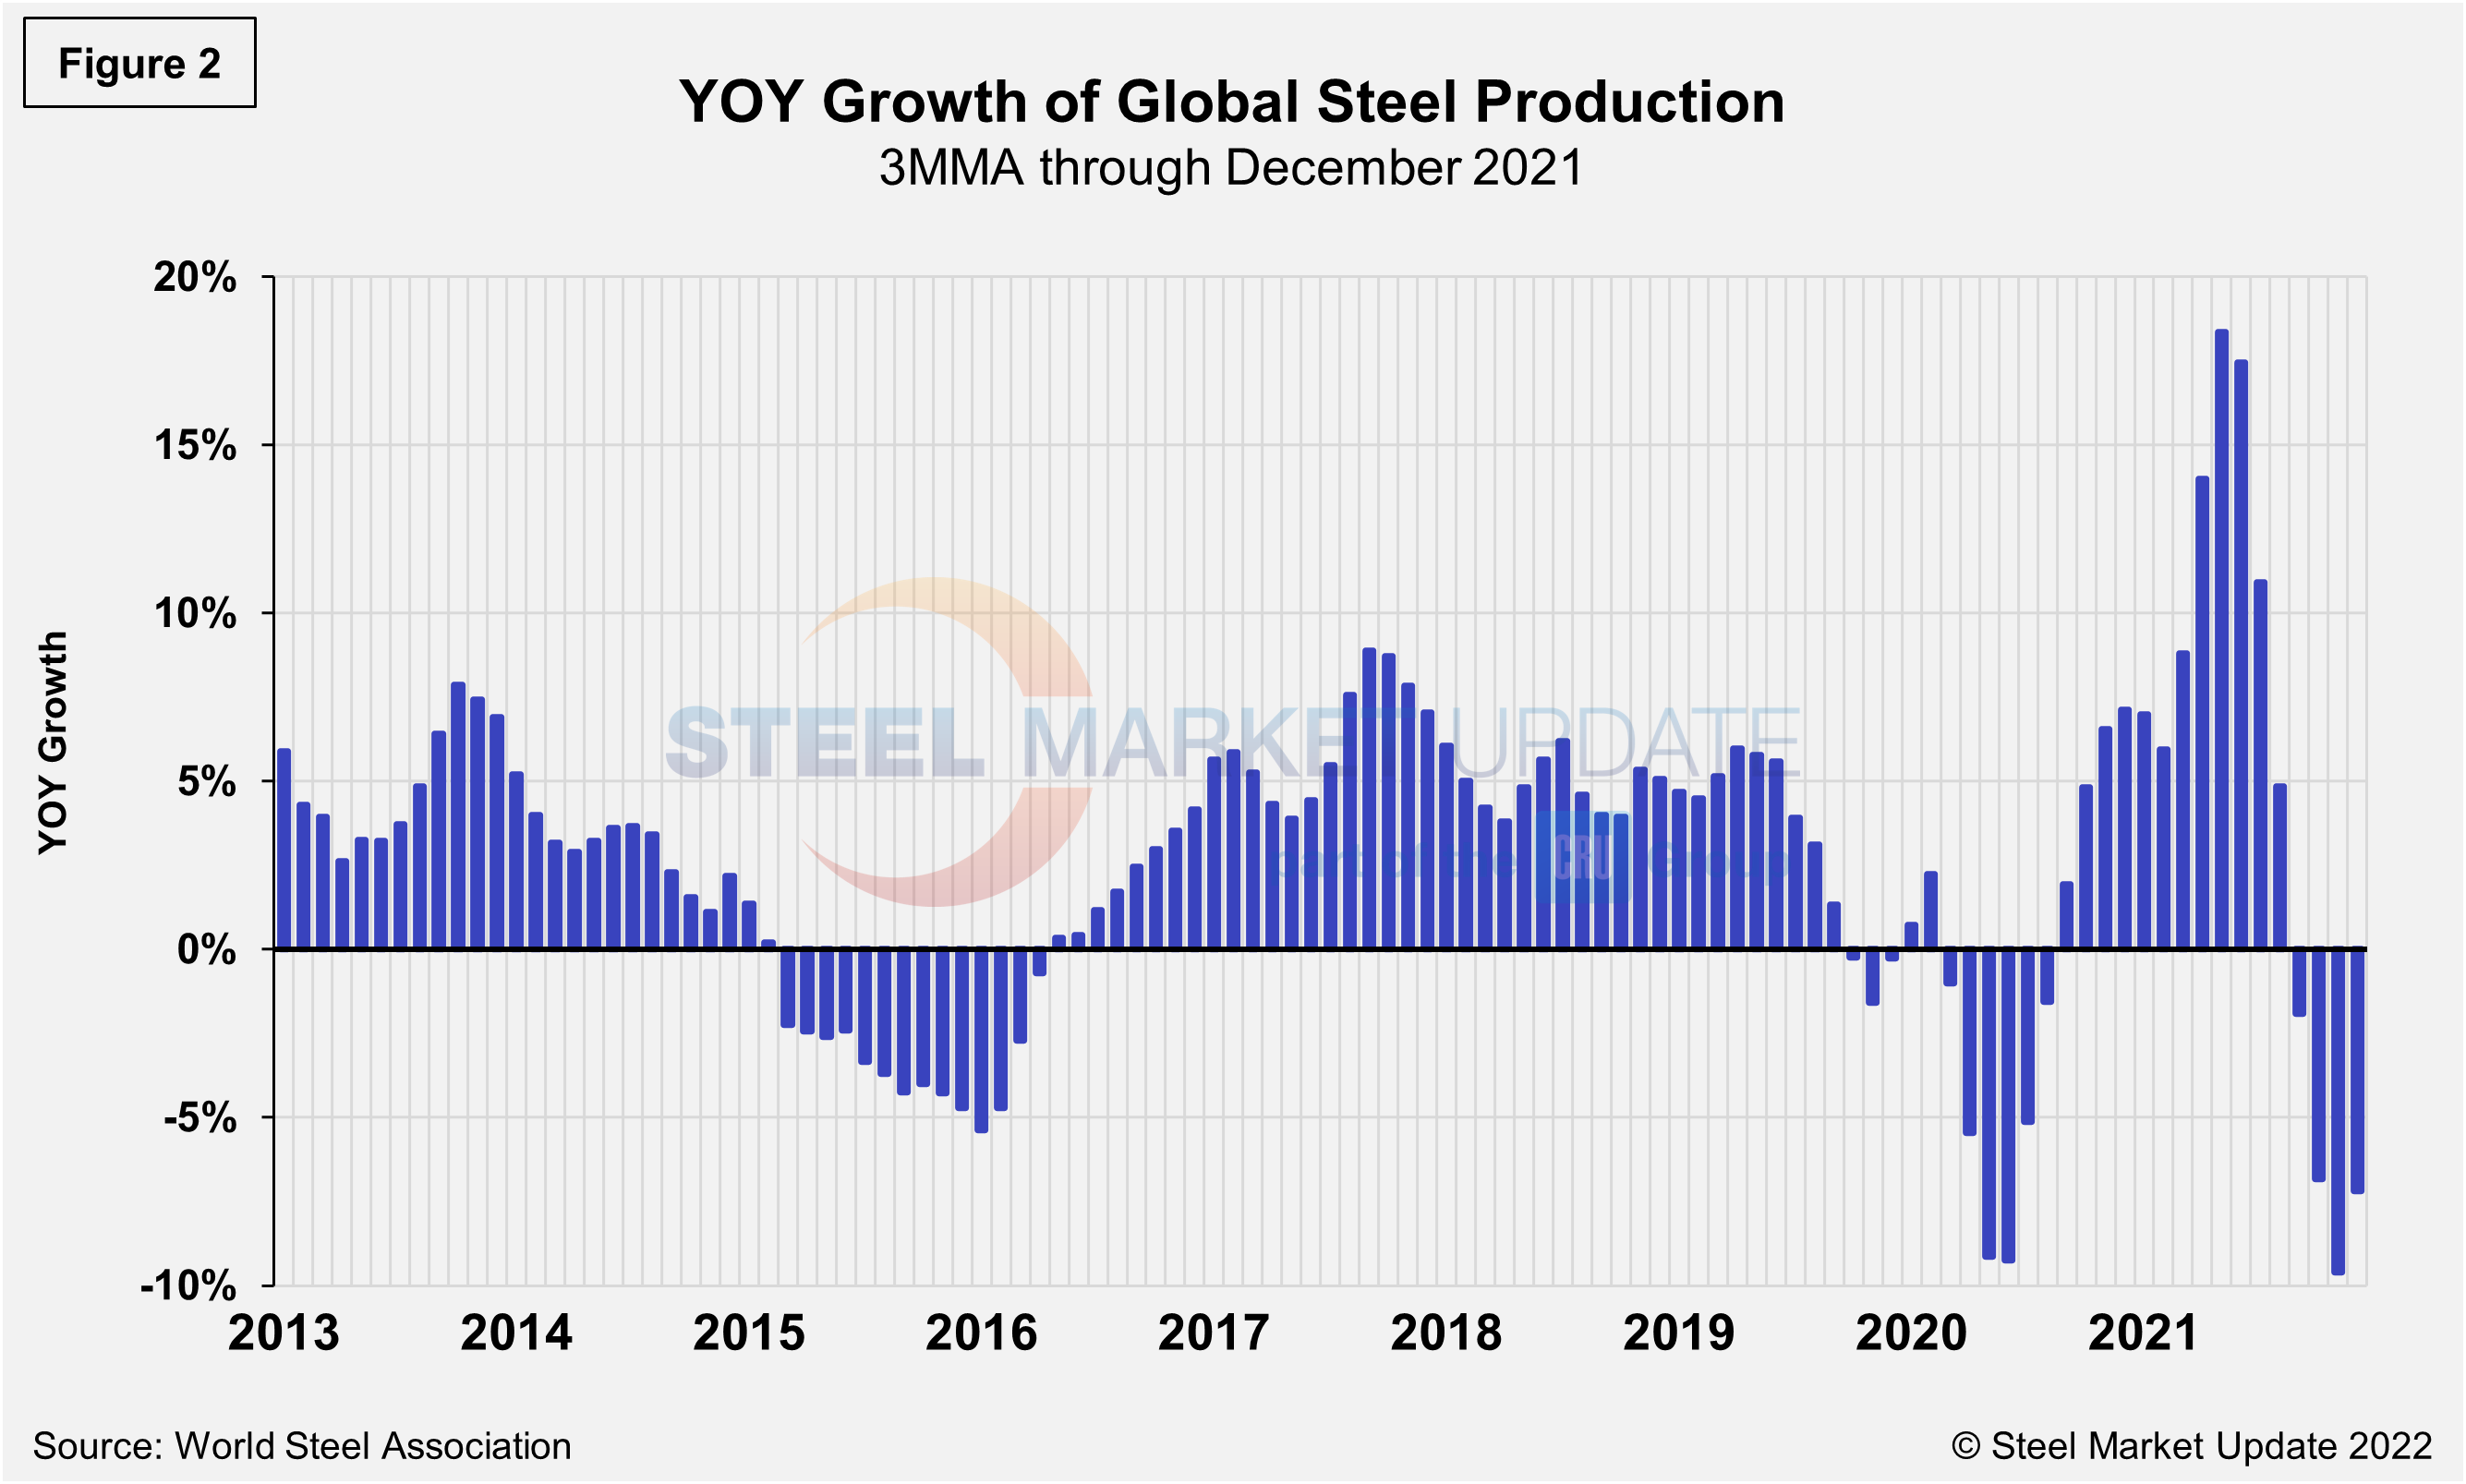
Shown below in Figure 1 is the annualized monthly global steel production on a three-month moving average (3MMA) basis and capacity utilization since January 2000 based on data from worldsteel, while Figure 2 shows the year-over-year growth rate of global production on the same 3MMA basis since January 2013. Mill capacity utilization in December on a 3MMA basis was 72.9%, up 2.3 percentage points from the month prior. On a tons-per-day basis, production in December was 5.119 million metric tons, a 7.2% increase month on month, but nearly 700,000 tons off May’s record rate of 5.813 million metric tons. Growth on a three-month moving average through December on a year-over-year basis was -7.2%, up from -9.6% the month prior but a collapse from the 18.4% expansion seen in May.
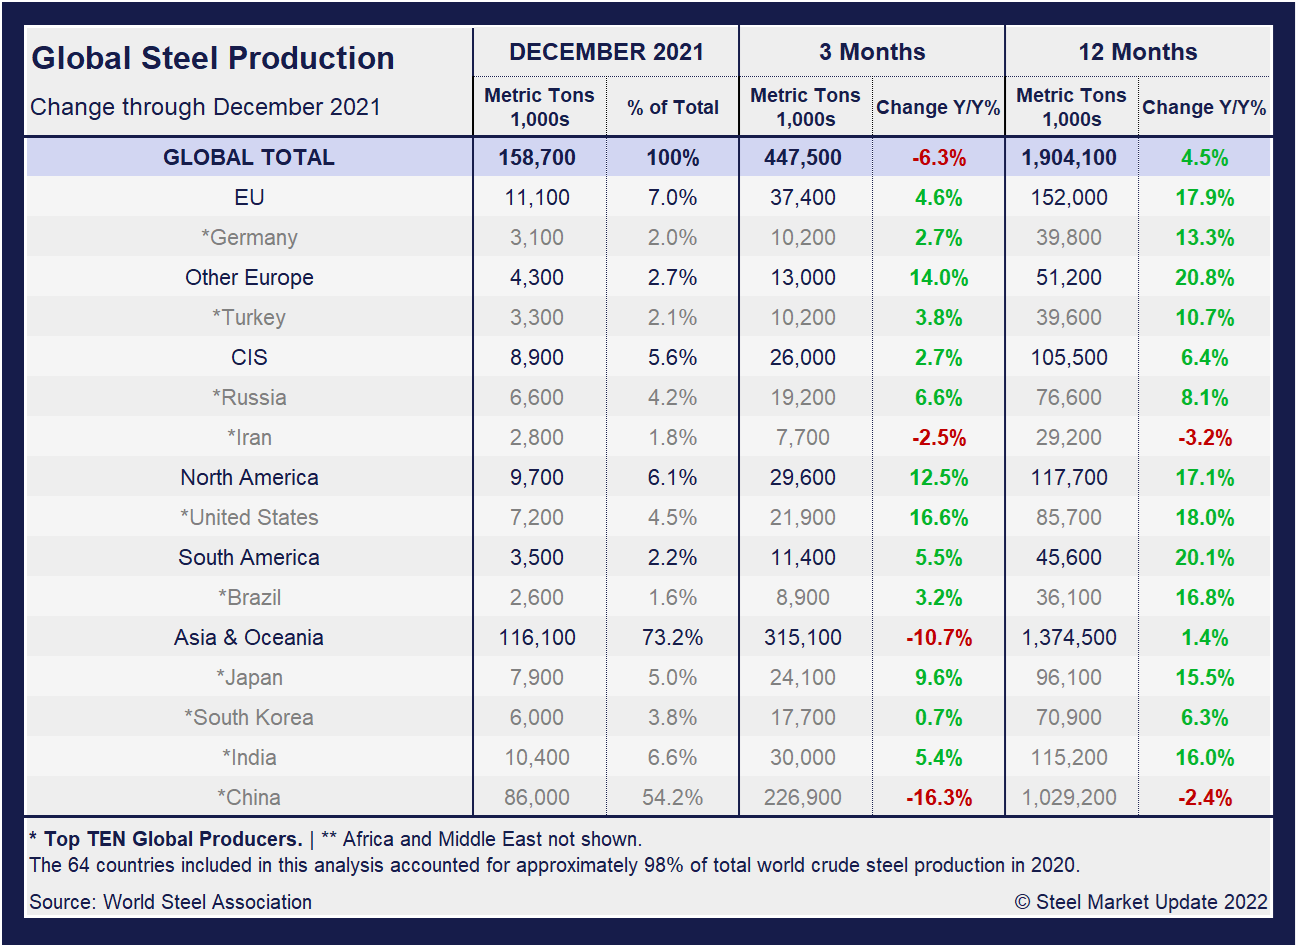
Displayed in the table below is global production broken down into regions, the production of the top 10 nations in the single month of December, and their share of the global total. It also shows the latest three months and 12 months of production through December with year-over-year growth rates for each period. Regions are shown in black font and individual nations in gray. World steel production overall fell 6.3% in three months, a significant deceleration from the 17.9% growth just six months prior. Over 12 months through December, though, growth was 4.5%, down 0.7 percentage points from the same period in November. The market has not maintained positive momentum, as the three-month growth rate has been lower than the 12-month growth rate for five straight months.
The table shows that North American production was up 16.6% in the three months through November, and up 17.1% year on year. The positive momentum in the North American market is significant as the economy continues to battle the pandemic. More importantly, when compared to the same pre-pandemic period in 2019, present output is up 1.6%.
China’s Crude Steel Production
China’s monthly steel production was estimated at 86.2 million metric tons in December, up from 69.2 million metric tons the month prior. The 16.9-million-ton surge month-on-month marks the first increase in seven months since crude steel output in China reached its all-time high of 99.5 million metric tons in May.
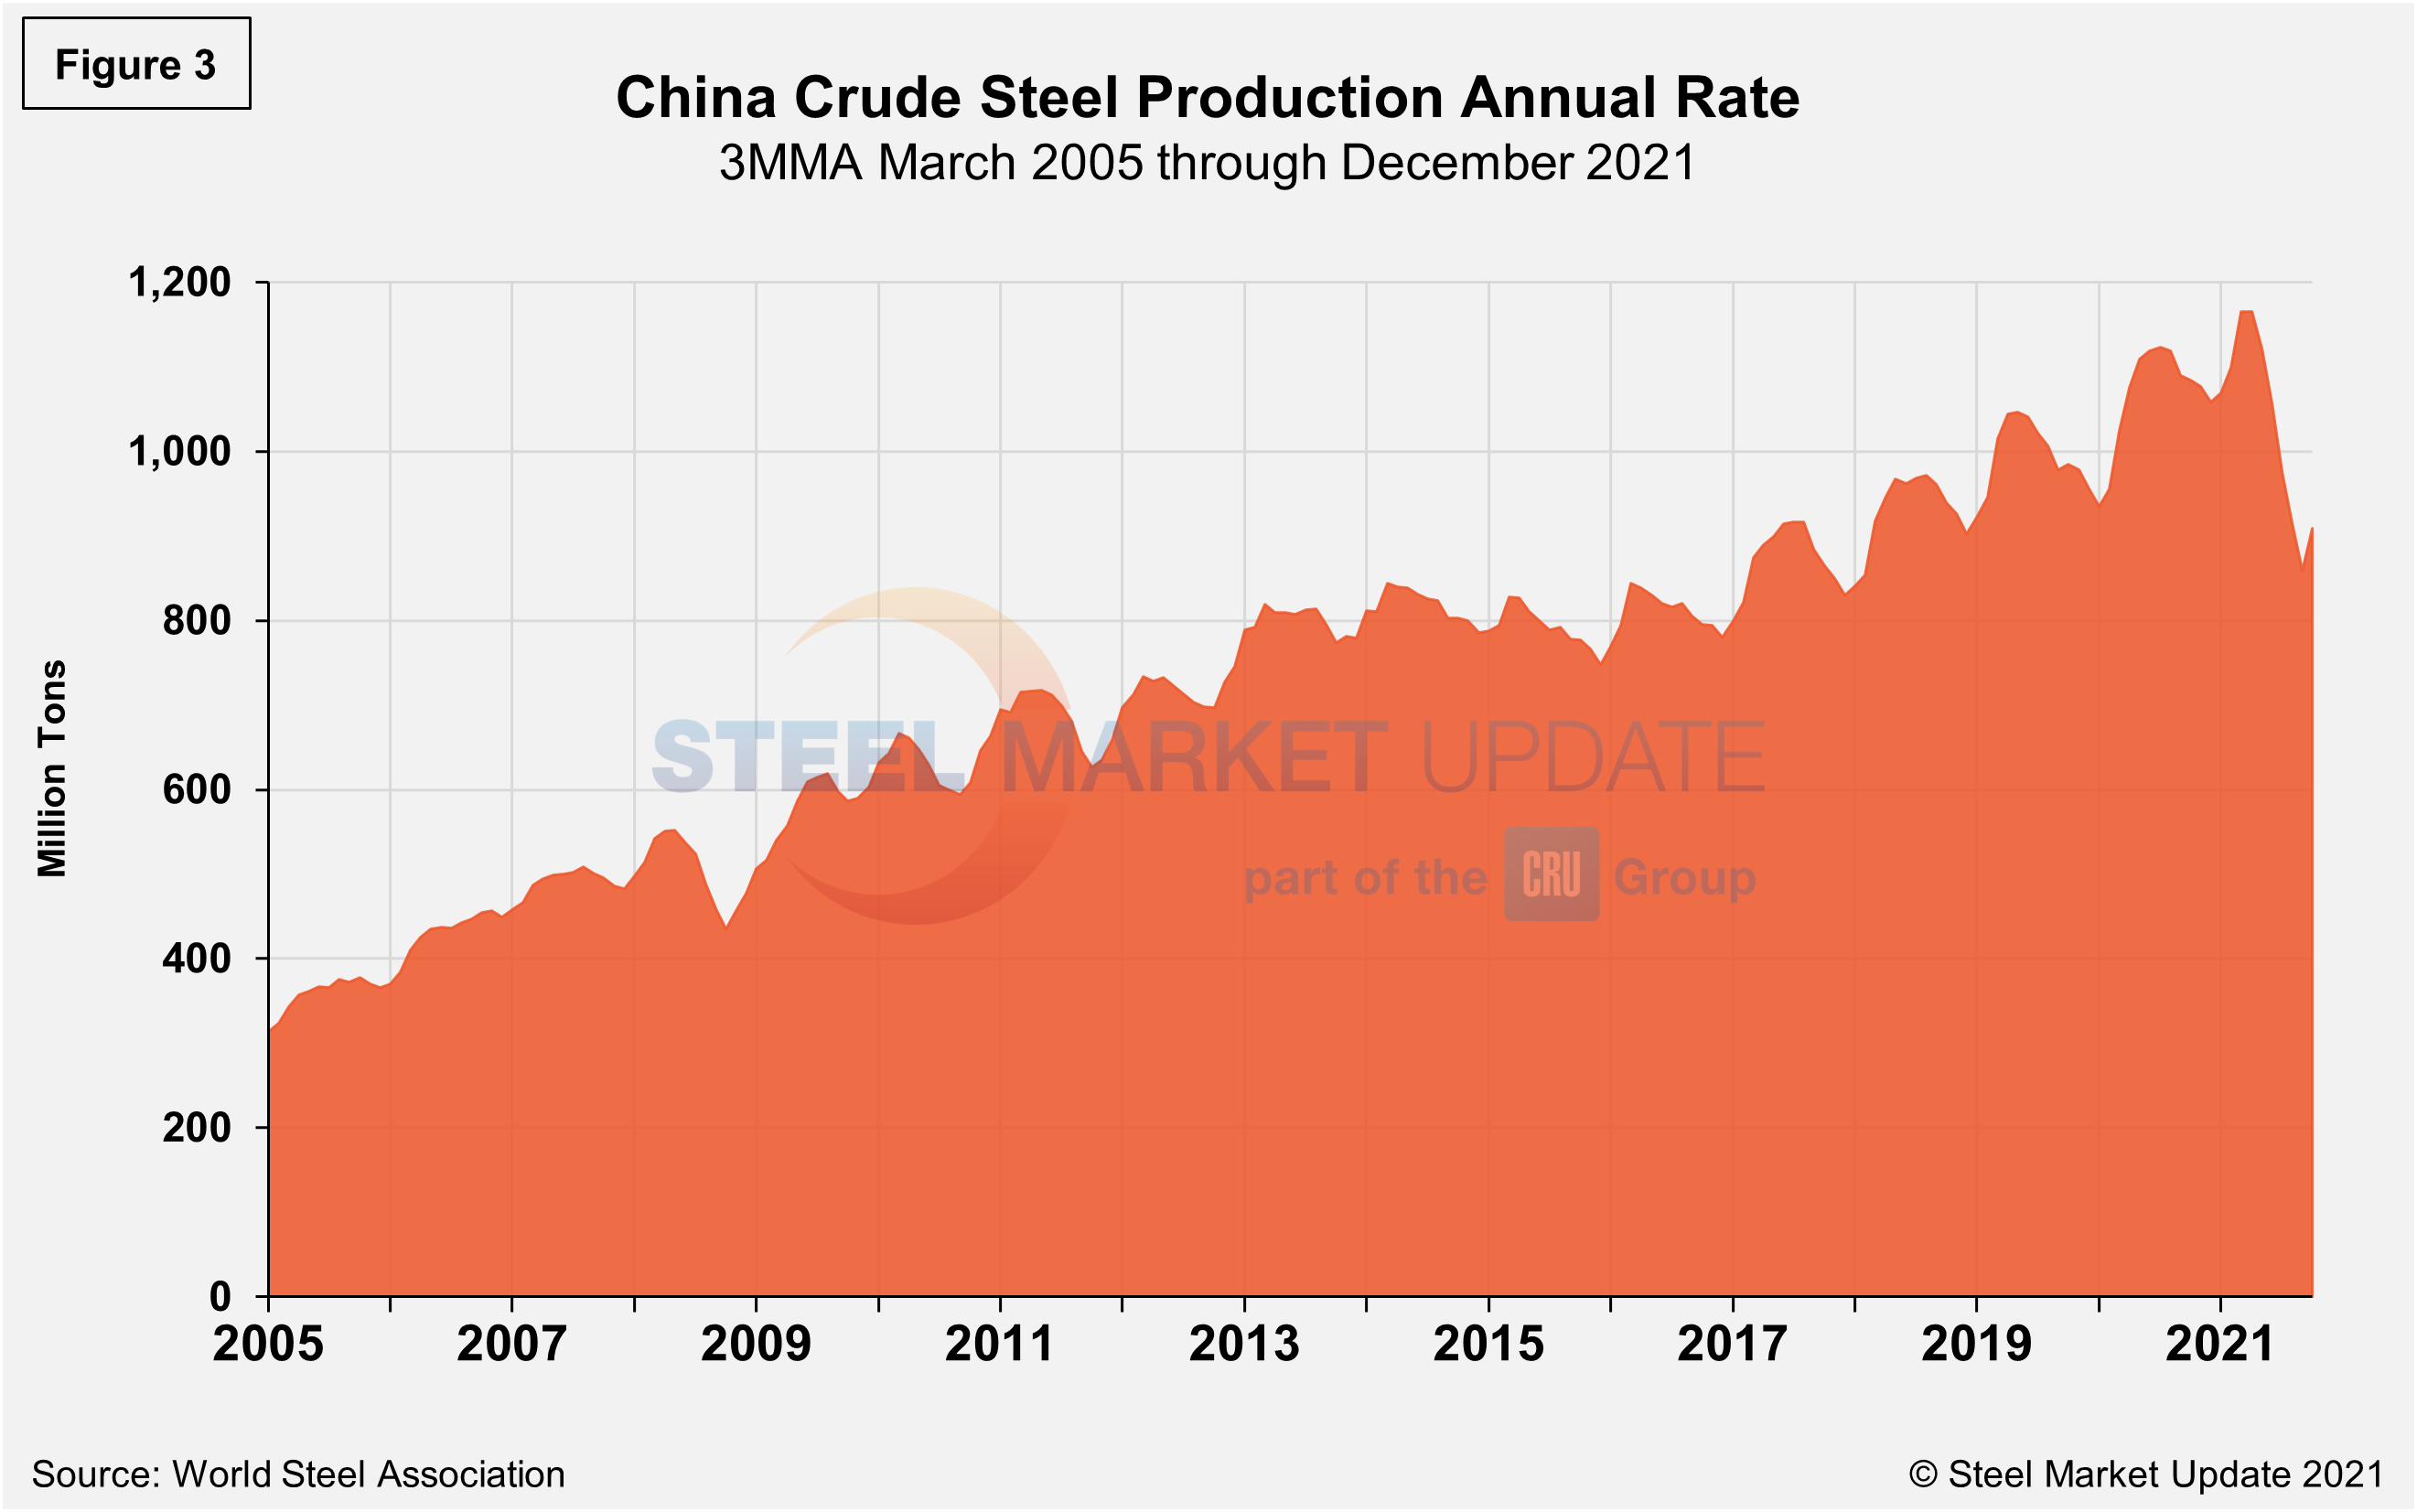
On a 3MMA basis (Figure 3), the annual rate of China’s crude steel production had maxed out at 1.123 billion metric tons in September 2020, then dipped month on month through February. March through May were the first increases since last September, setting a new high of 1.166 billon metric tons in May. December’s total was 908.4 million metric tons, up from 858.8 million metric tons in November. China’s annual capacity is presently 1.128 billion metric tons, and its annual capacity utilization slipped to 91.3% in December, down from its all-time high of 98.4% in June.
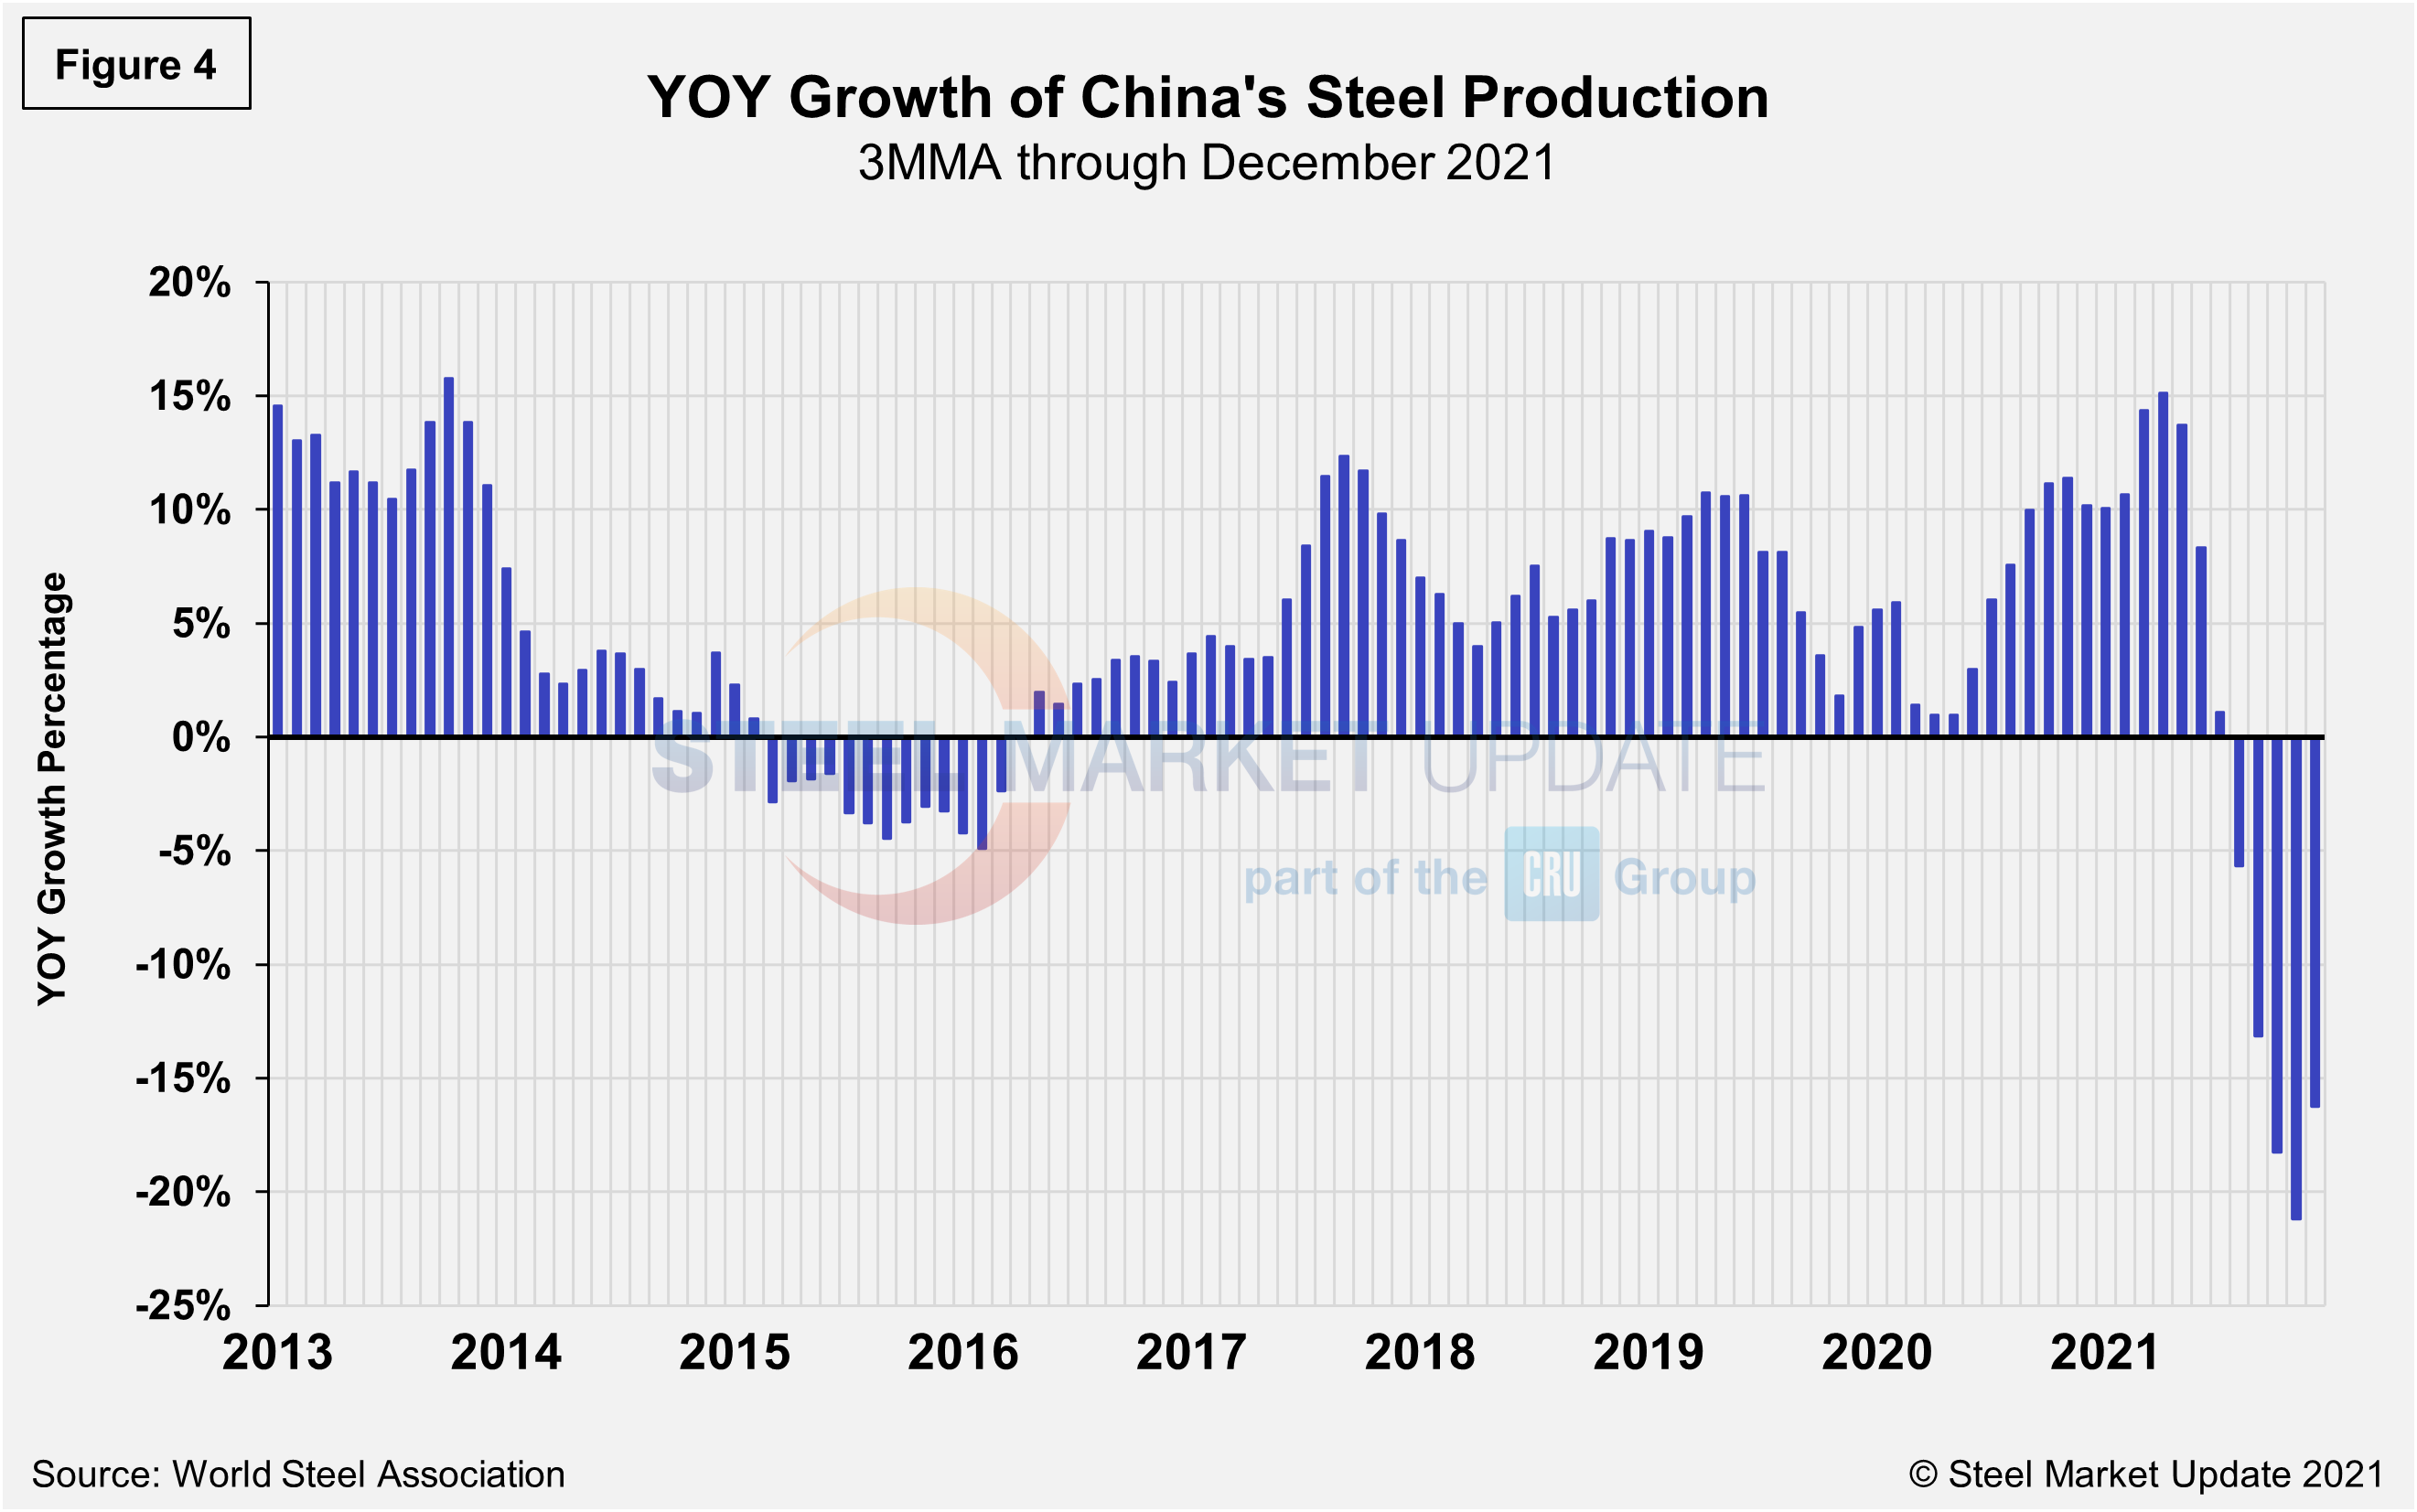
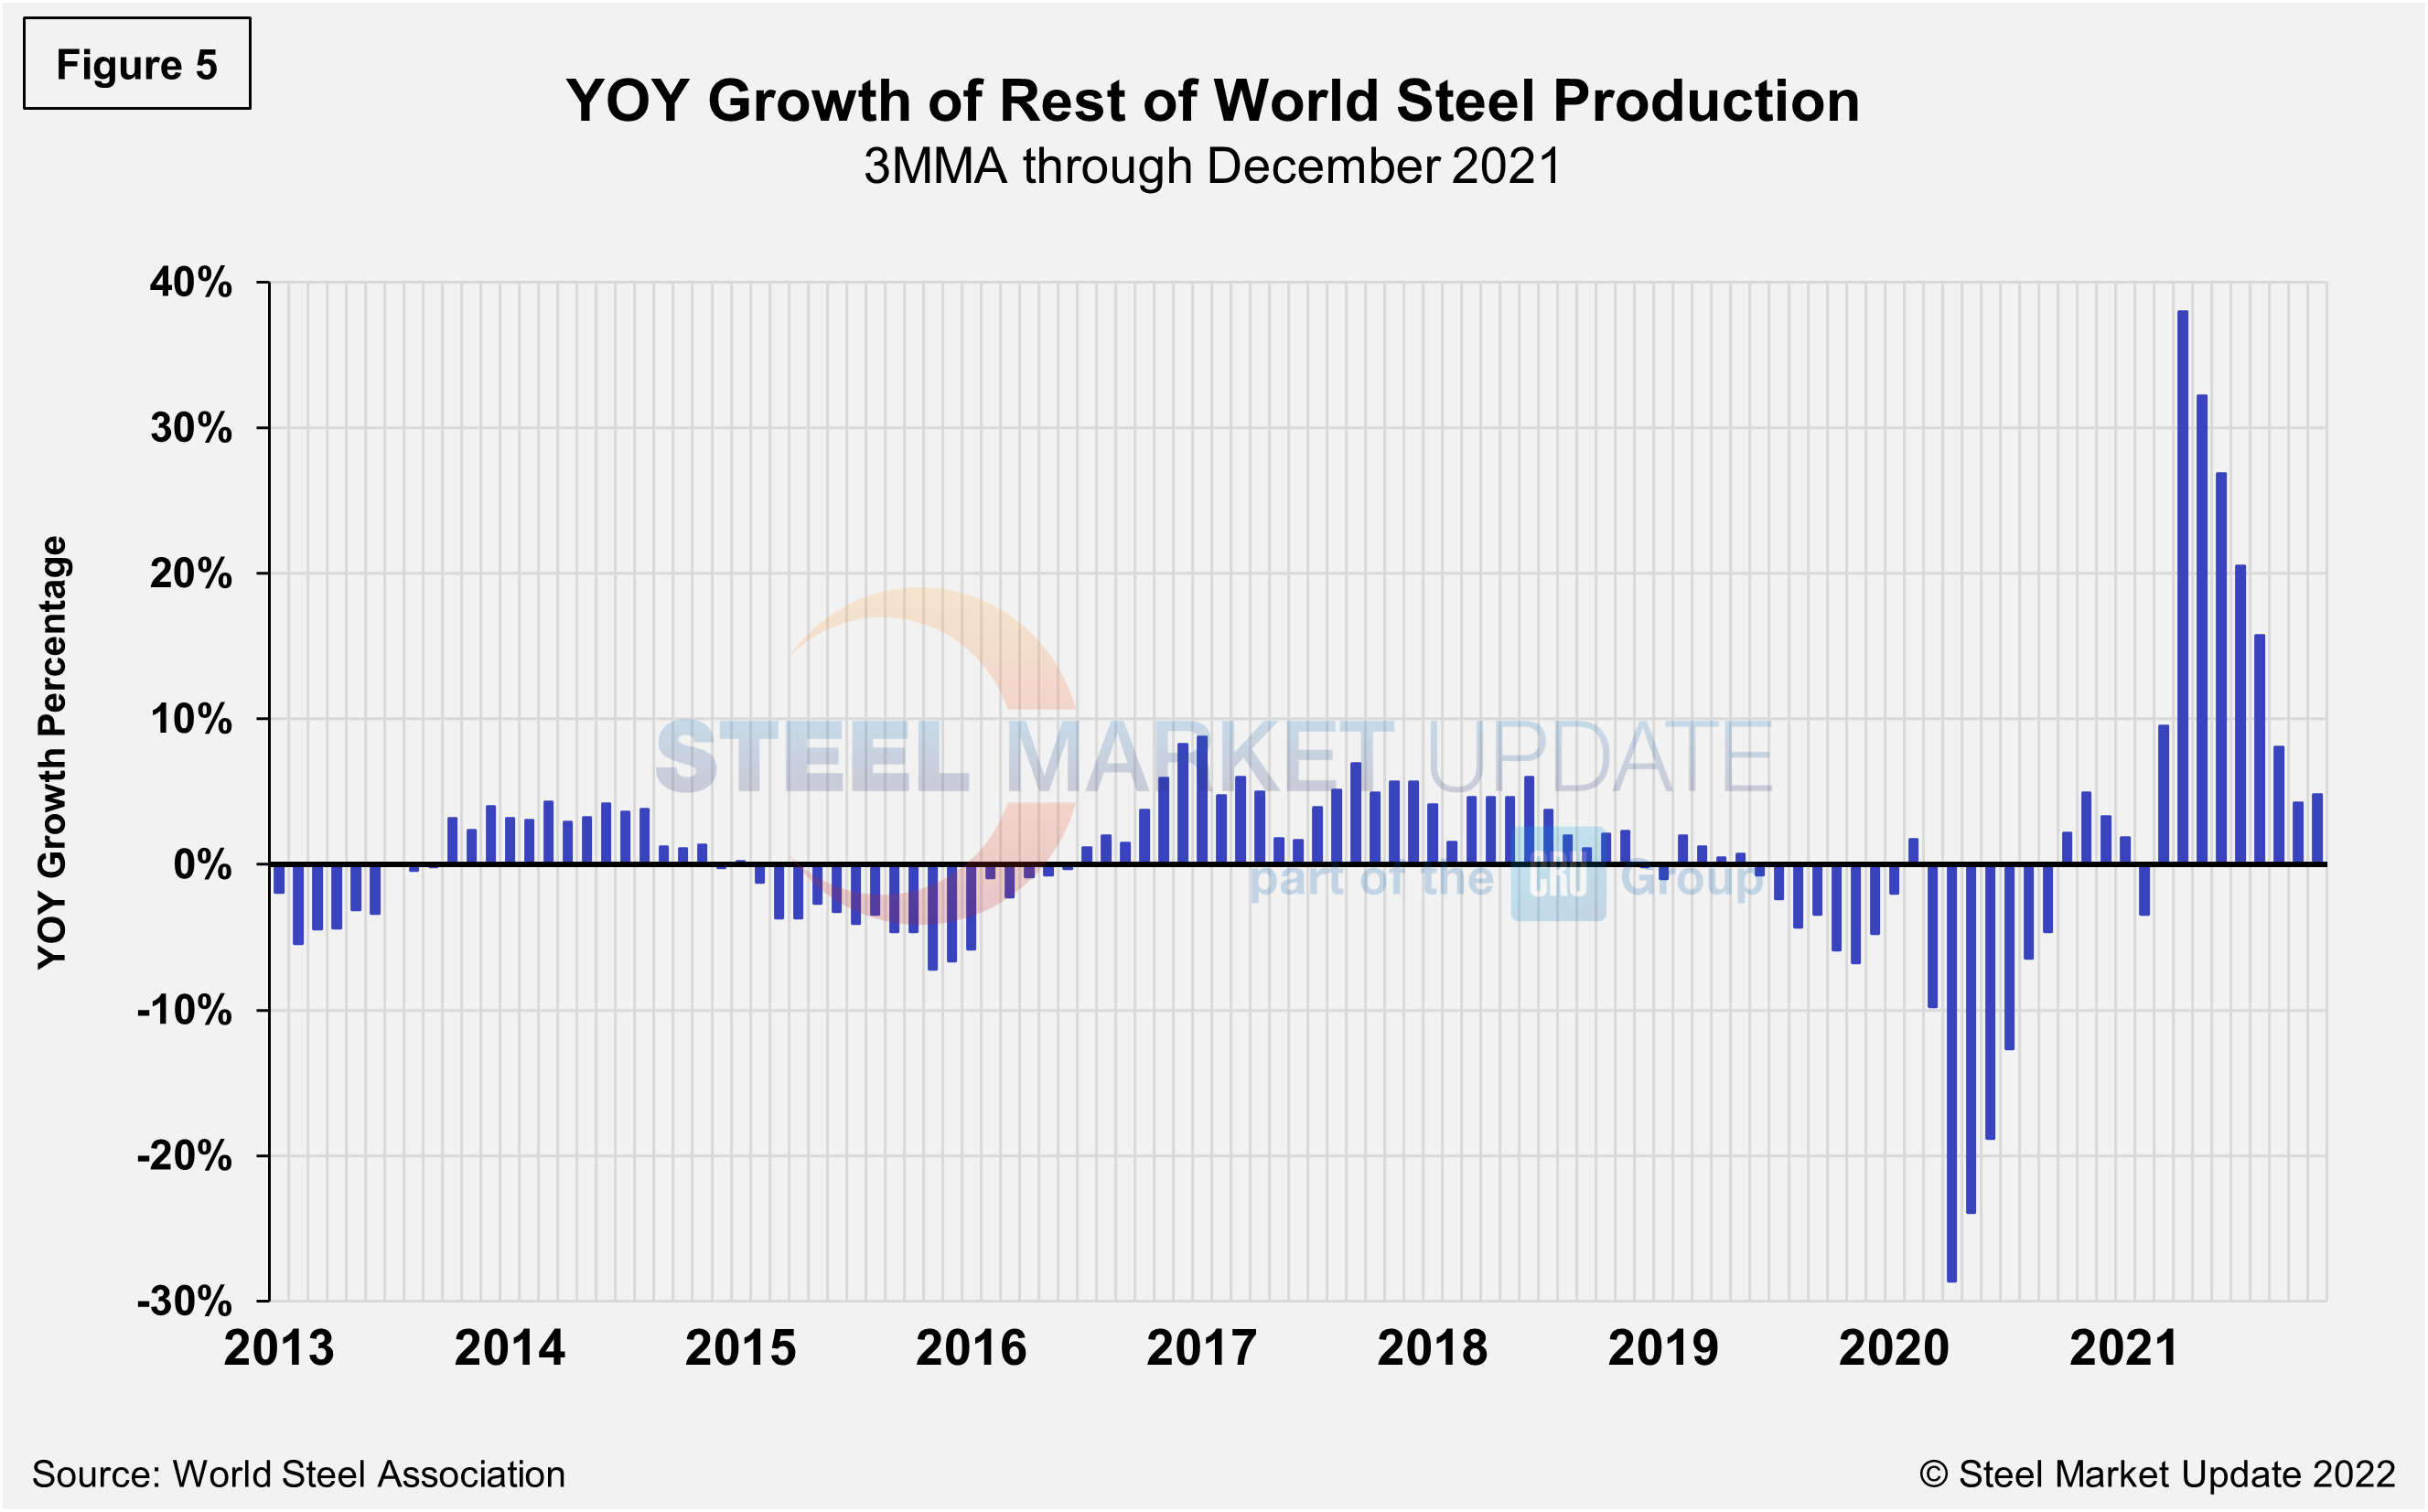
The fluctuations in China’s steel production since April 2013 are shown in Figure 4, while Figure 5 shows the growth of global steel excluding China, both on a 3MMA basis. From October 2020 through December 2021, the rest of the world’s production rose sharply, reaching a peak of 38.0% in April. Since then, the rate for the rest of the world’s annual production had decreased sequentially to just 4.2% in December, despite a slight rise to 4.8% the month prior. China’s annual growth rate was -16.2% in December, a slight increase from -21.2% in November, but still a big shift from the +15.1% in April. Despite the month-on-month production surge in December, steel production in China remains down as the Asian giant seeks to curb harmful air emissions and limit energy consumption. Further production cuts are expected in the near-term, especially in February during the upcoming Lunar New Year and Winter Olympics.
By David Schollaert, David@SteelMarketUpdate.com


