Market Data
January 5, 2023
HR Futures: Will Demand Support the Latest Price Push?
Written by Jack Marshall
The following article on the hot-rolled coil (HRC), scrap and financial futures markets was written by Jack Marshall of Crunch Risk LLC. Here is how Jack saw trading over the past week:
Hot Rolled
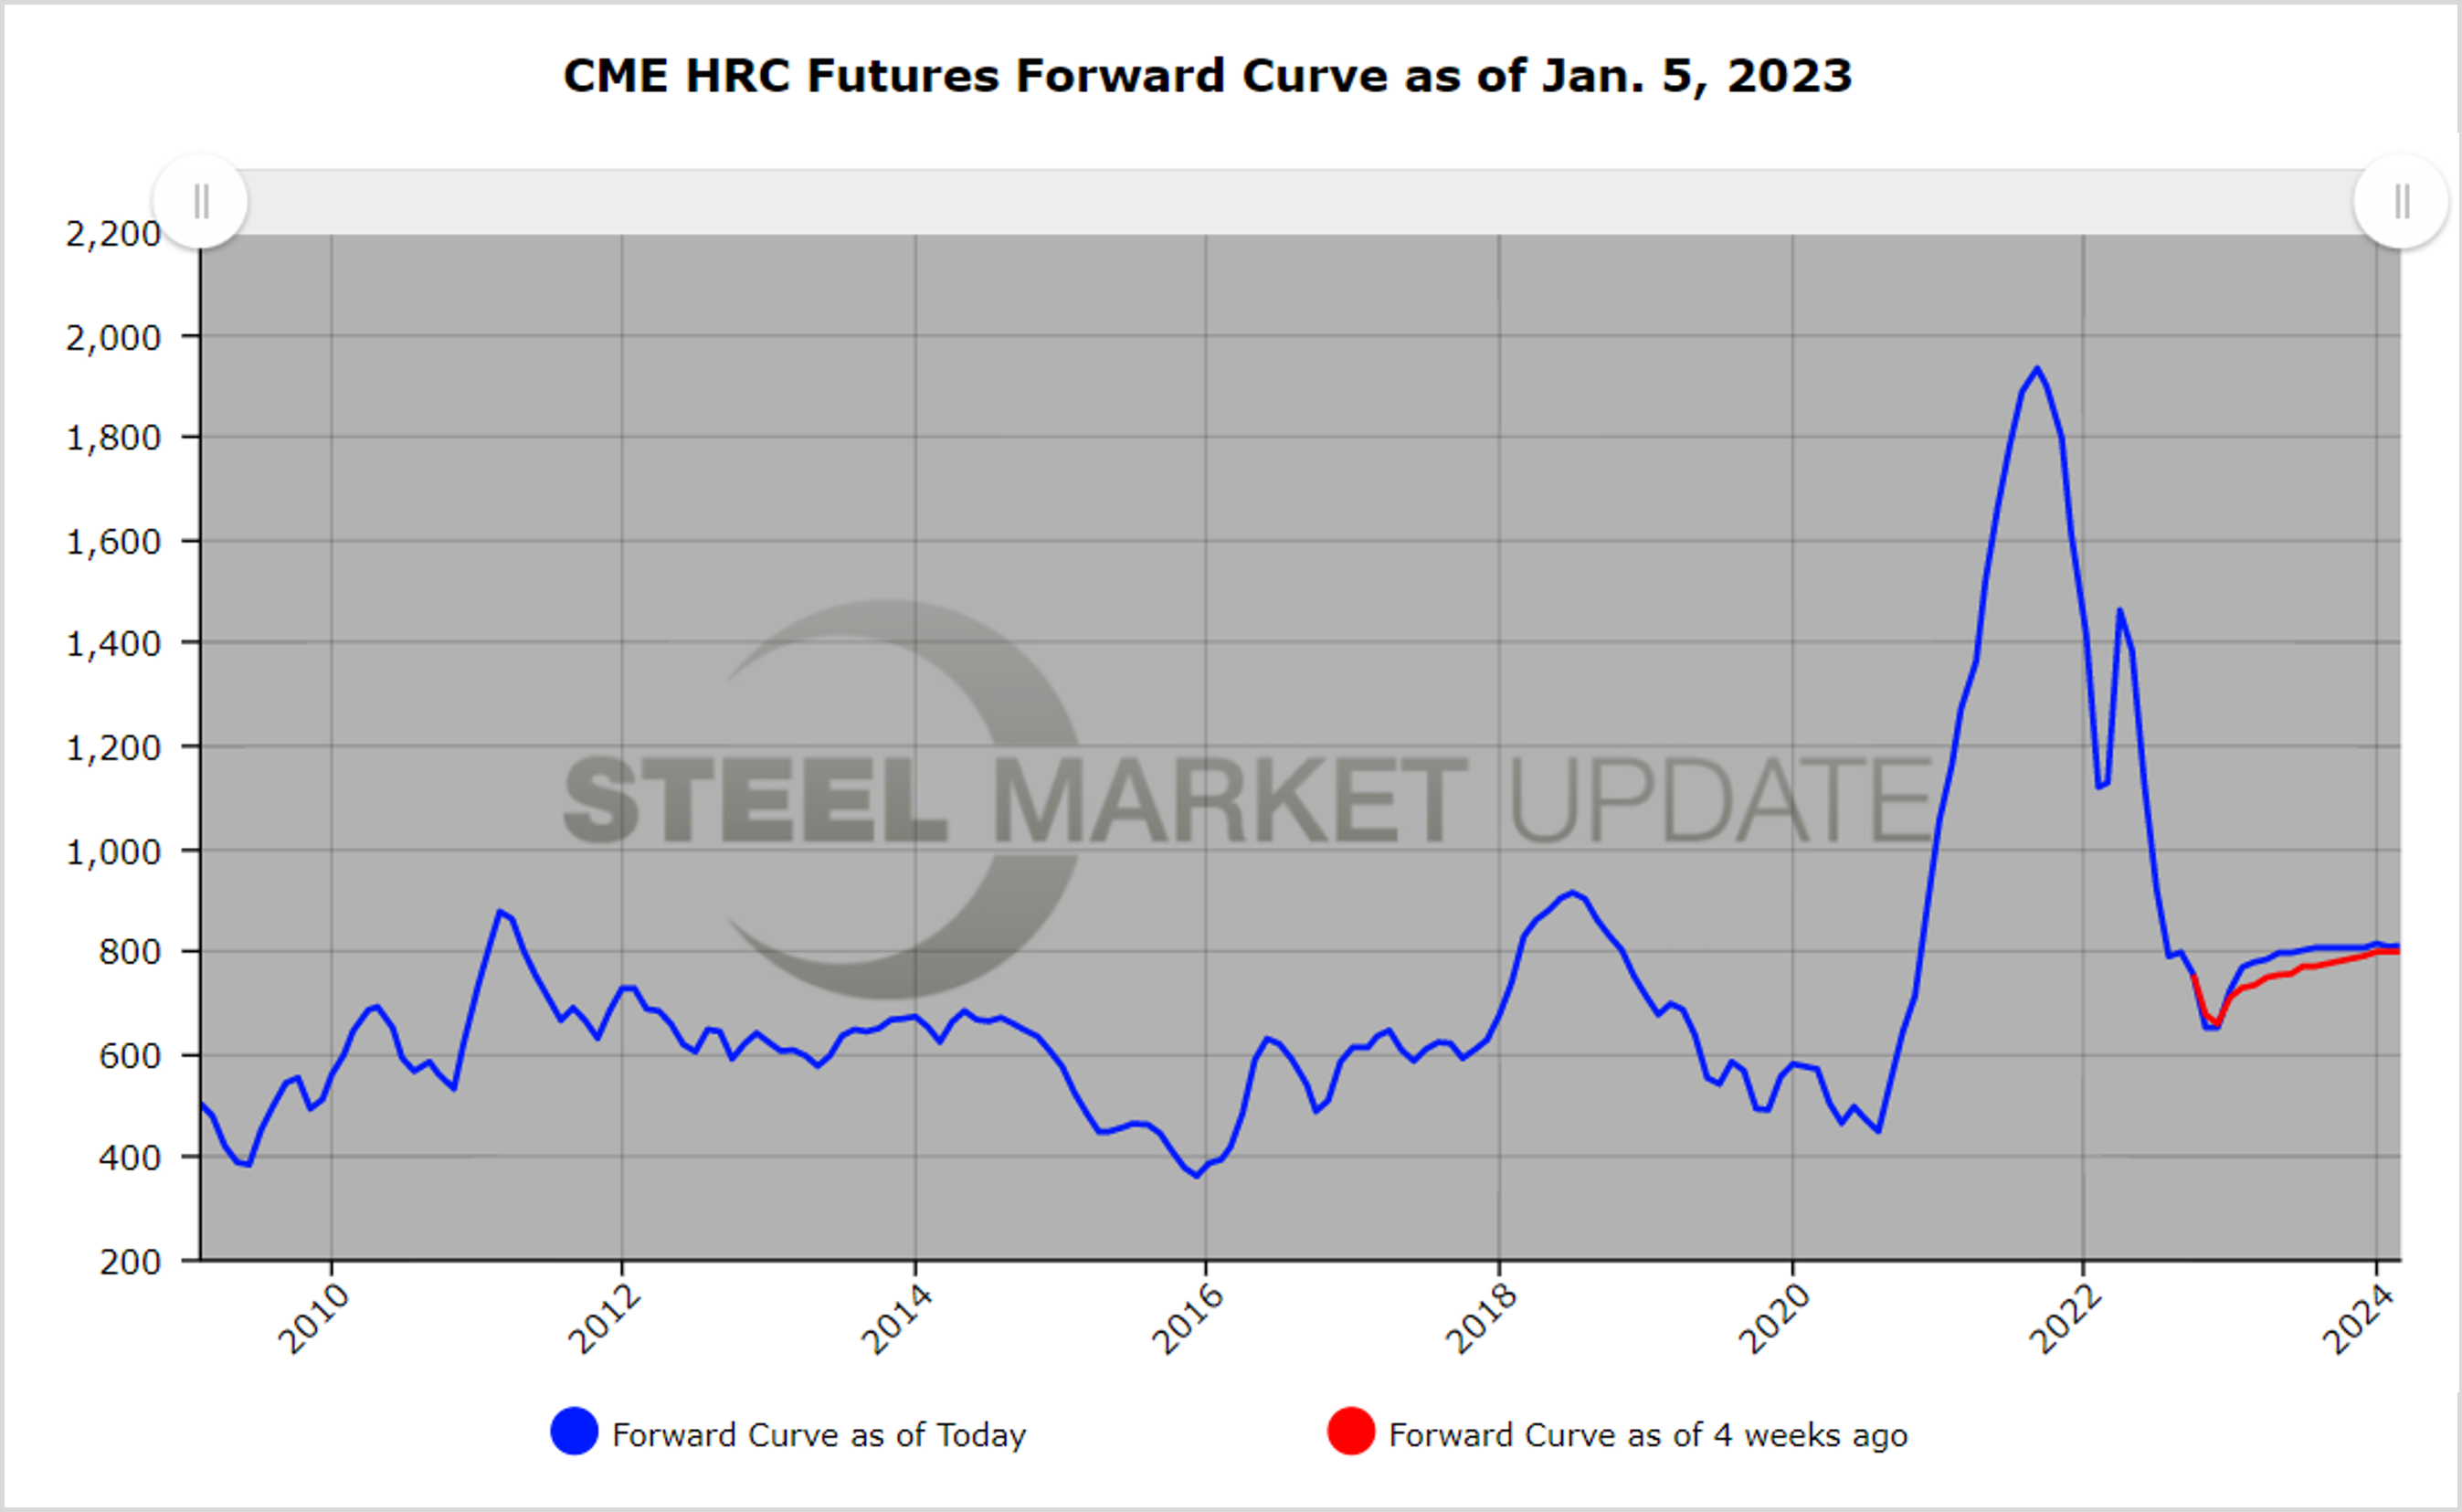
Hot-rolled futures have pushed higher in year-end thin trading. December daily futures trading volumes hovered around 19,000 short tons (ST) per day. Latest HR indexes have spot up roughly $30/ST but still below $700/ST.
Over the last month of the year, HR curves for Cal’23 futures have risen about $25/ST on a settlement basis. Open interest over the month of December rose from roughly 22,500 contracts to 25,500 contracts, and with the December contract rolling off has dropped back to 22,500 contracts.
Continued uncertainty and reduced forecast time horizons, along with a number of other demand headwinds, have contributed to a decline in new open positions. As folks get back into the swing of the new year, we expect a pick-up in activity as folks position for the upcoming two quarters.
Below is a graph showing the history of the CME Group HR futures forward curve. You will need to view the graph on our website to use its interactive features. You can do so by clicking here. If you need assistance with either logging in or navigating the website, please contact us at info@SteelMarketUpdate.com.
Scrap
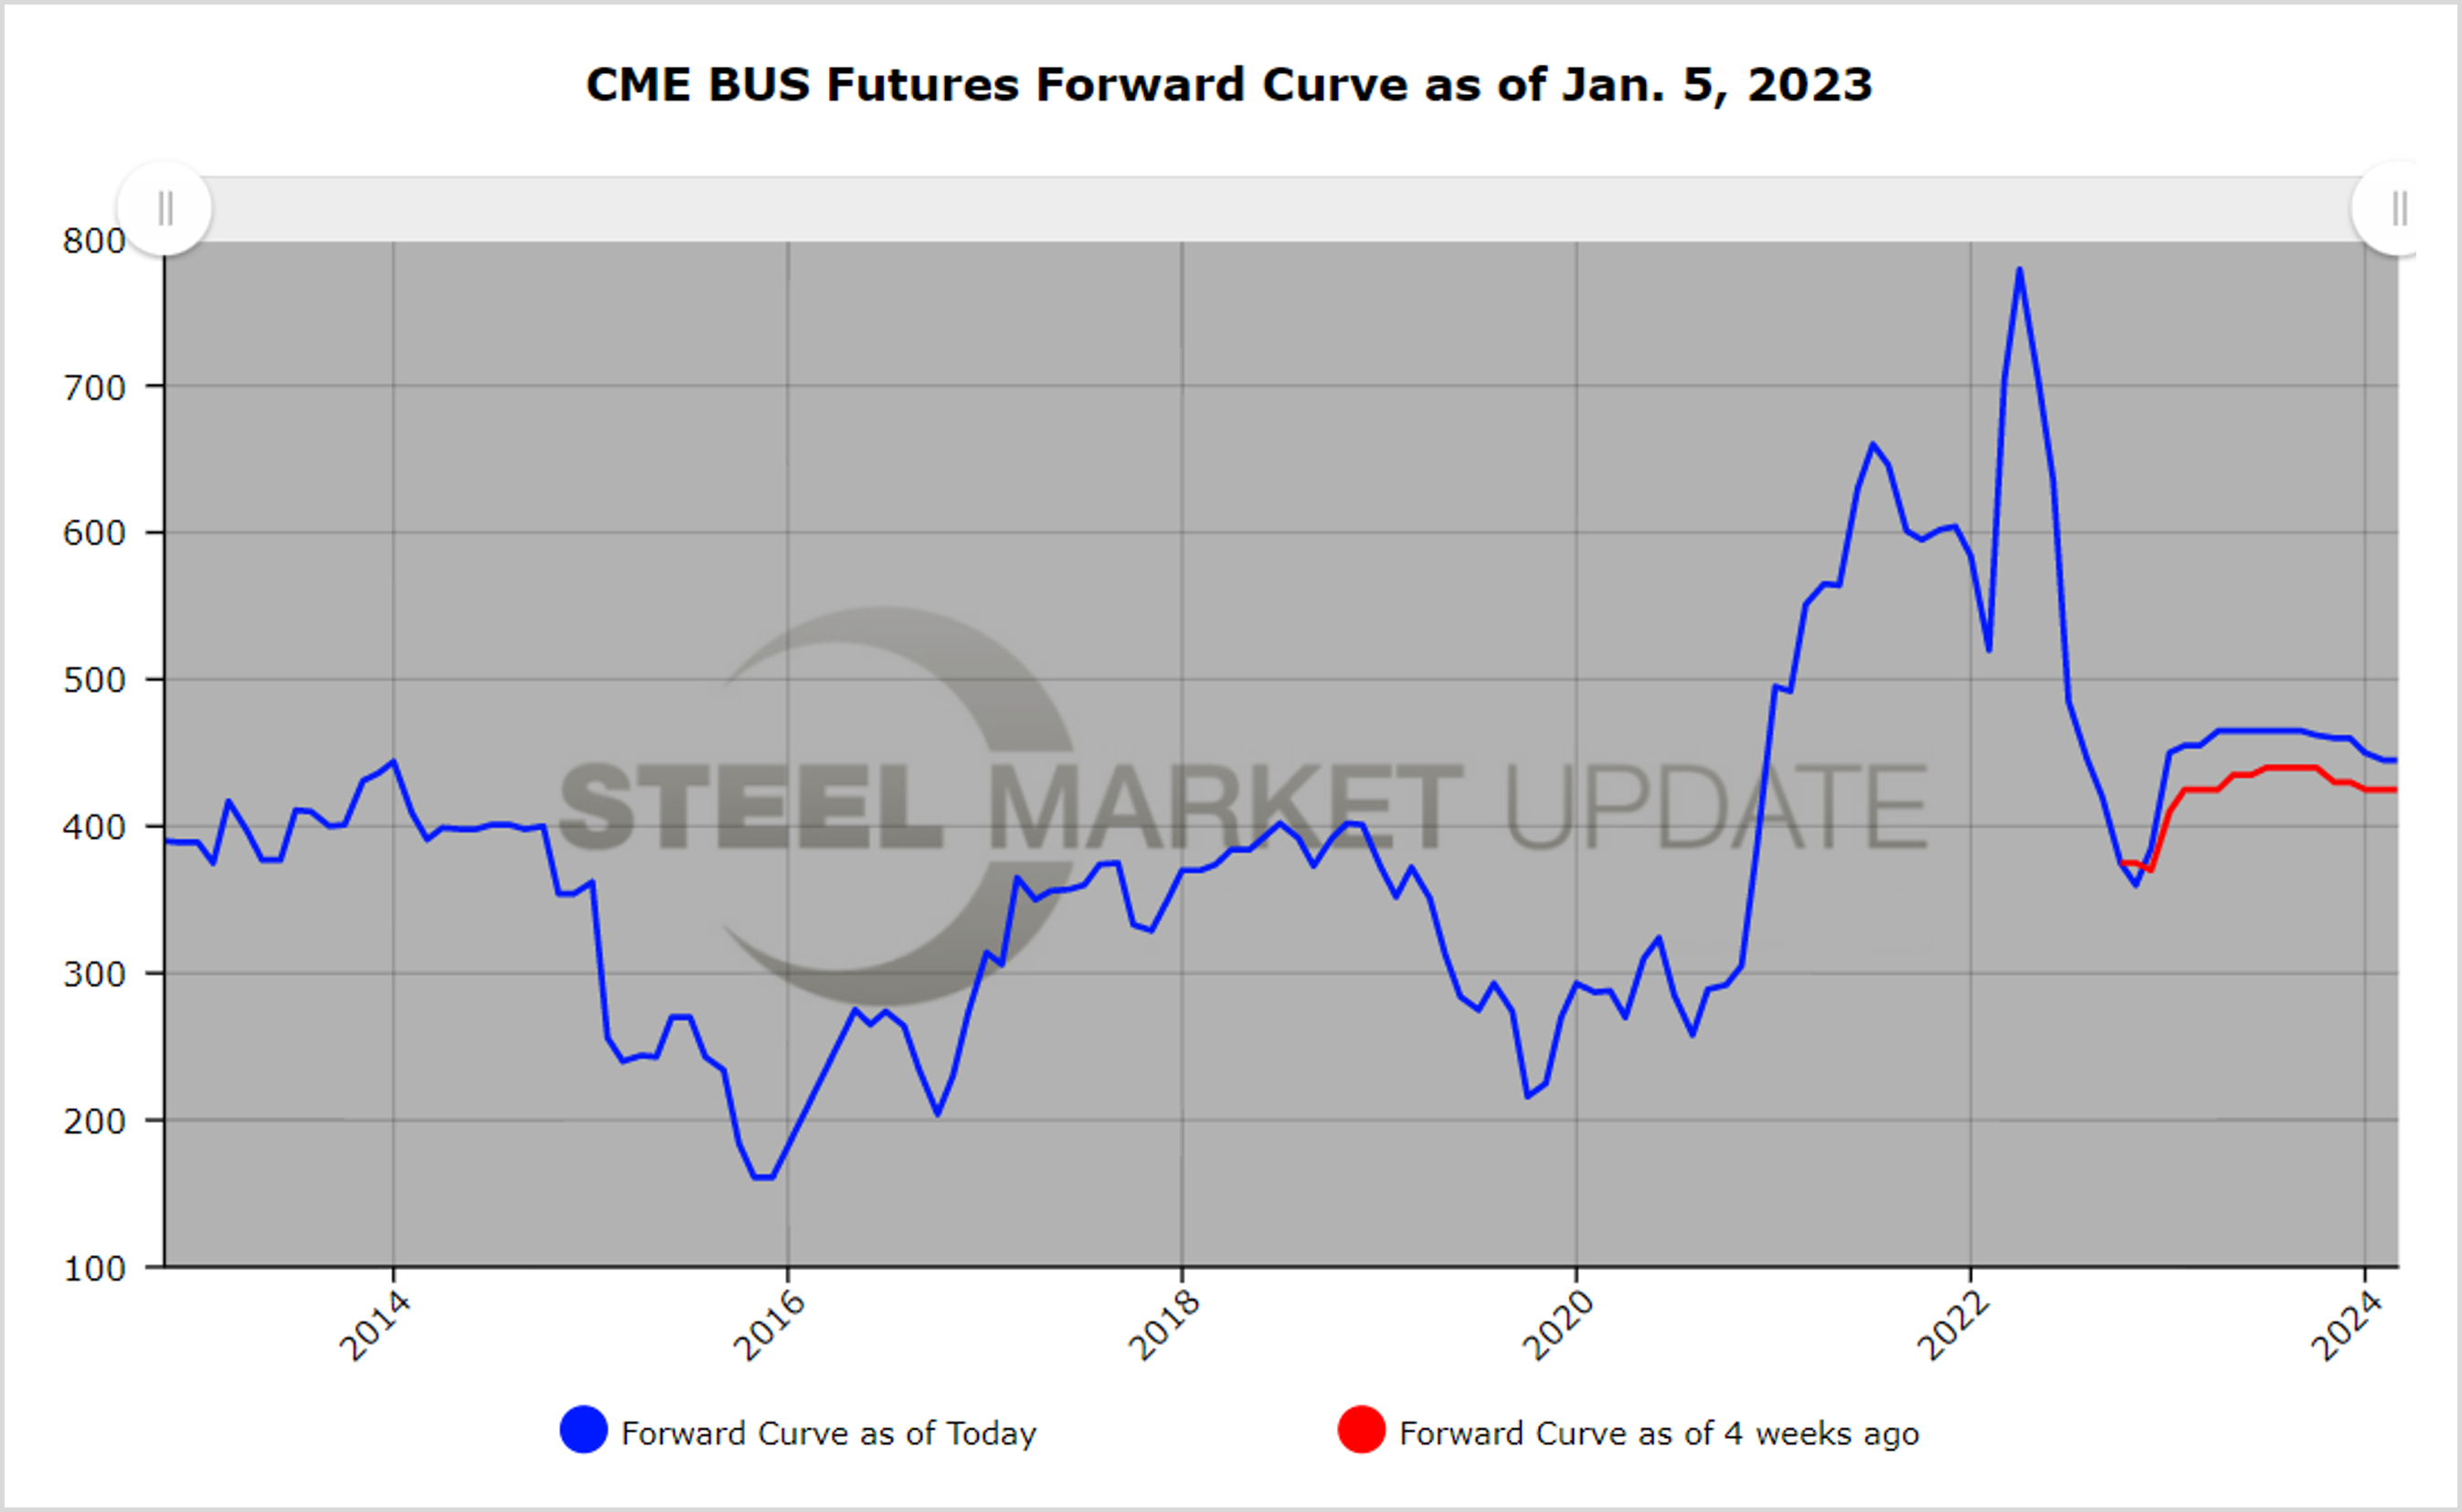
BUS, which rose $30/GT in December to just short of $390/GT, is indicatively expected to rise from $40/GT to $50/GT for January, as new quarter demand and anticipation of winter supply disruptions give scrap the usual season lift. Over the last month, BUS futures settlements have risen close to $30/GT on average for the Cal’23 months, aided by a pick-up in export scrap demand and price.
Open interest is hovering just above 8,000 contracts as we start January 2023. BUS volumes continue to grow, with December trading just shy of 4,000 GT on average per day.
Metal margins have are close to unchanged over the last month.
Below is another graph showing the history of the CME Group busheling scrap futures forward curve. You will need to view the graph on our website to use its interactive features. You can do so by clicking here.
By Jack Marshall of Crunch Risk LLC