Analysis
May 8, 2025
US steel imports retreated in April after rising in March
Written by Brett Linton
US steel imports rebounded from February to March, rising to the second-highest monthly rate witnessed in the past 10 months, according to final data recently released by the US Commerce Department.
April license data shows that gain has likely been erased, with trade falling to the lowest rate of the year and several product categories hitting multi-year lows.
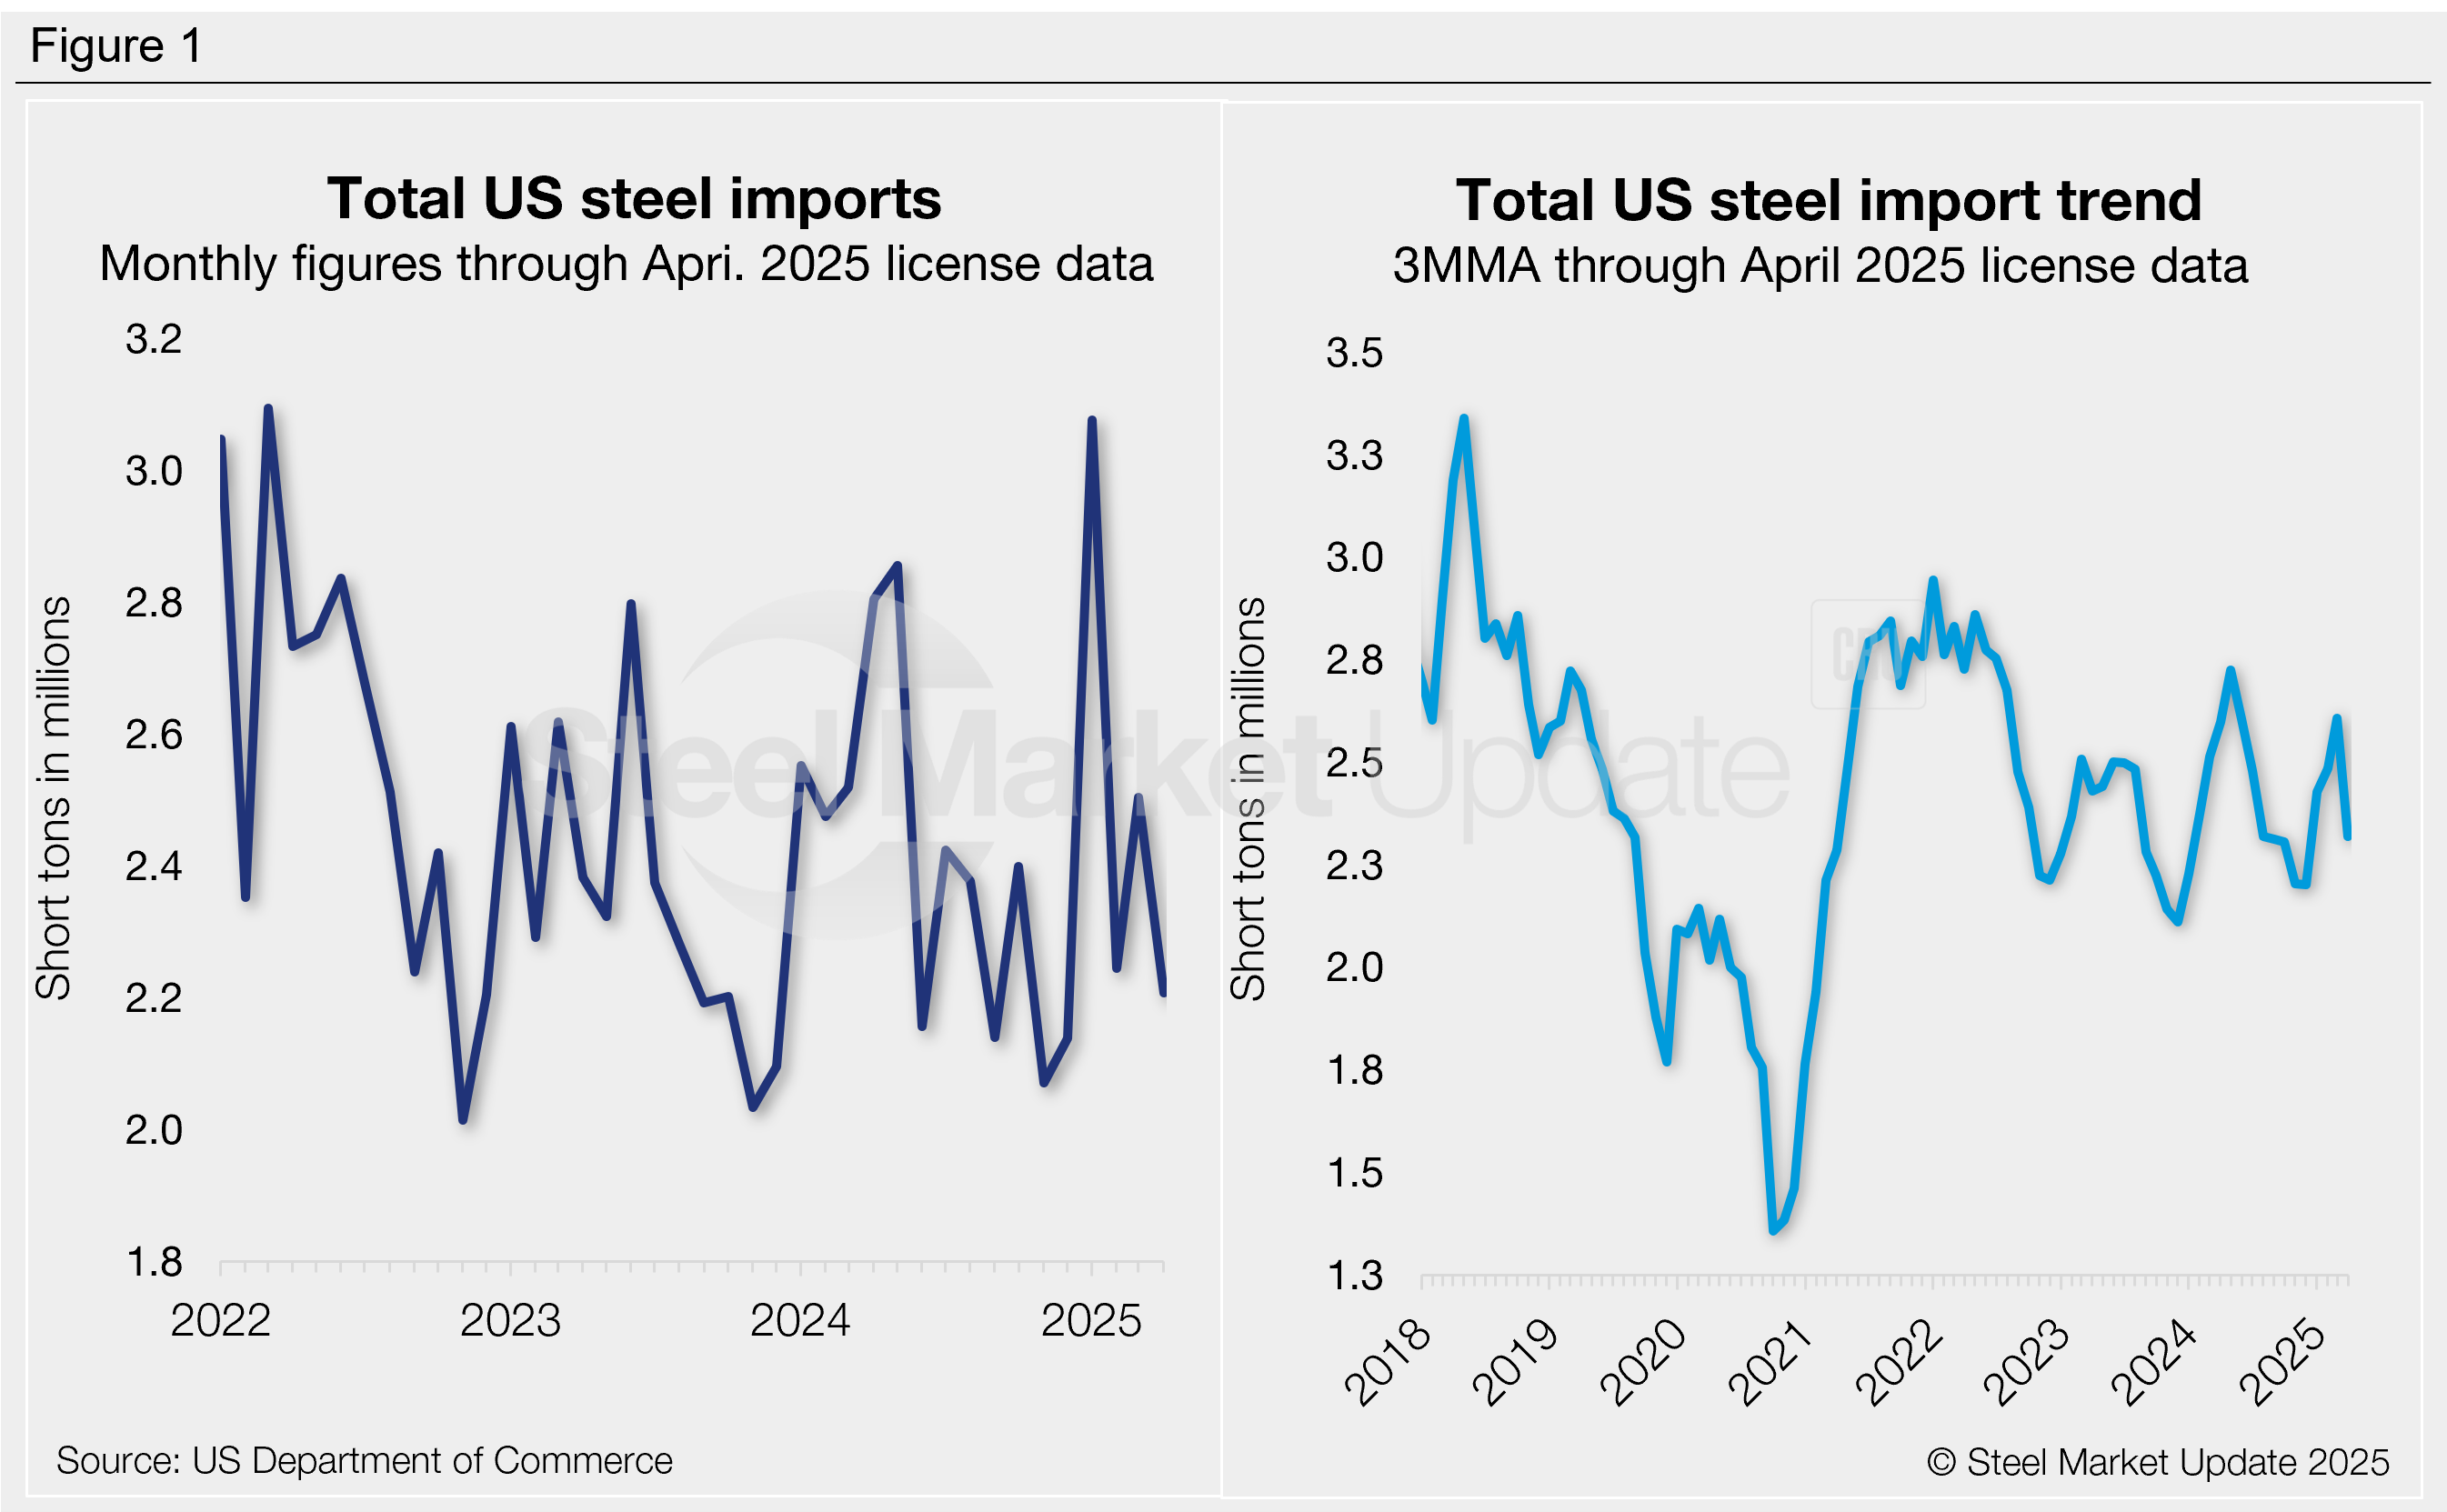
Recall that in January imports surged to 3.08 million short tons (st), the highest monthly volume seen since March 2022. February saw a sharp decline, falling 27% month over month (m/m). March volumes recovered 12% m/m, but the latest license data suggests that recovery was wiped out in April, bringing imports back to the lows of late 2024 (Figure 1, left).
Nearly two thirds of the steel that entered the country in March was exported from just four countries: Canada (20%), Brazil (17%), Mexico (16%), and South Korea (10%). Other key suppliers included Taiwan, Germany, Japan, Vietnam, India, Italy, Turkey, Egypt, and Spain, each supplying 2%-5% of the monthly total. Combined March shipments from these 13 countries accounted for 86% of all imports.
Visit the International Trade Administration’s Steel Import Monitor to explore steel import data by country, category, or specific product.
Import trends
Import data can be analyzed on a three-month moving average (3MMA) to better illustrate trends (Figure 1, right). From this view, March imports hit a 10-month high of 2.61 million st, a steep climb from December’s 12-month low (2.20 million st). After three straight months of gains, the April 3MMA has now declined to 2.32 million st. For comparison, imports averaged 2.41 million st per month in 2024 and 2.35 million st per month in 2023.
Imports by product
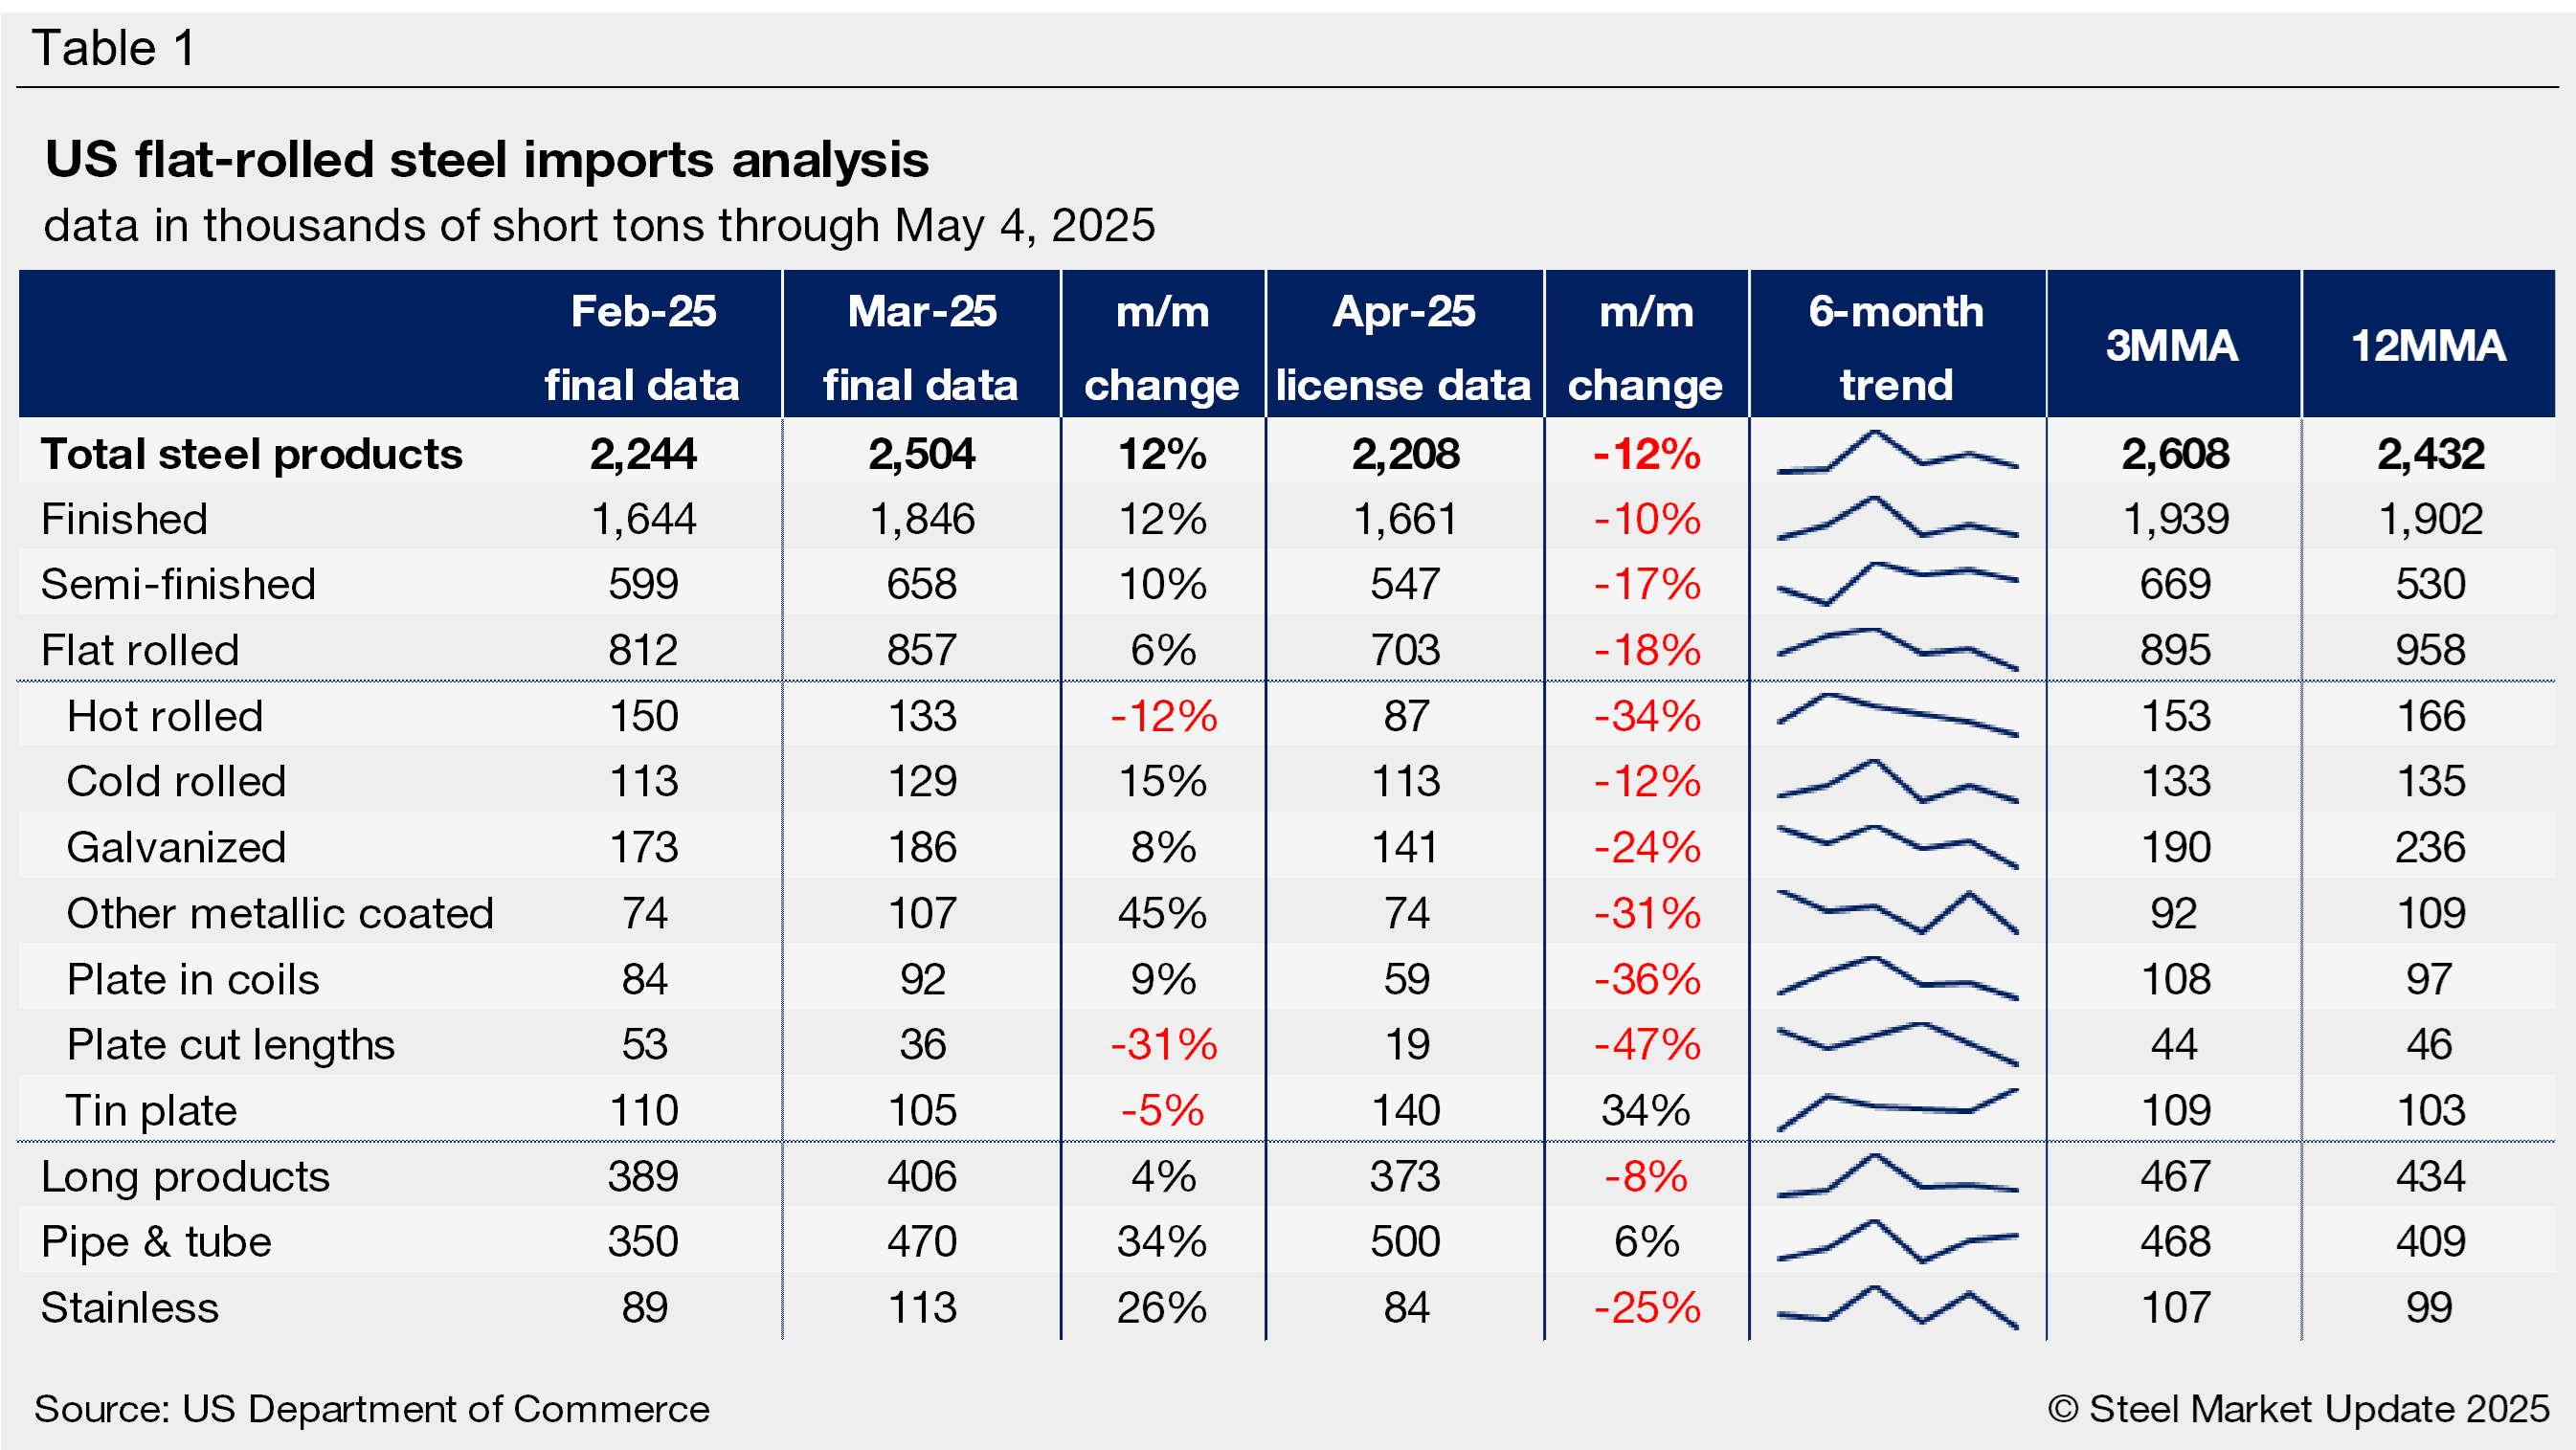
Table 1 provides further detail on imports by product, highlighting high-volume steel products (click to expand). Explore this steel trade data deeper on the Steel Imports page of our website.
Finished vs. semi-finished imports
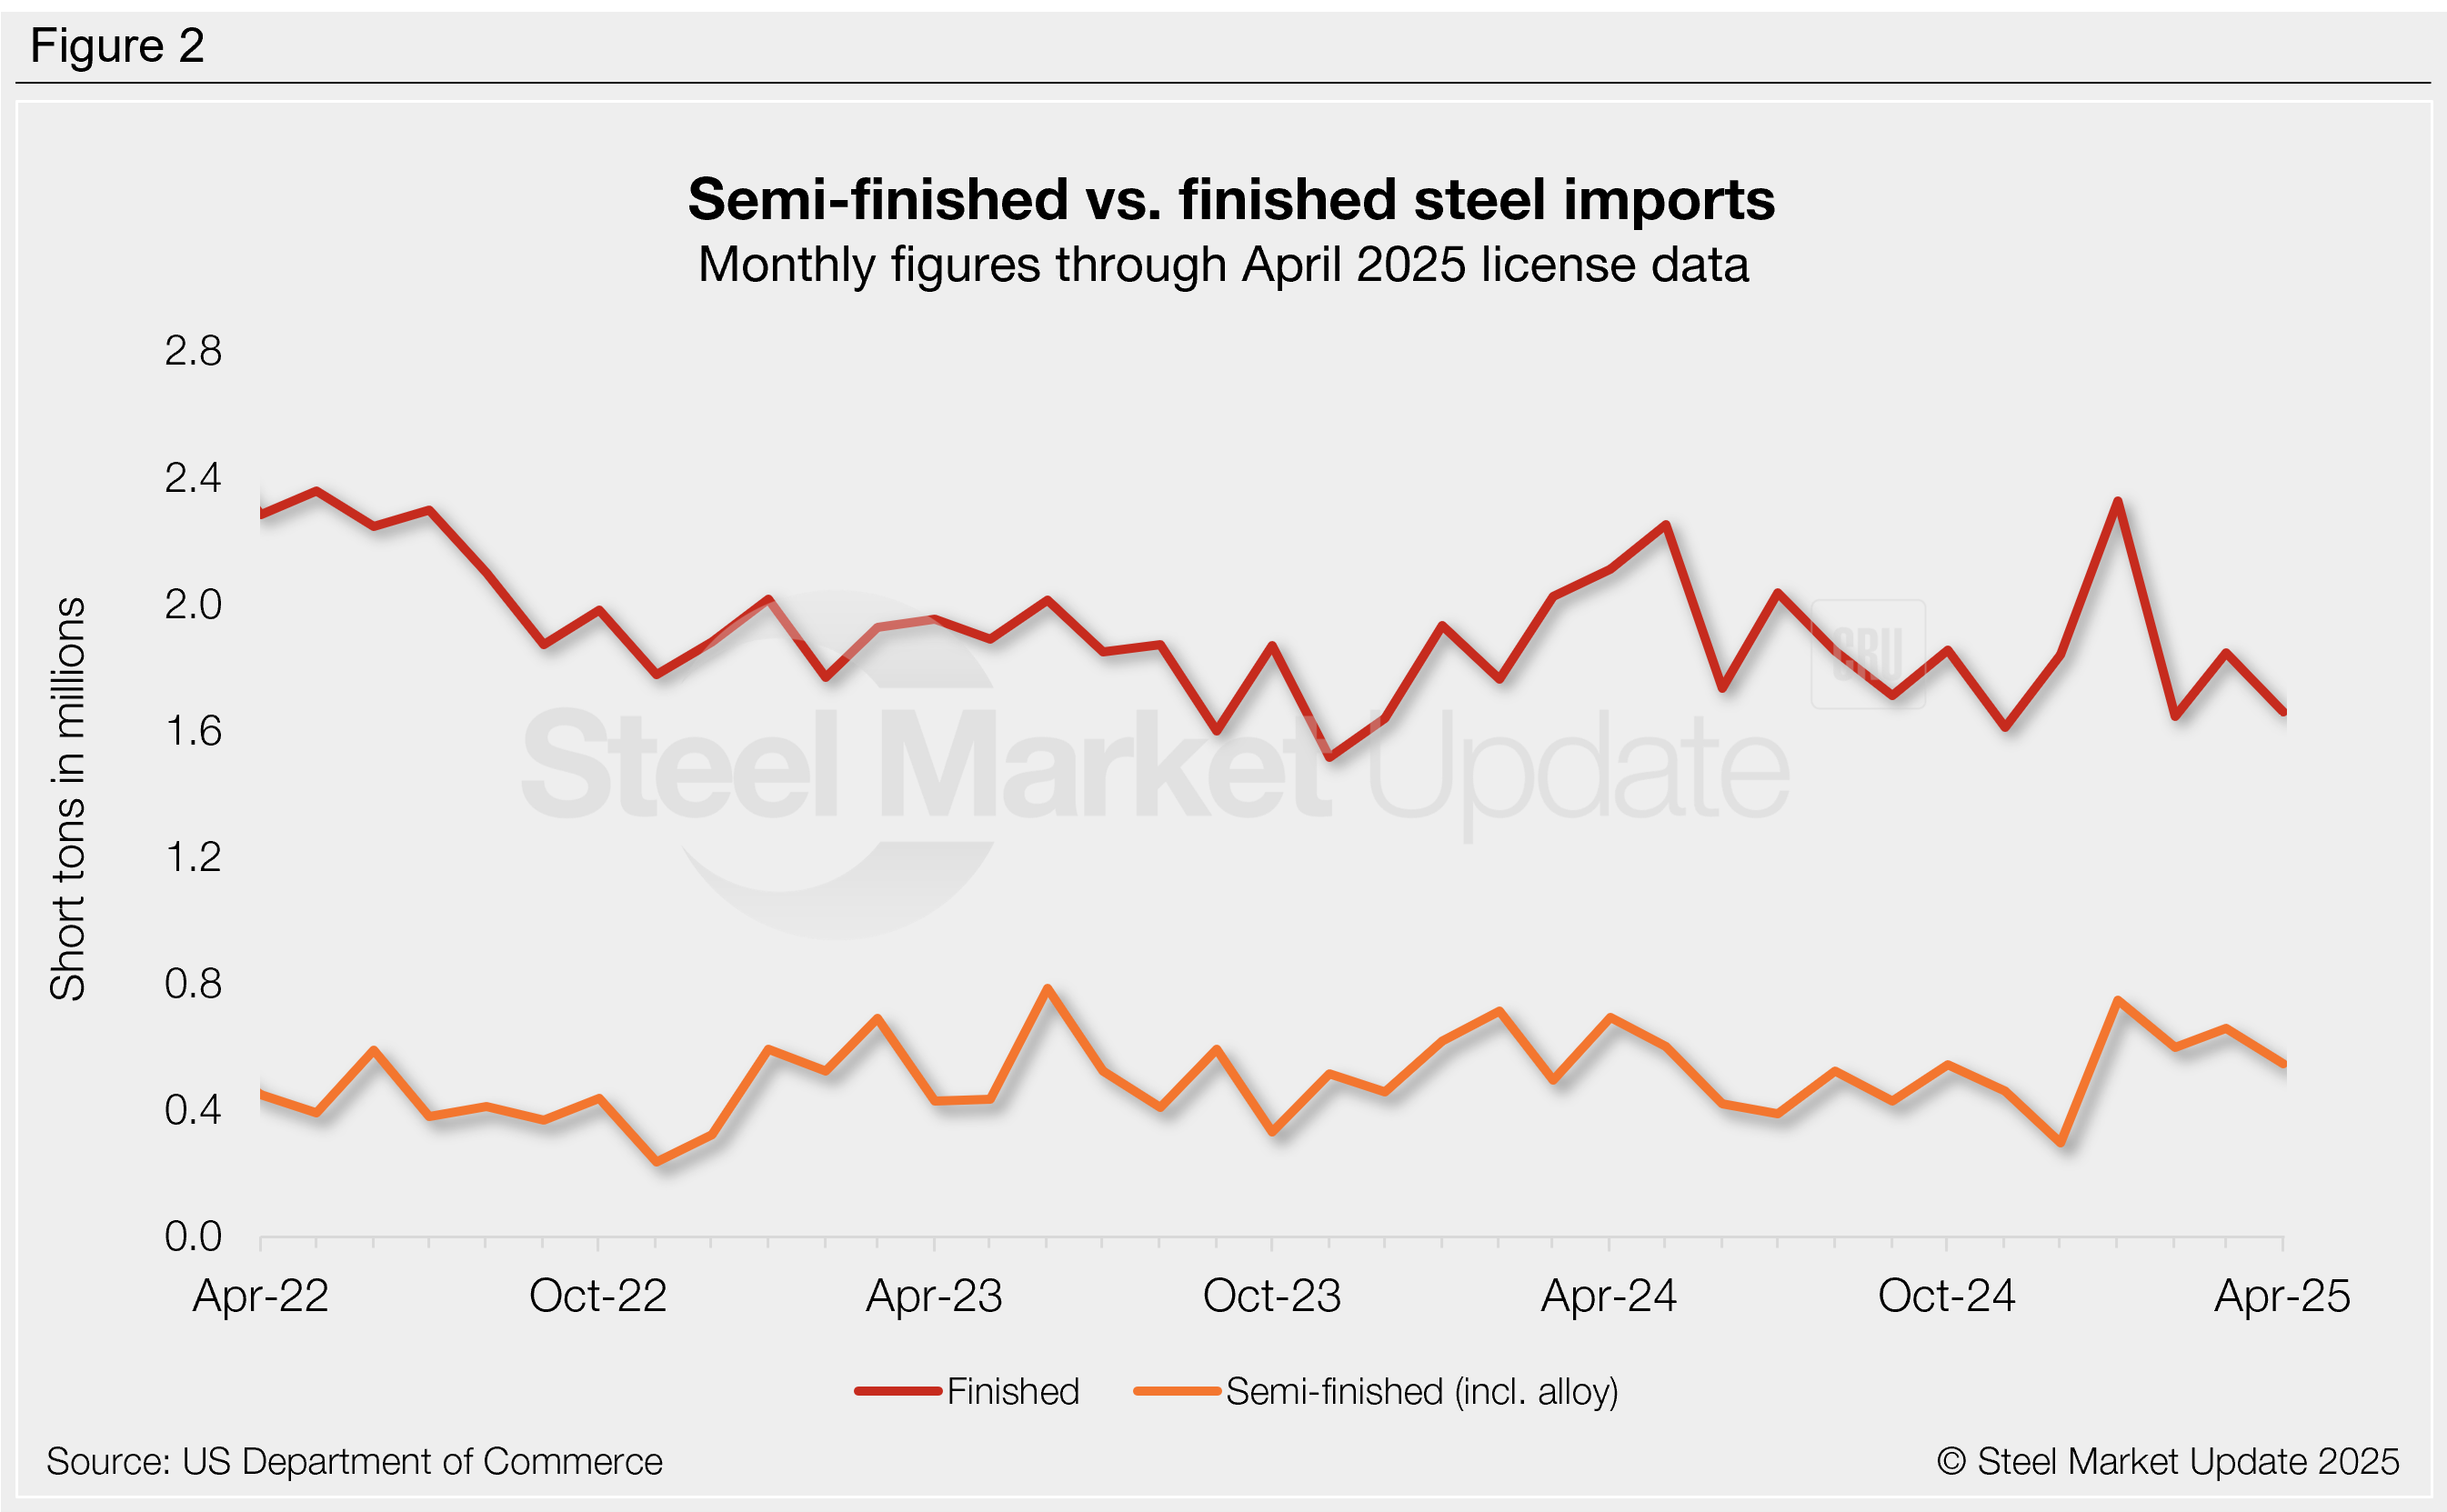
Finished steel products accounted for 74% of March imports, totaling 1.85 million st (Figure 2). That’s up from 1.64 million st in February, when finished steel represented 73% of the total. April finished steel licenses are at 1.66 million st (75% of total imports). In 2024, finished products represented 79% of total imports, up from 78% in 2023, but down from 83% in 2022.
Semi-finished imports (mostly slabs to be further processed by a mill) totaled 658,000 st in March, the third-highest monthly rate recorded in the past year. April licenses are down to 547,000 st.
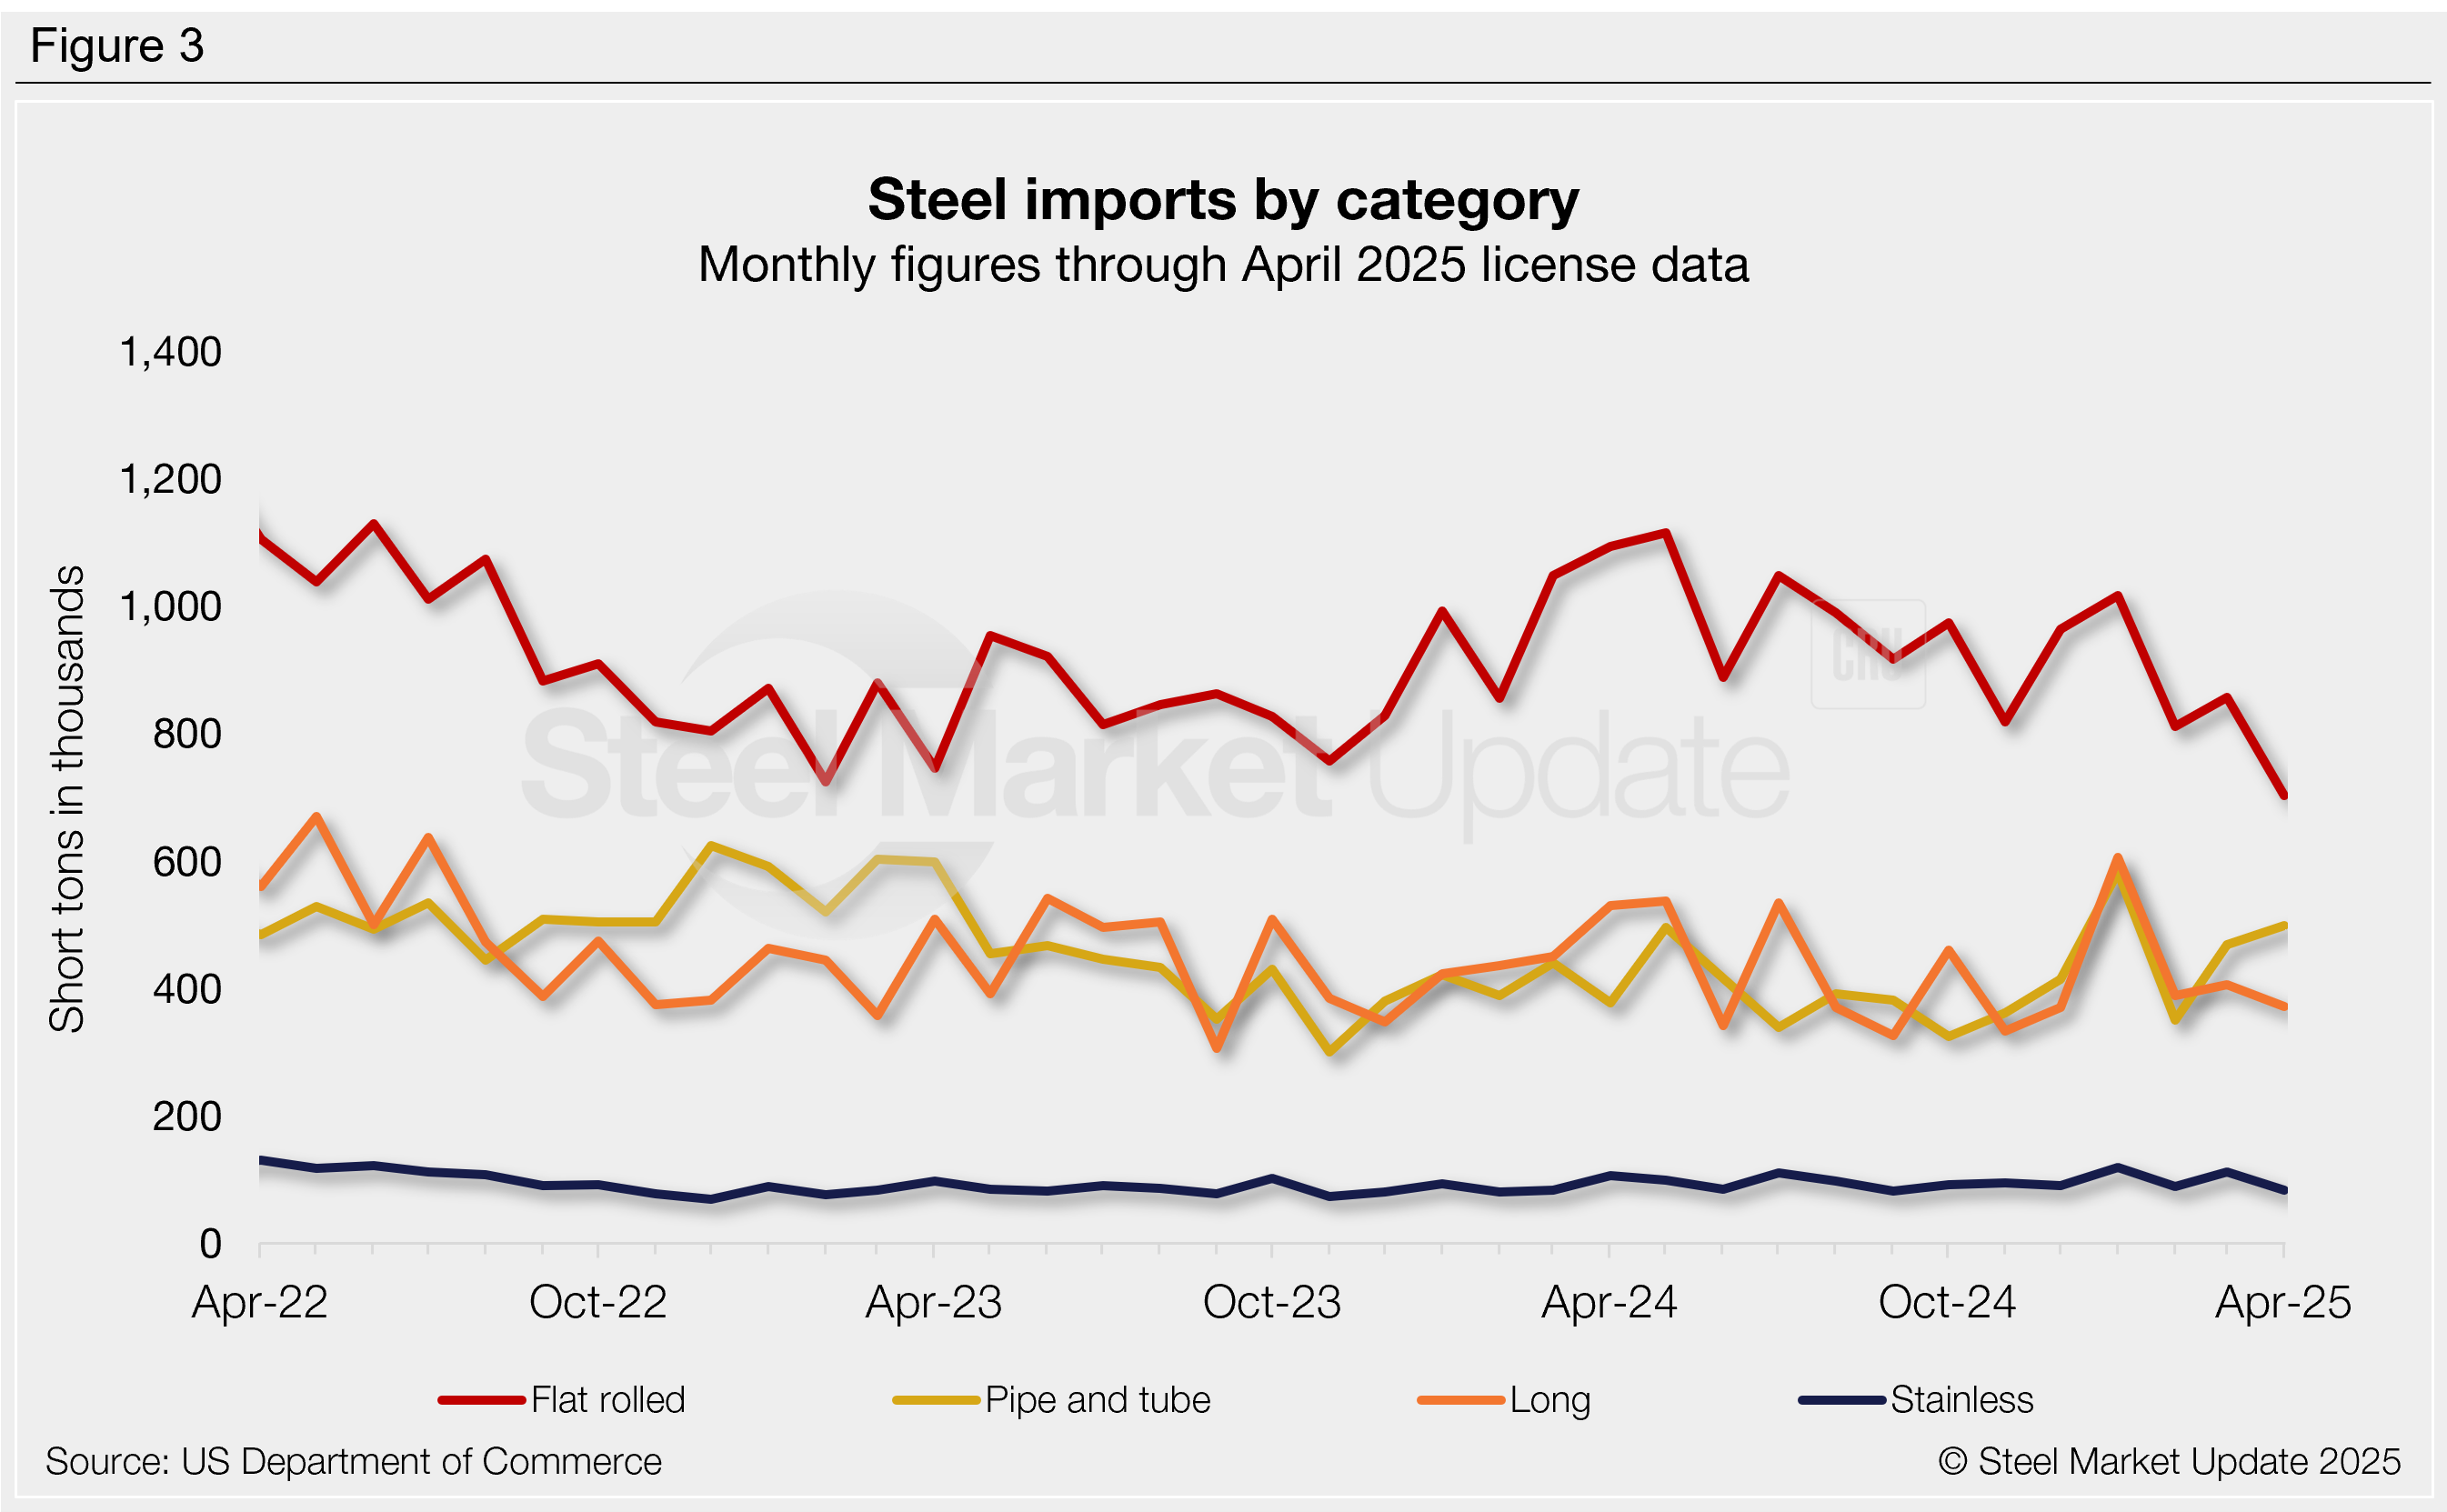
Imports by category
Figure 3 shows monthly imports by popular steel product categories. Noteworthy mentions by category include:
- Flat-rolled imports increased 6% m/m in March, then dropped 18% in April to a four-year low.
- Imports of long products rose 4% m/m in March, slipping 8% in April to a four-month low.
- Pipe and tube imports rebounded 34% m/m in March and rose another 6% in April to one of the higher rates seen in the past year.
- Stainless imports surged 26% m/m in March to one of the highest levels recorded since 2022, though these gains were almost entirely erased in April.
Flat-rolled imports
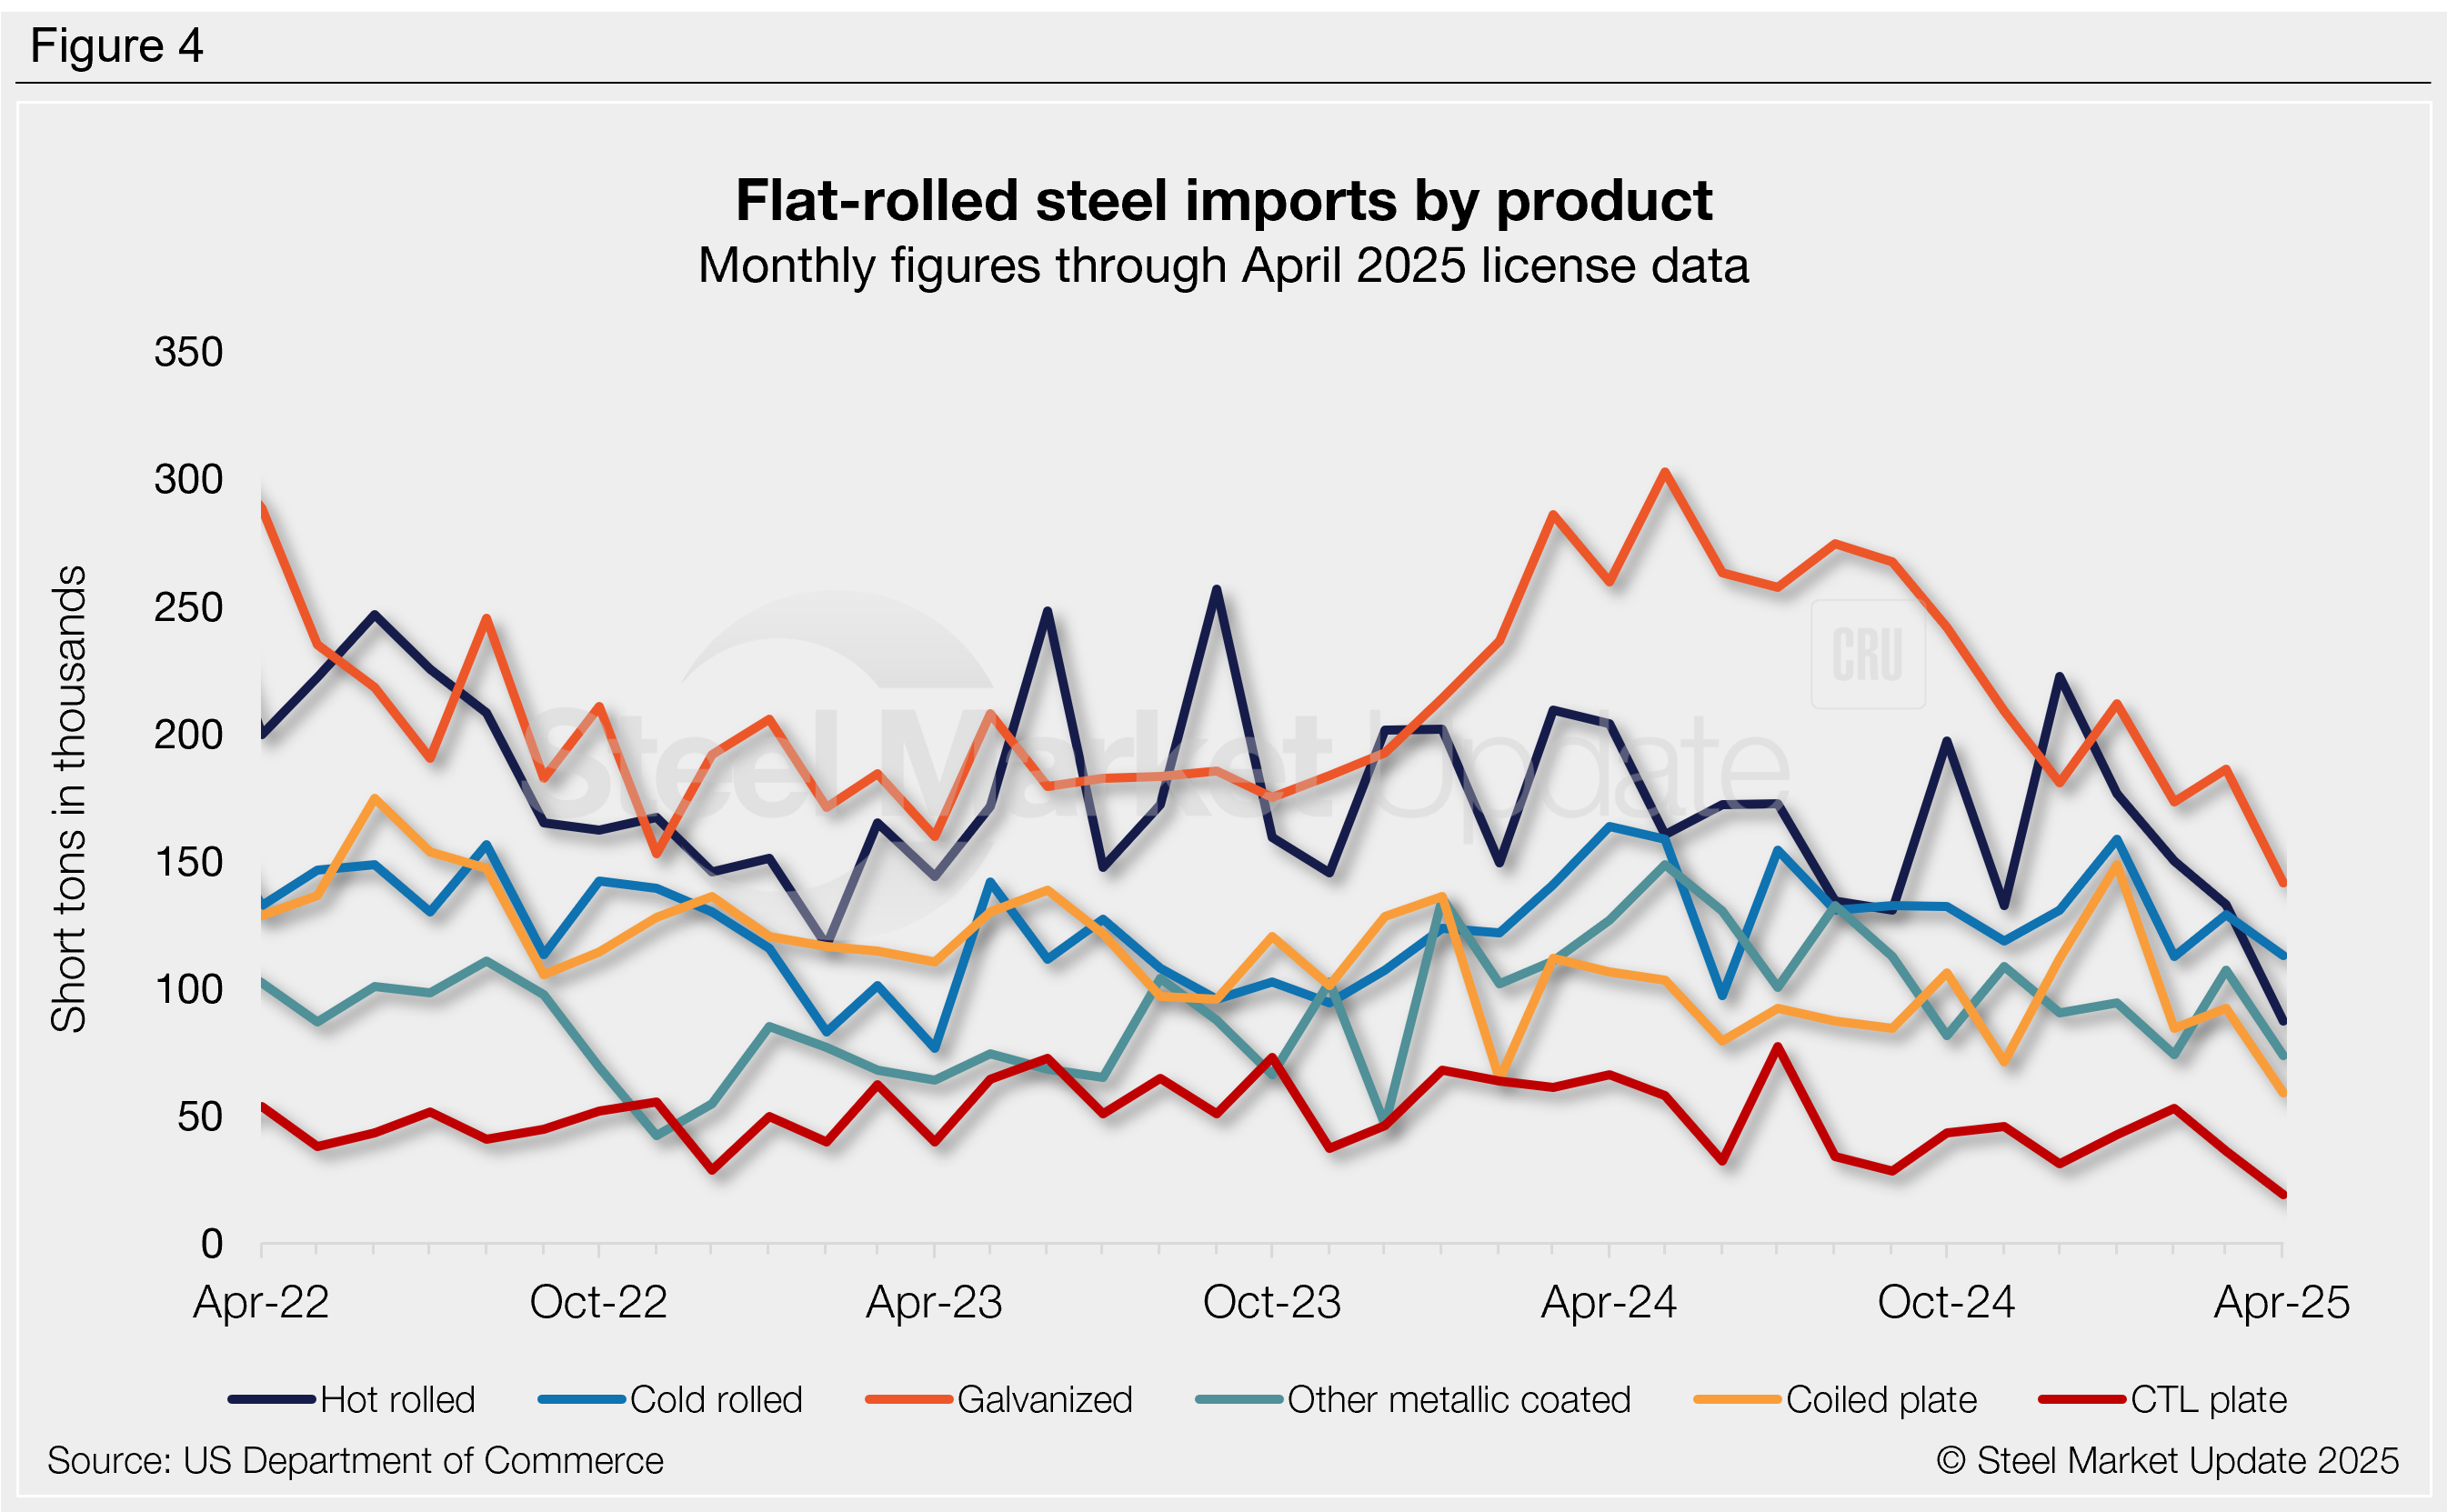
Figure 4 tracks flat rolled imports for seven popular products. Four of these products increased from February to March, while all but one declined in April. Key highlights:
- Hot-rolled coil imports fell 12% m/m in March and then plunged another 34% in April, potentially the lowest rate seen since 2009. Yes 2009!
- Cold-rolled coil rose 15% m/m in March, then slipped 12% through April to one of the lowest rates seen in the past year.
- Galvanized recovered 8% m/m in March from February’s 22-month low. April licenses are back down 24% to a near five-year low.
- Other-metallic coated jumped 45% m/m in March. April licenses are back down 31% to a 16-month low.
- Coiled plate increased 9% m/m in March. April licenses are down 36% to a four-year low.
- CTL plate declined 31% m/m in March, falling another 47% in April to potentially the lowest rate seen in our 27-year data history.
- Tin plate fell 5% m/m in March, and April licenses rebounded 34%, the highest rate seen in our 6-year data history.