Analysis

October 31, 2025
SMU Steel Demand Index improves but remains in contraction
Written by David Schollaert
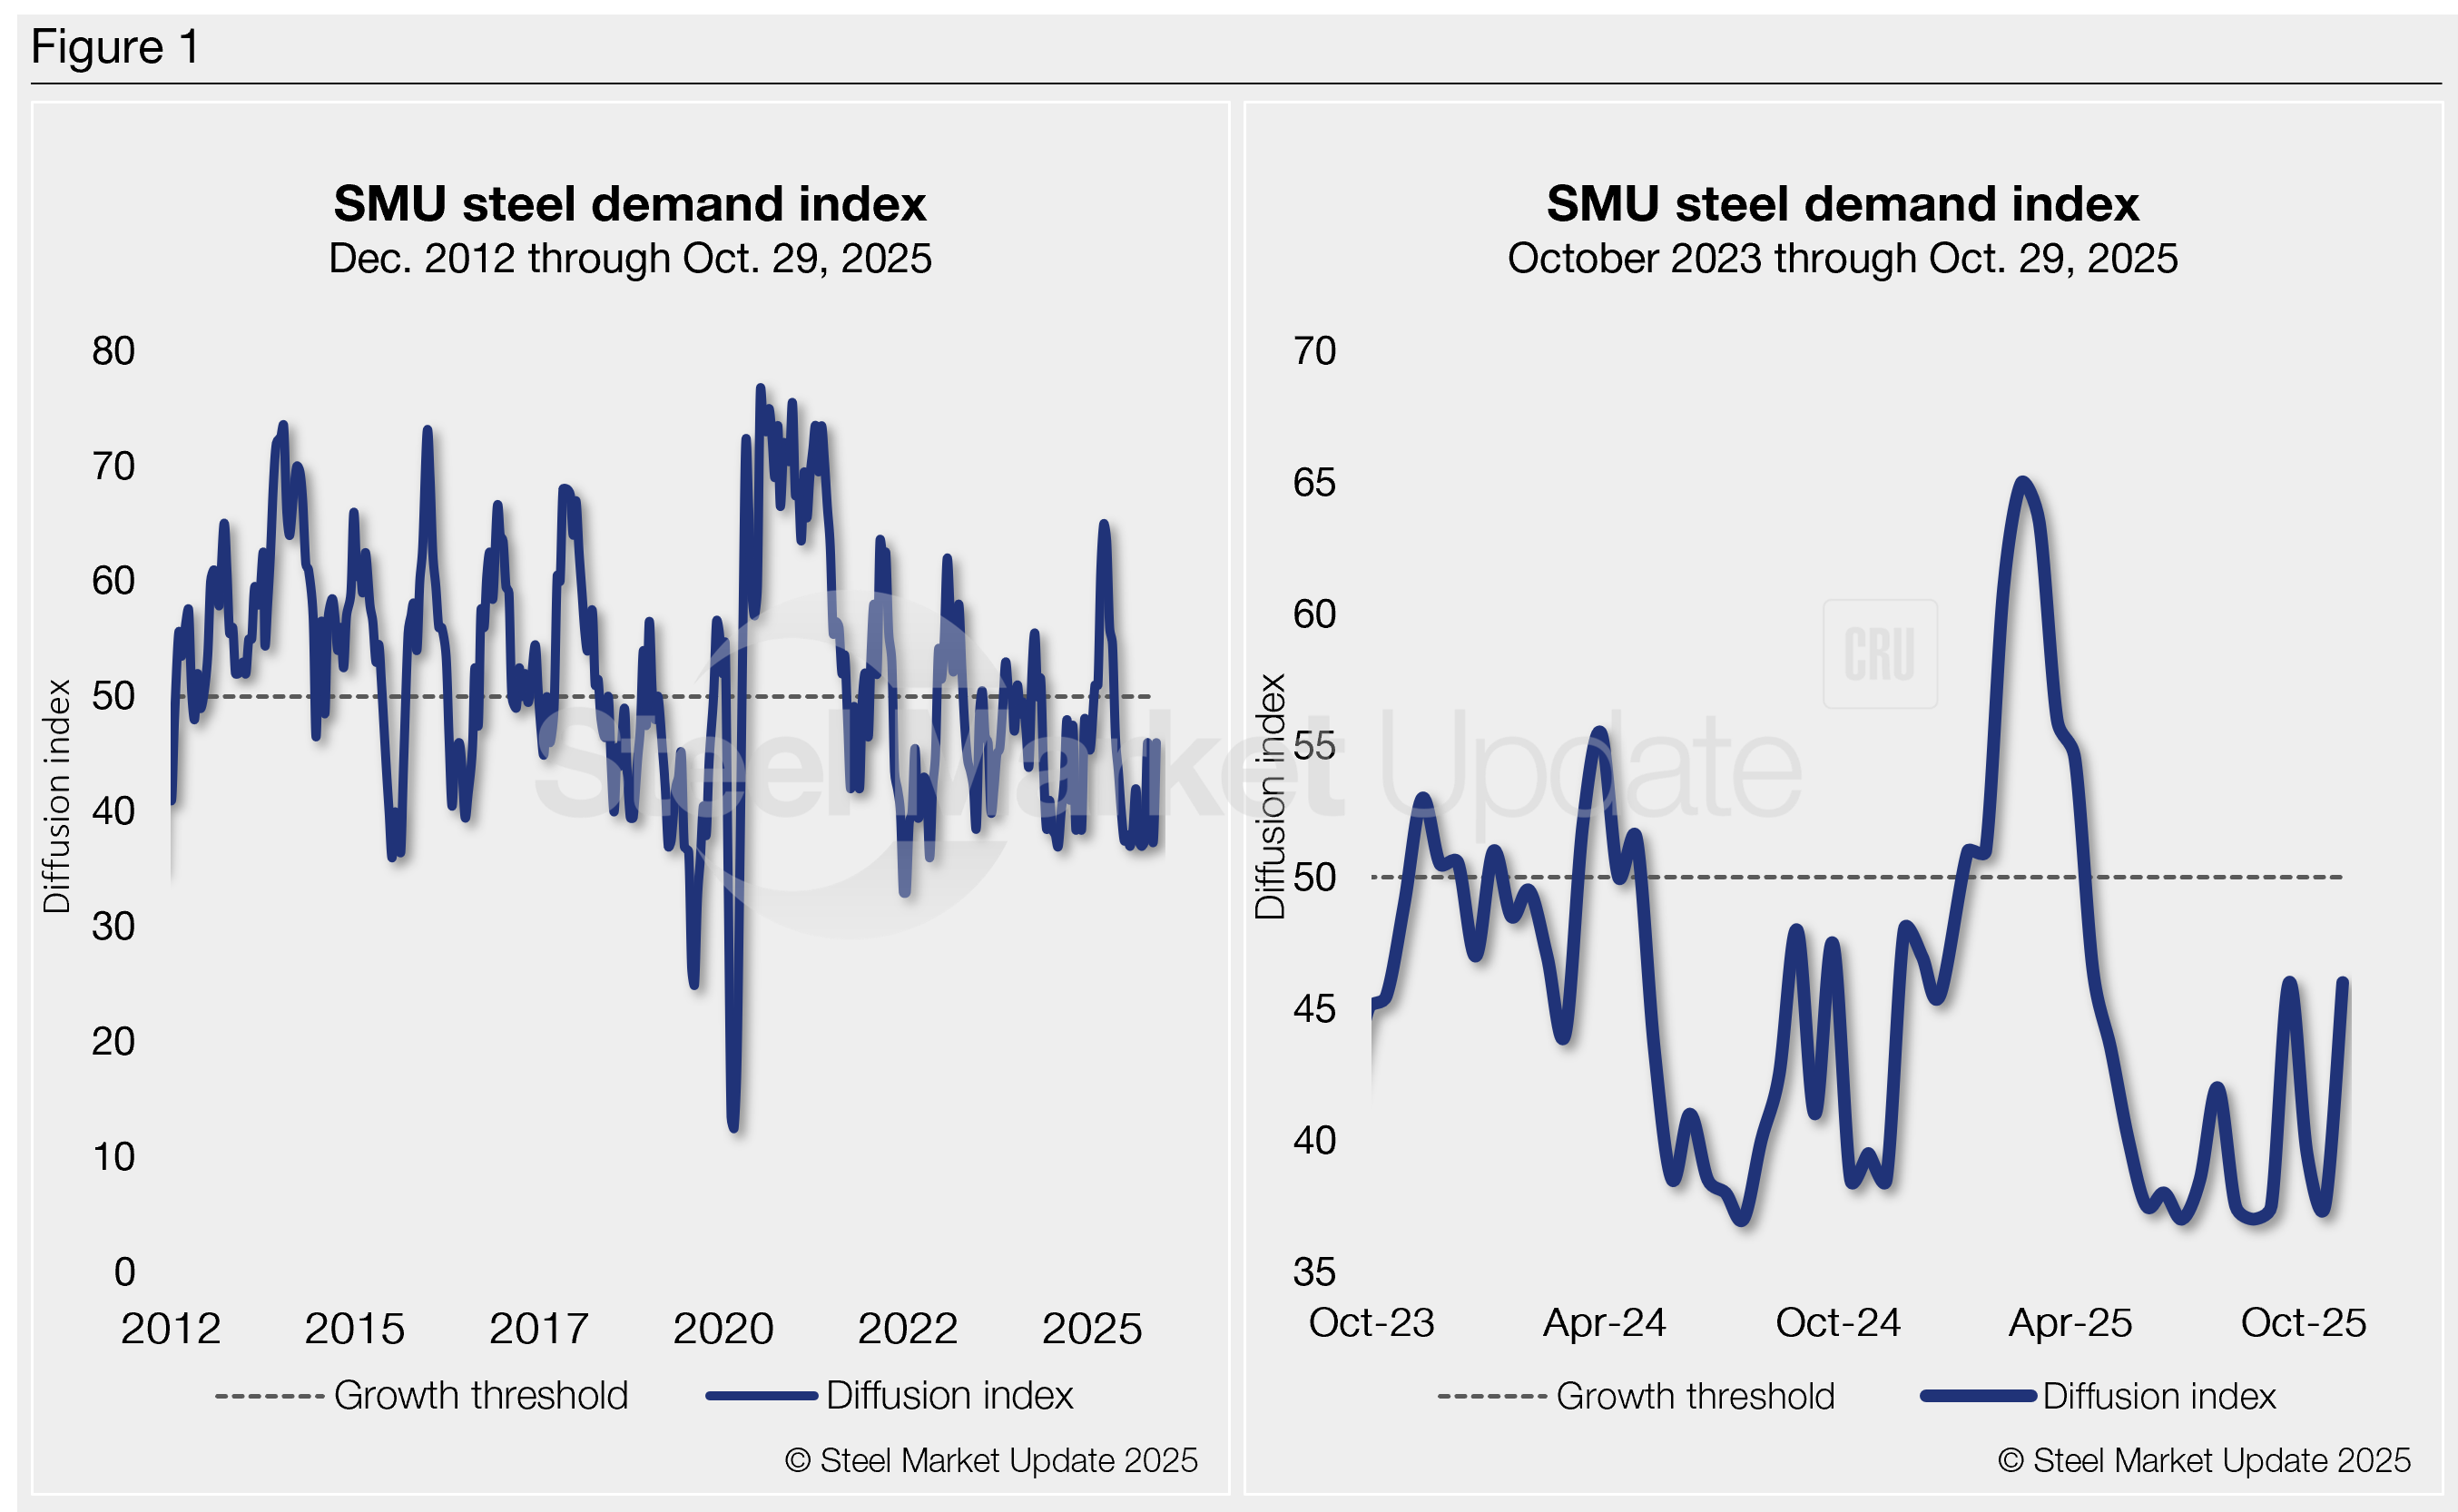
SMU’s Steel Demand Index increased from early October but remains below the expansion threshold, according to late October indicators.
The Steel Demand Index, compiled from our survey data, now stands at 46, a jump from 37.5 in early October, but off from a four-year high of 65.0 in late February.
Though growth faded at a slower pace, it rebounded from one of the lowest readings year to date from earlier in the month. The slowdown remains largely in place due to softer demand and ongoing tariff uncertainty.
Following steady declines since the back half of March, the index has undergone a slight recovery in response to some Q4 buying backed by mill price hikes. But still, the index remains out of expansion territory and has struggled to find its footing since mid-April.
Methodology
Derived from the market surveys SMU conducts every two weeks, the index compares lead times and demand to create a diffusion index. This index has historically preceded lead times. This is notable given that lead times are often seen as a leading indicator of steel price moves. An index score above 50 indicates rising demand, and a score below 50 suggests declining demand.
Figure 1 shows the nearly 13-year history of the index on the left and provides a closer look at the Steel Demand Index readings of the past two years on the right.
Rearview mirror analysis
Last year, demand slipped. Not all at once—just a slow, steady drop. Spot buying faltered and prices faded. The index sank into contraction and stayed there most of 2024.
Momentum accelerated at the start of the year, driving growth. But despite brief price spikes — driven by sudden price increases from mills — market conditions have stayed soft due to sluggish end-use demand.
That has been a very similar story for 2025 as well. The main caveat is that tariffs appear to have set a slightly higher floor this year.
A tale of shifting tariffs
Early optimism with the arrival of the new administration faded after a reworked Section 232 tariff stirred the market. And while tariff uncertainty has curbed buying, weaker demand has been the culprit.
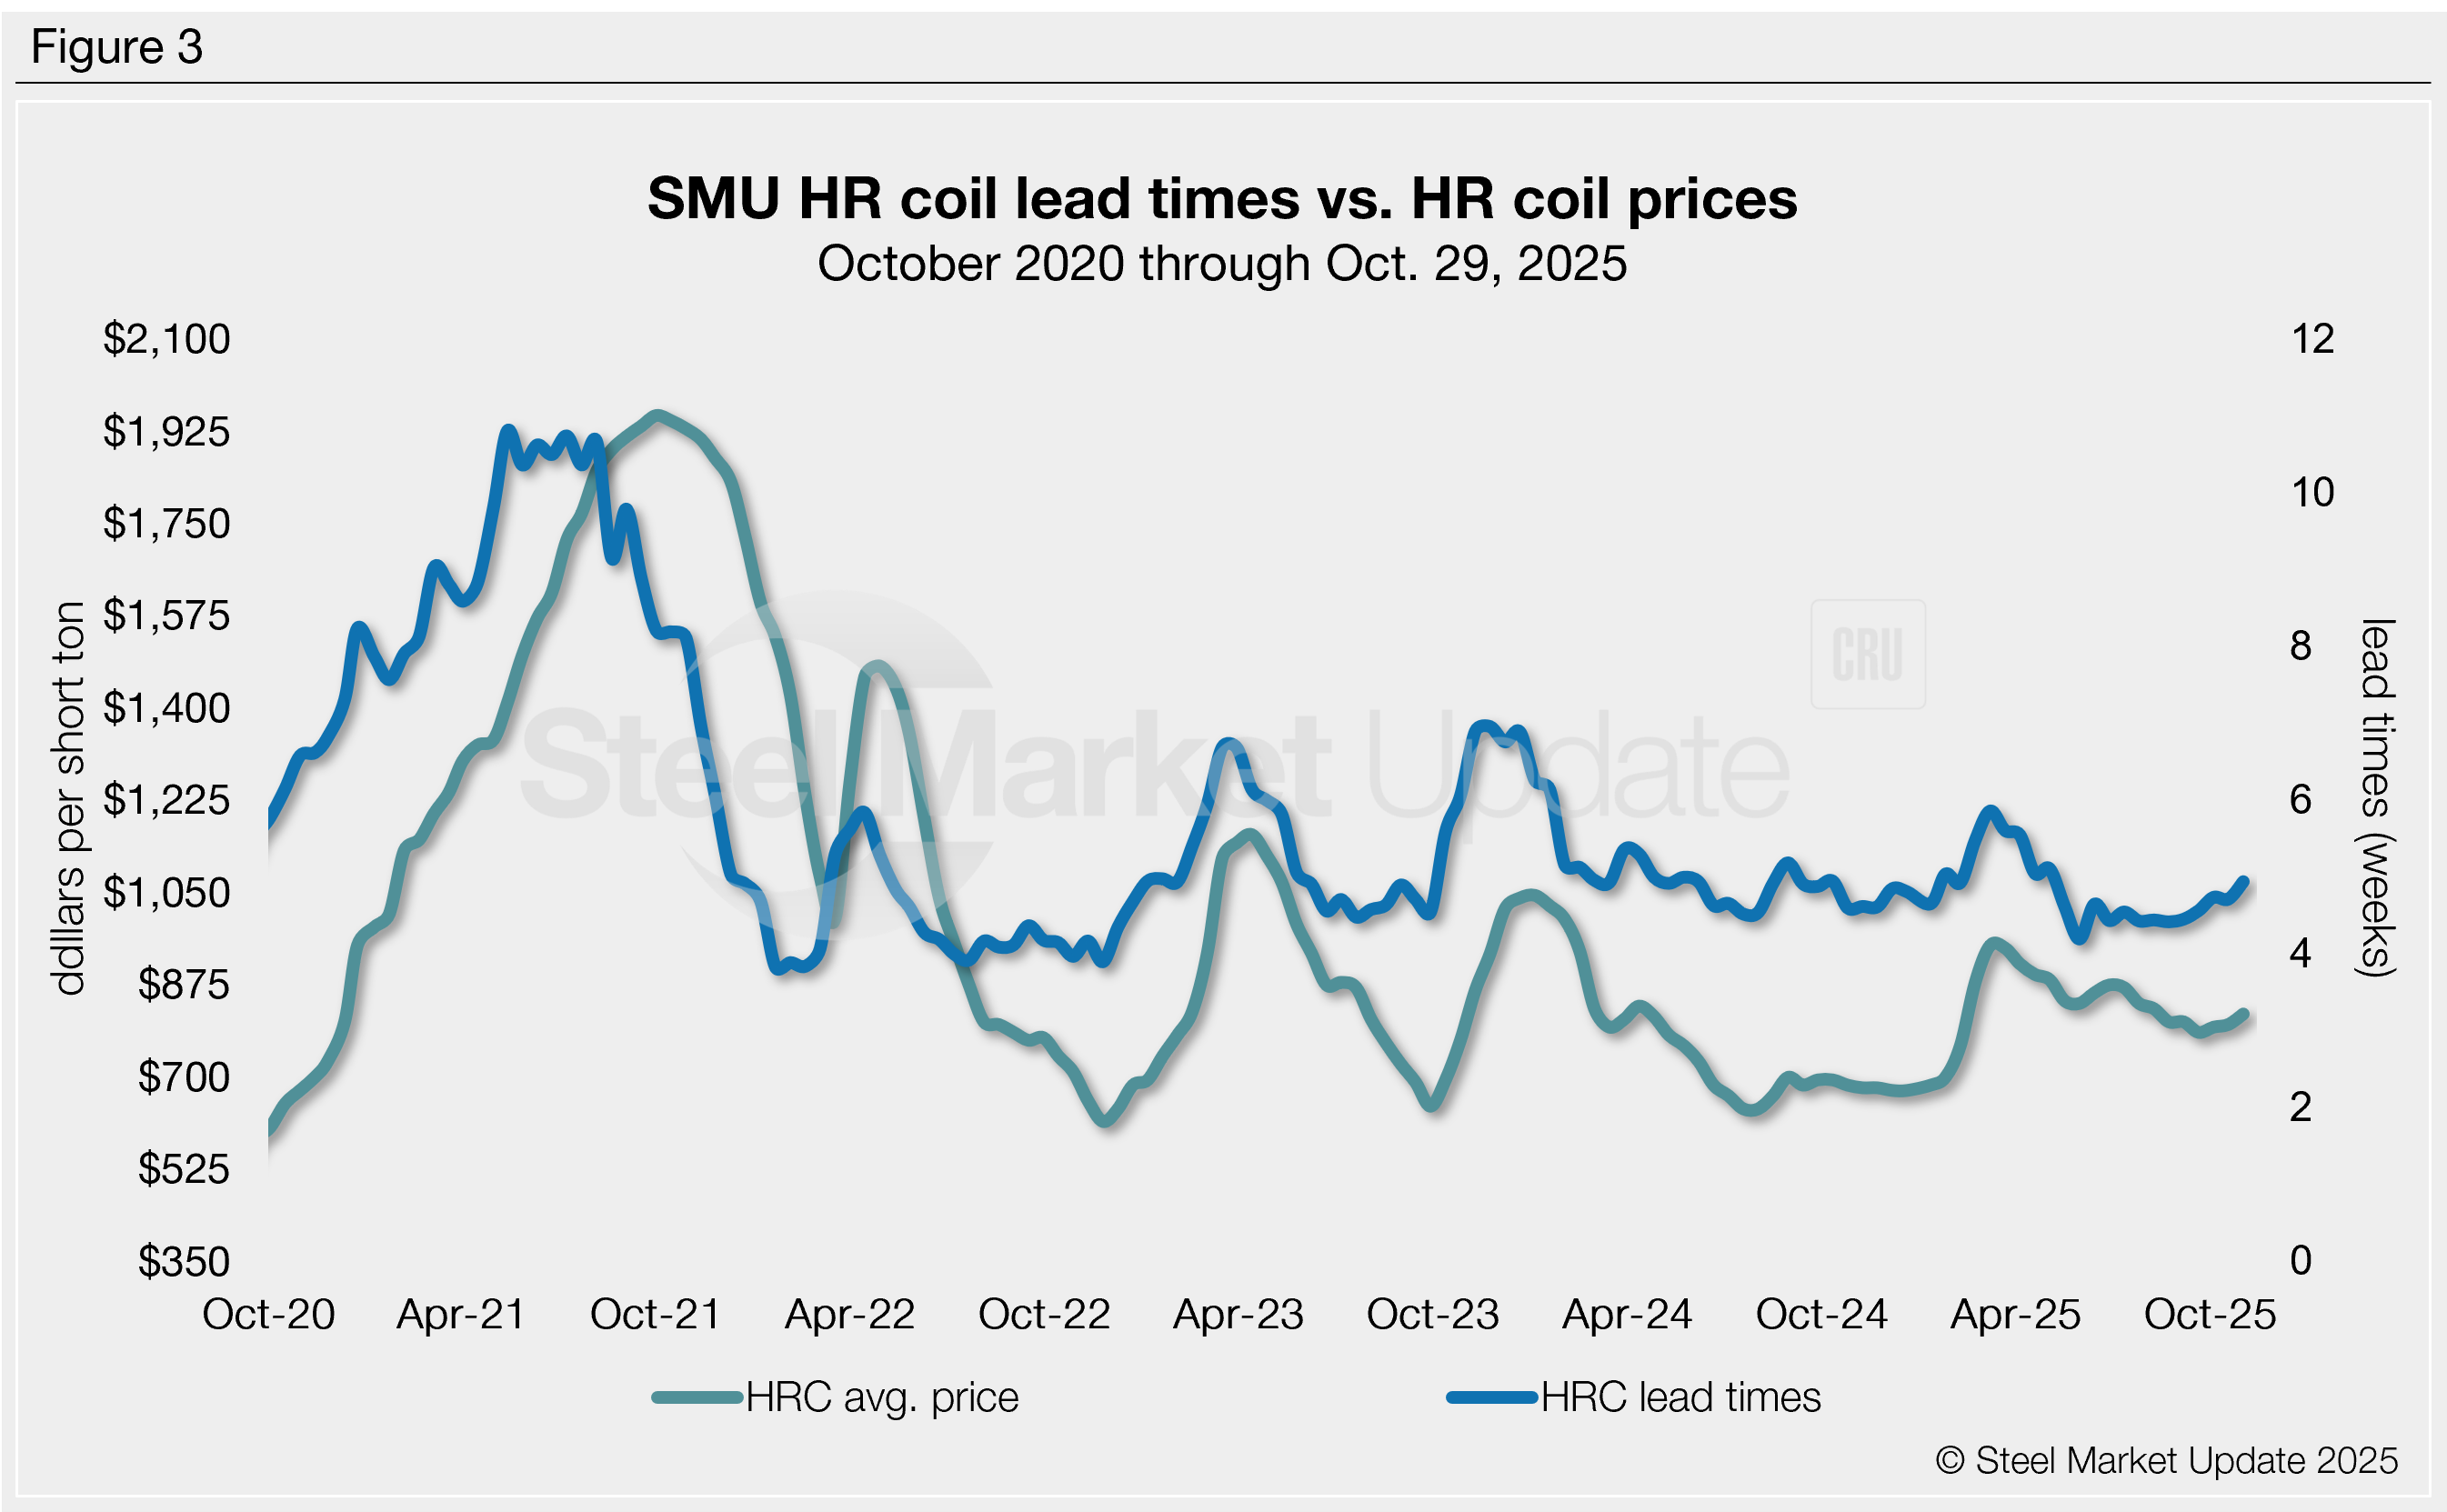
HR coil prices have seen a similar trend, reaching $950 per short ton (st) on average in early March. But then proceeded to slowly decline for nearly 30 straight weeks to $795/st—now averaging $820/st, according to SMU’s latest market check on Tuesday, Oct. 28.
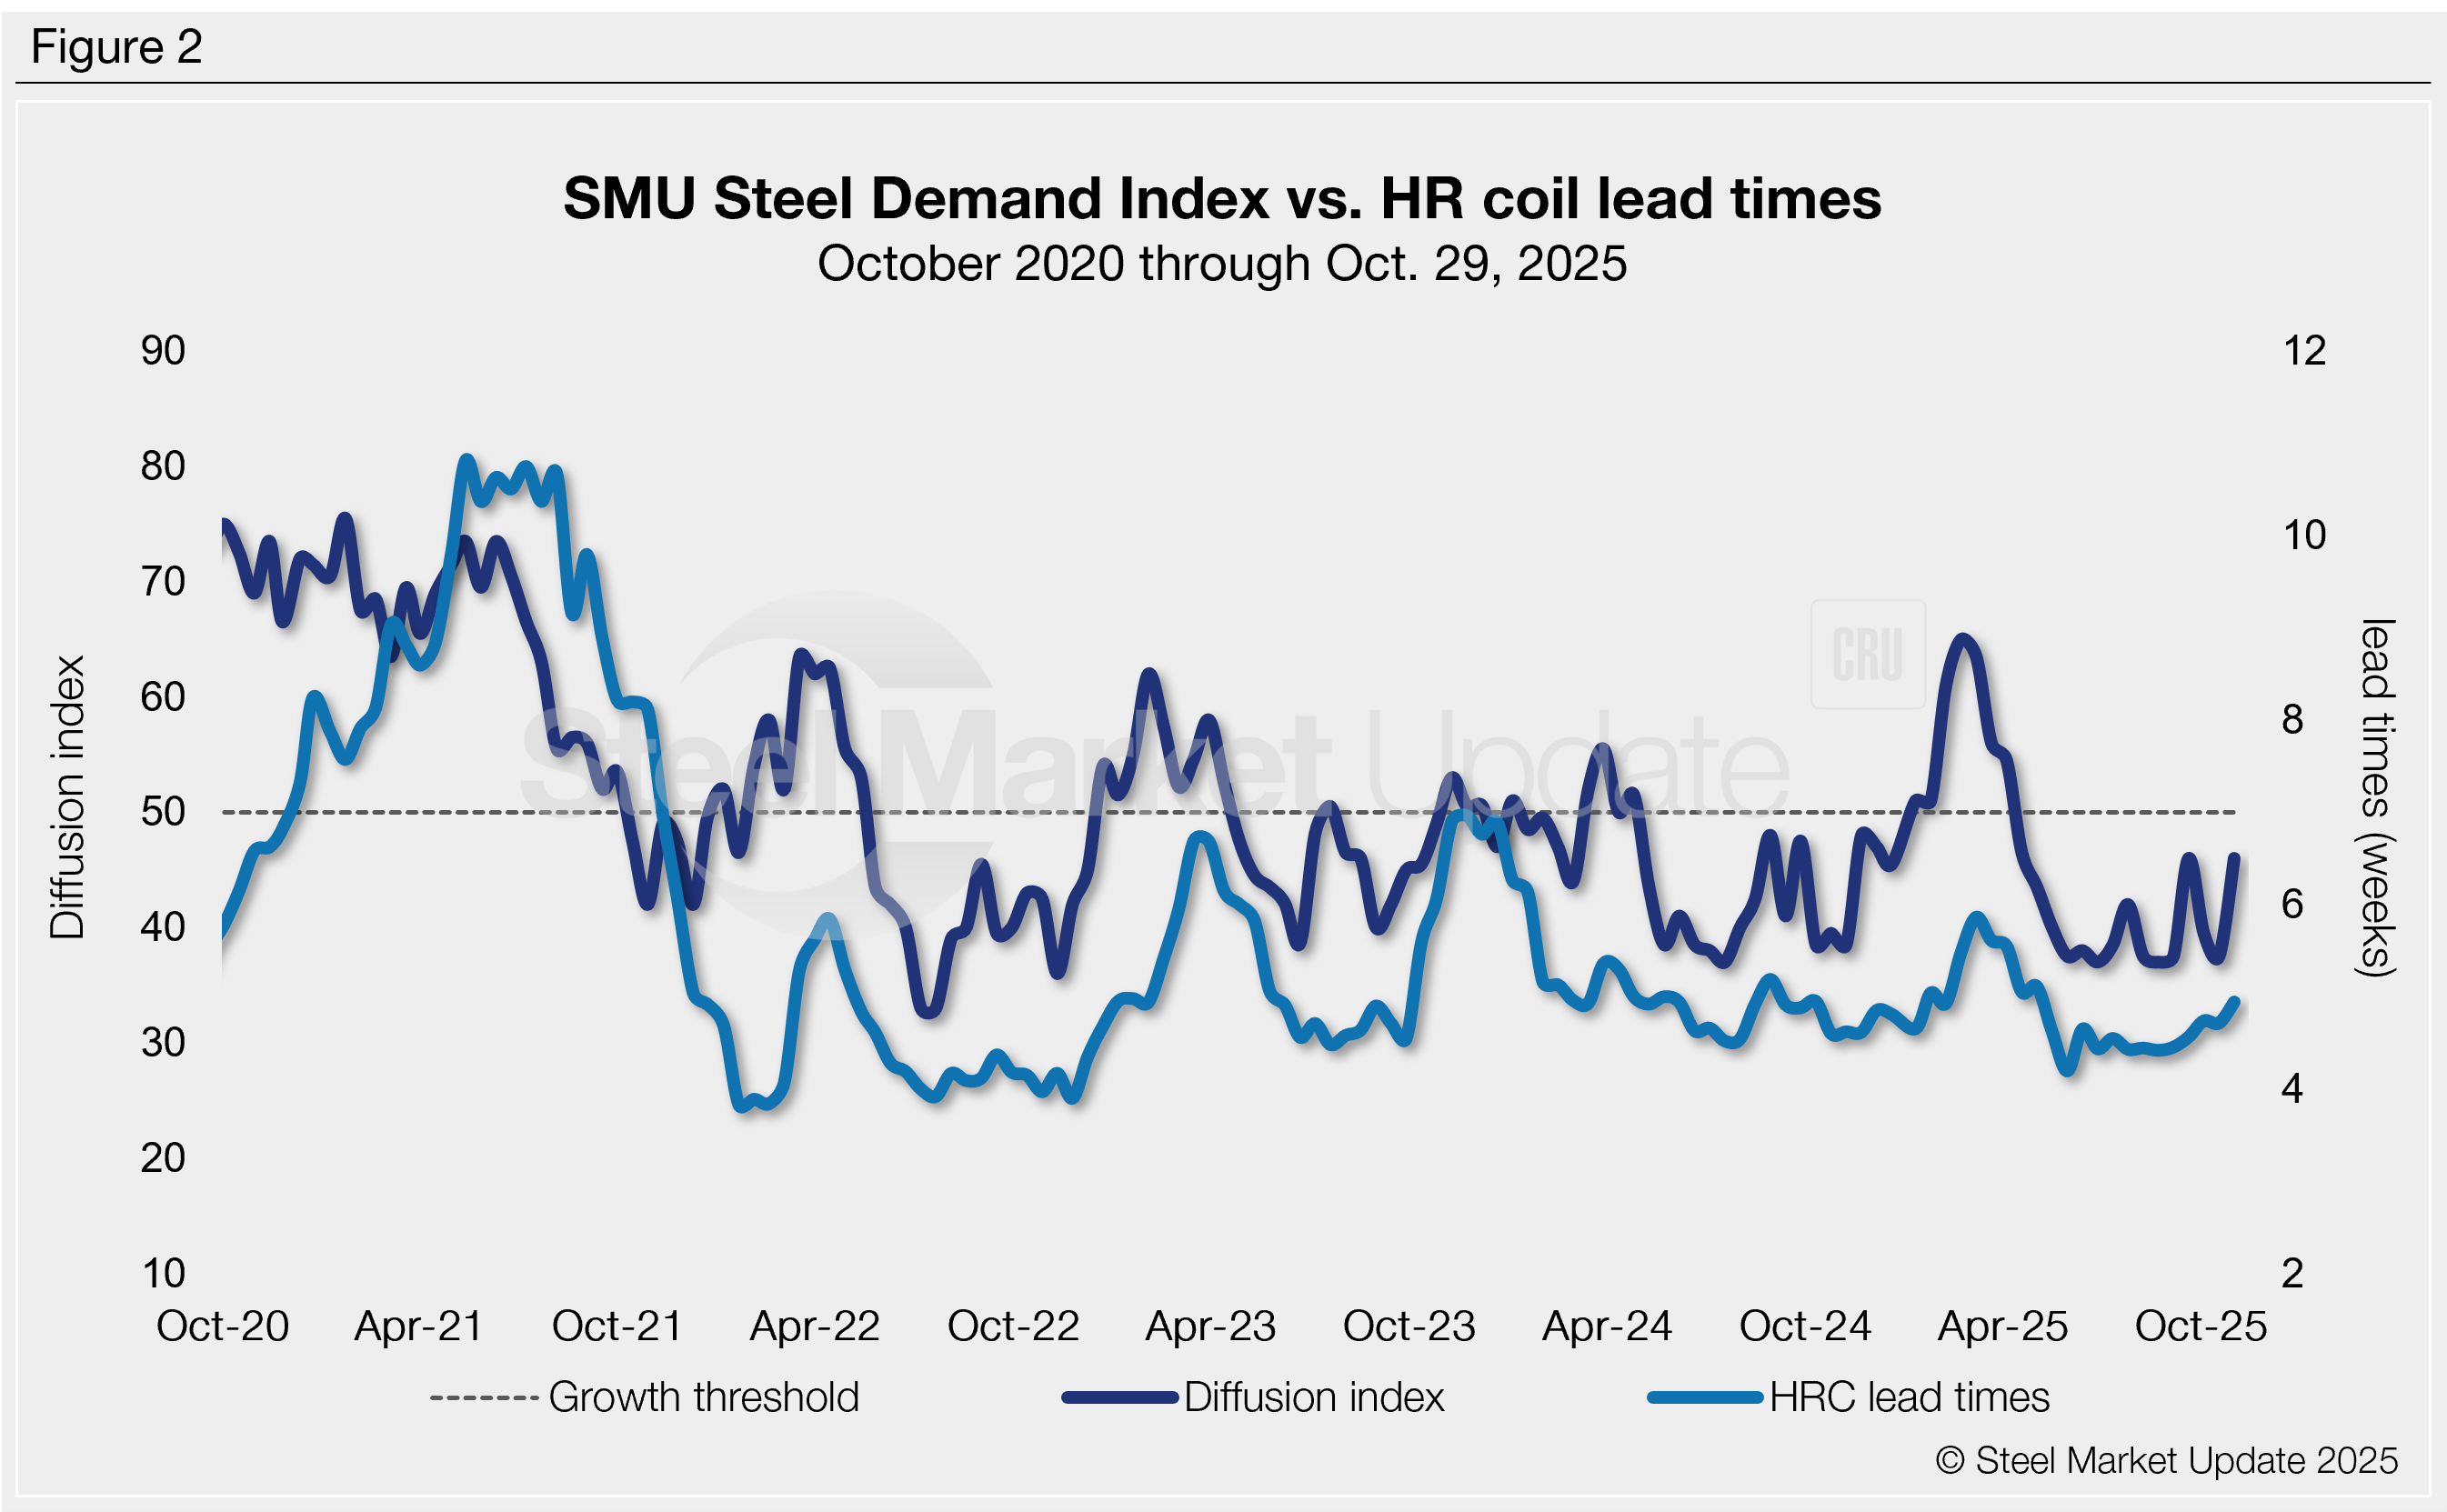
Lead times remain below five weeks on average, now at 4.94 weeks in our latest assessment on Oct. 29, but are at their highest reading since early May.
For nearly a decade, SMU’s steel demand diffusion index has preceded moves in mill lead times (Figure 2), and SMU’s lead times have also been a leading indicator of flat-rolled steel prices, particularly for HRC (Figure 3).
Signals ahead
Demand is steady, but buying remains largely tied to contracts—in many cases, buyers are taking max volumes but buying sparingly on spot. Most appear to remain unwilling to carry excess inventory.
We’ve seen a drop in mills willing to talk price, with sources telling SMU that mills are pushing back, trying to make the recent hikes stick. This comes on the heels of fall maintenance outages and potentially ahead of year-end buying.
Prices are inching higher after but is there enough demand and momentum to carry them through Q4 and into 2026? Some believe so, especially with reports of new projects for Q1’26 and beyond, but time will tell.
Editor’s note
Demand, lead times, and prices are based on the average data from manufacturers and steel service centers participating in SMU’s market trends analysis surveys. Our demand and lead times do not predict prices but are leading indicators of overall market dynamics and potential pricing dynamics. Look to your mill rep for actual lead times and prices.