Analysis

November 20, 2025
HR Futures: Movement in the market
Written by Daniel Doderer
In the month since my last column, the tides have started to turn – and as usual it wasn’t the physical market that moved first.
The curve began to firm quietly in late October, with the front end pushing higher and the second and third months finally breaking out of the tight $40–50 range that defined most of the summer. At the time, that strength looked more like positioning than fundamentals. But as October closed and November progressed, those gains turned out to be an early signal, with the physical market following shortly after.
Back then, I wrote that there were no clear catalysts pointing to a strong move in either direction – and you could still make that case today (and I would). Still, Occam’s razor suggests the obvious drivers were always going to catch up. Imports remain barely a trickle, inventories are uncomfortably low (even though they’ve hovered at these levels for a while), and the market had been quietly coiling. When you zoom out, that buildup becomes much easier to see. The chart below combines physical and financial data to tell the story of the past few months.
SMU mid-month price ranges and forward curves
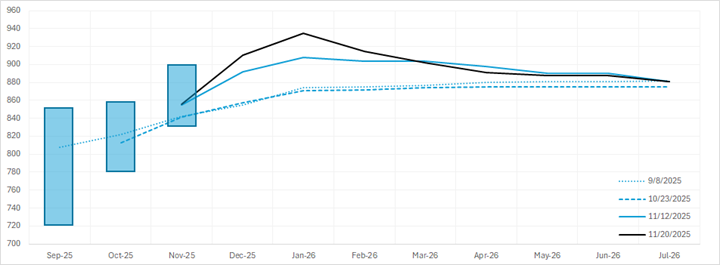
The shaded bars show SMU’s mid-month price ranges over the last three months. You can see that while futures barely budged from early September (dotted) through the end of October (dashed) – more on that in a moment – the low end of the physical range was steadily firming.
Mills clearly felt their bargaining power improving as maintenance season kicked in, and the flurry of price announcements (along with steady week-to-week increases in Nucor’s CSP) might have been the spark the market needed. Once futures began to lift, the spot market was effectively locked in place. Both the floor and the ceiling shifted higher. Mills are now holding the line as lead times stretch into early 2026, and the calendar is in their favor.
The issue, of course, is that supply-led rallies tend to have abbreviated lifespans. In some respects, tariff action this year has been a textbook example of how quickly supply-driven strength can appear and fade. The next chart offers another lens on the same idea by breaking the curve into three rolling buckets: 2–4 months up front (solid), 5–7 months in the middle (dashed), and 8–10 months in the back (dotted).
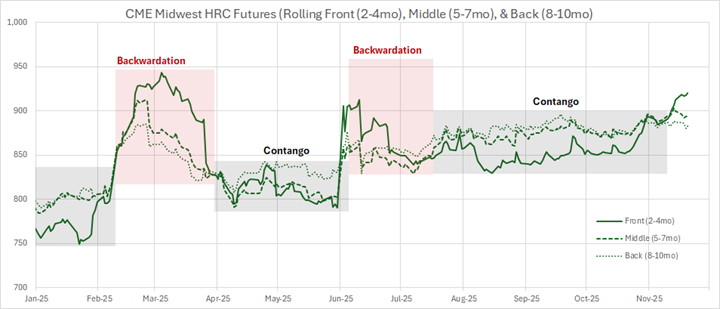
As a reminder, contango is when the back of the curve sits above the front, usually a sign the market feels comfortable or even oversupplied. Backwardation is the opposite: near-term prices rise above later months because buyers are more worried about getting material today than six months from now. Charting the curve this way lets us see both the deepening of the recent contango but also the rise in overall price levels while still capturing these underlying market structures.
What’s interesting is that aside from the two tariff-driven backwardation spikes earlier in the year, the curve has been in contango for nearly the entire year. That implies that even with low inventories and collapsing imports, domestic buyers were still comfortable enough not to chase tons early.
That brings us to the most important question: Will demand finally come through? On that front, I can’t offer an answer. But one thing worth flagging is the risk that this rally becomes too much of a good thing is rising.
Several people have noted that the spread between US HRC and Asian imports is now the widest it has been since mid-to-late summer. I’m not suggesting the import trend is about to flip, but that analysis also misses an important detail: when you look at the 3–4 month futures, you should tack on another ~$65, which would place the implied spread at its widest since the spring. That’s certainly something worth keeping on the radar.
Disclaimer
The content of this article is for informational purposes only. The views in this article do not represent financial services or advice. Any opinion expressed should not be treated as a specific inducement to make a particular investment or follow a particular strategy. Views and forecasts expressed are as of date indicated. They are subject to change without notice, may not come to be, and do not represent a recommendation or offer of any particular security, strategy or investment. Strategies mentioned may not be suitable for you. You must make an independent decision regarding investments or strategies mentioned in this article. It is recommended you consider your own particular circumstances and seek the advice from a financial professional before taking action in financial markets.