

Analysis

March 25, 2026
SMU's Mill Order Index slows in February
Written by David Schollaert
SMU’s Mill Order Index (MOI) eased in February, slowing momentum from repeated gains in December and January. The result came as a marginal increase in service center intake levels was offset by higher shipments, according to our latest service center inventories data.
Mill new order entries in February eased slightly, underpinned by efforts at the service center level to keep inventories in line with demand, a trend that has grown in complexity as the market continues to experience a supply-side squeeze.
But intake, though up, was subdued (a 1.1% rise) month on month (m/m) due to a nearly 7% increase in shipments. Additionally, new order entries slipped 1.6% in February vs. January, adding some concern for the supply pipeline with extended lead times.
Service centers’ daily shipping rates—up 6.7% from January—were higher despite having fewer shipping days. Average shipping days last month were 20, down from 21 in January.
Key highlights
Continued efforts to maintain leaner inventories remain center stage. This is noted by practically even m/m inventory totals—just a fractional increase—despite a decent increase in shipments in February. The dynamic is an attempt to keep service center supply in balance with demand.
Cautious buying remains at the forefront, as the downstream marketplace buys on an as-needed basis, relying heavily on contract tons. When comparing year-ago levels, inventories are down nearly 13%, and shipments are down 2%.
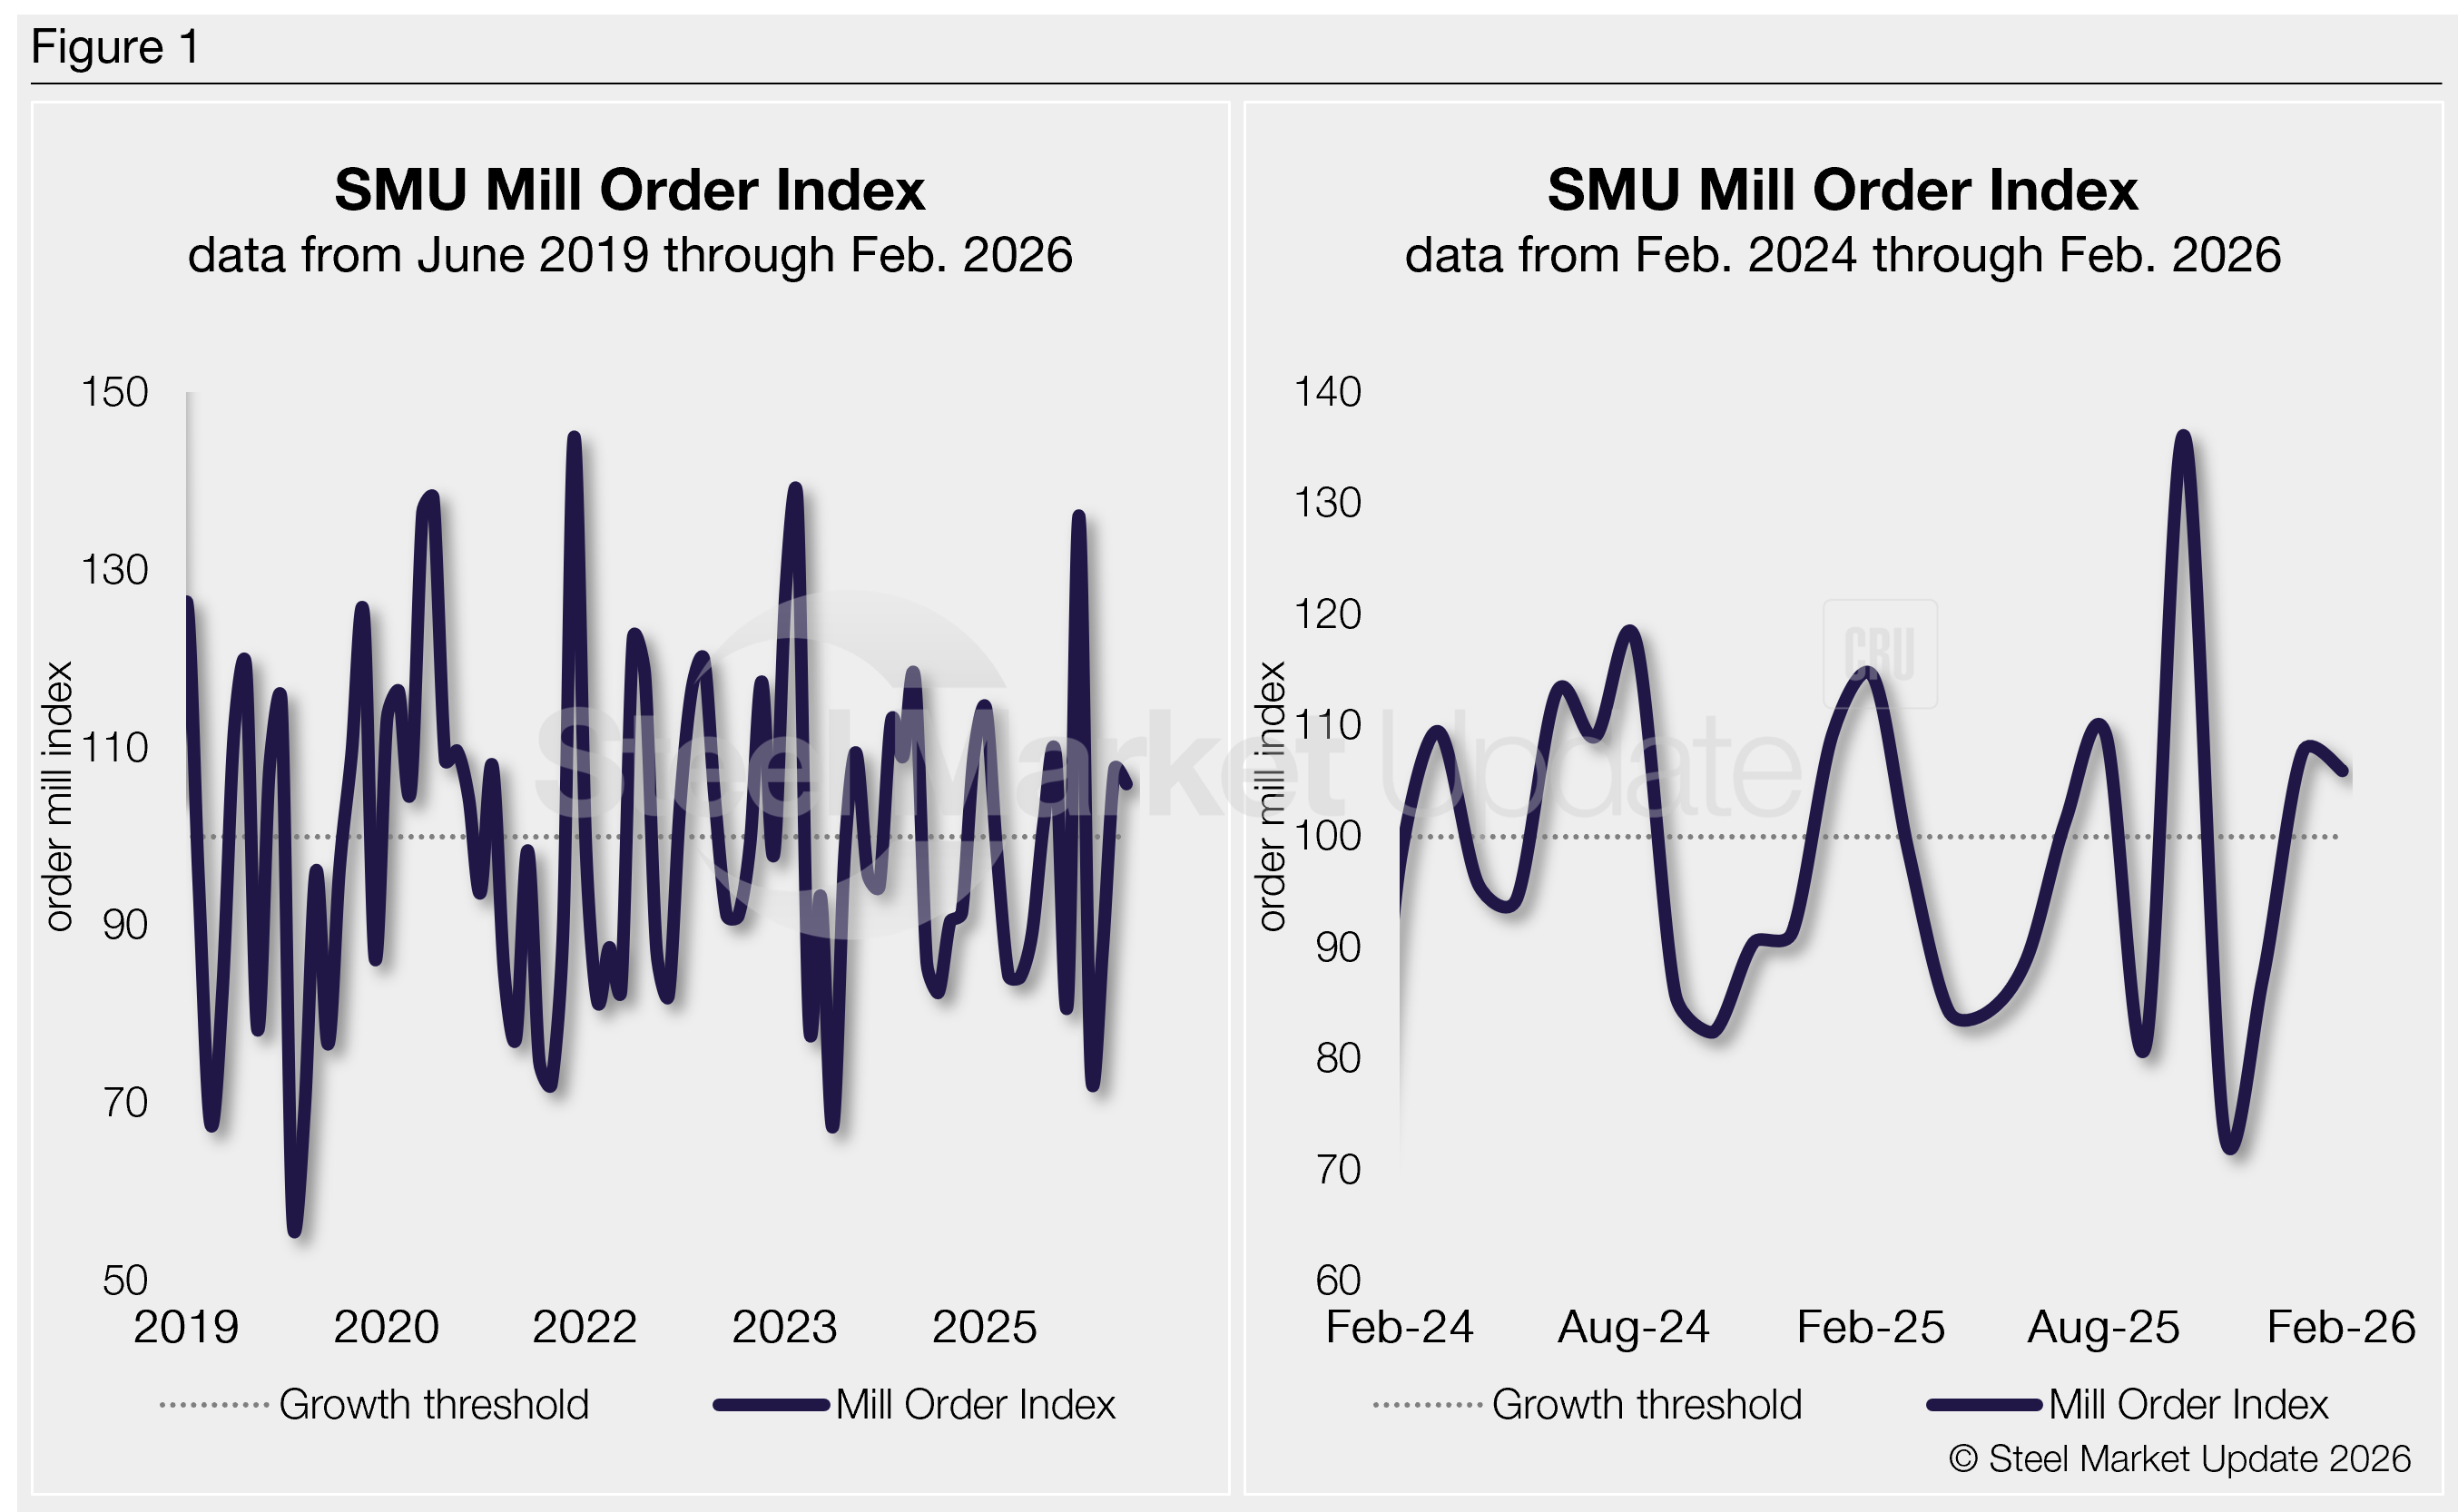
The MOI now stands at 105.9, down ~2% from 107.6 in January. The rate was below the typical seasonal reading and was down nearly 8% y/y. Results continue to suggest service centers are still closely monitoring inventories.
Methodology
SMU derives its MOI—a relative index that evaluates the latest change in service center mill order entries—from our monthly service center inventory data. This index is a good indicator of current service center buying patterns, displaying perceived demand and lead times. This stands out because lead times typically signal upcoming moves in steel prices.
The MOI uses a base period, presently 2022-24, to establish a reference point for measuring service centers’ mill orders over time. This base period is assigned an index value of 100. Subsequent MOI values are then calculated relative to this base.
An index score above 100 indicates an increase in buying, and a score below 100 indicates a decrease.
Figure 1 shows the nearly six-year history of the index on the left and provides a closer look at the MOI readings of the past two years on the right (100 = 2022-2024 average).
Background
Although there were brief price surges, overall market conditions stayed relatively stable and at times sluggish in 2025. And they were largely held back by stagnant end‑use demand (see the right‑side chart in Figure 1).
Intake volumes climbed through most of Q1’25, driven by downstream buyers accelerating purchases in anticipation of tariff‑related price hikes. The resulting jump in service‑center orders quickly pushed mill prices higher, but demand didn’t follow.
After reaching a high point a year ago, intake volumes began steadily softening, a trend observed since May. Service centers timed the market bottom in October, before riding it out to close 2025.
The skinny
It’s no surprise to see intake volumes generally improve in Q1, driven by seasonal gains. But gains remain subdued and behind year-ago levels. Downstream customers continue to tightly manage inventories, prioritizing contract fulfillment, even as service‑center shipments showed some marginal lift.
While new order entries saw a notable increase in October—reaching a two-year high—they declined by more than 30% in November to their lowest total since April 2020. And they have since been uneven, and well behind y/y levels.
Data would indicate the improvements through the first two months of 2026 are in line with seasonal improvements, rather than fundamental demand gains, especially as February volumes were largely flat. Mills, meanwhile, are pushing prices up, keeping production in check, driving a supply-side squeeze amid unhurried demand.
SMU’s MOI will likely fluctuate somewhat in March and into early Q2. The general expectation is that inventories could be impacted even as new order entries rise modestly, because of continued production delays, especially in some Midwest plants. The dynamic continues to push lead times out, directly impacting the supply pipeline as seasonal demand ticks up.
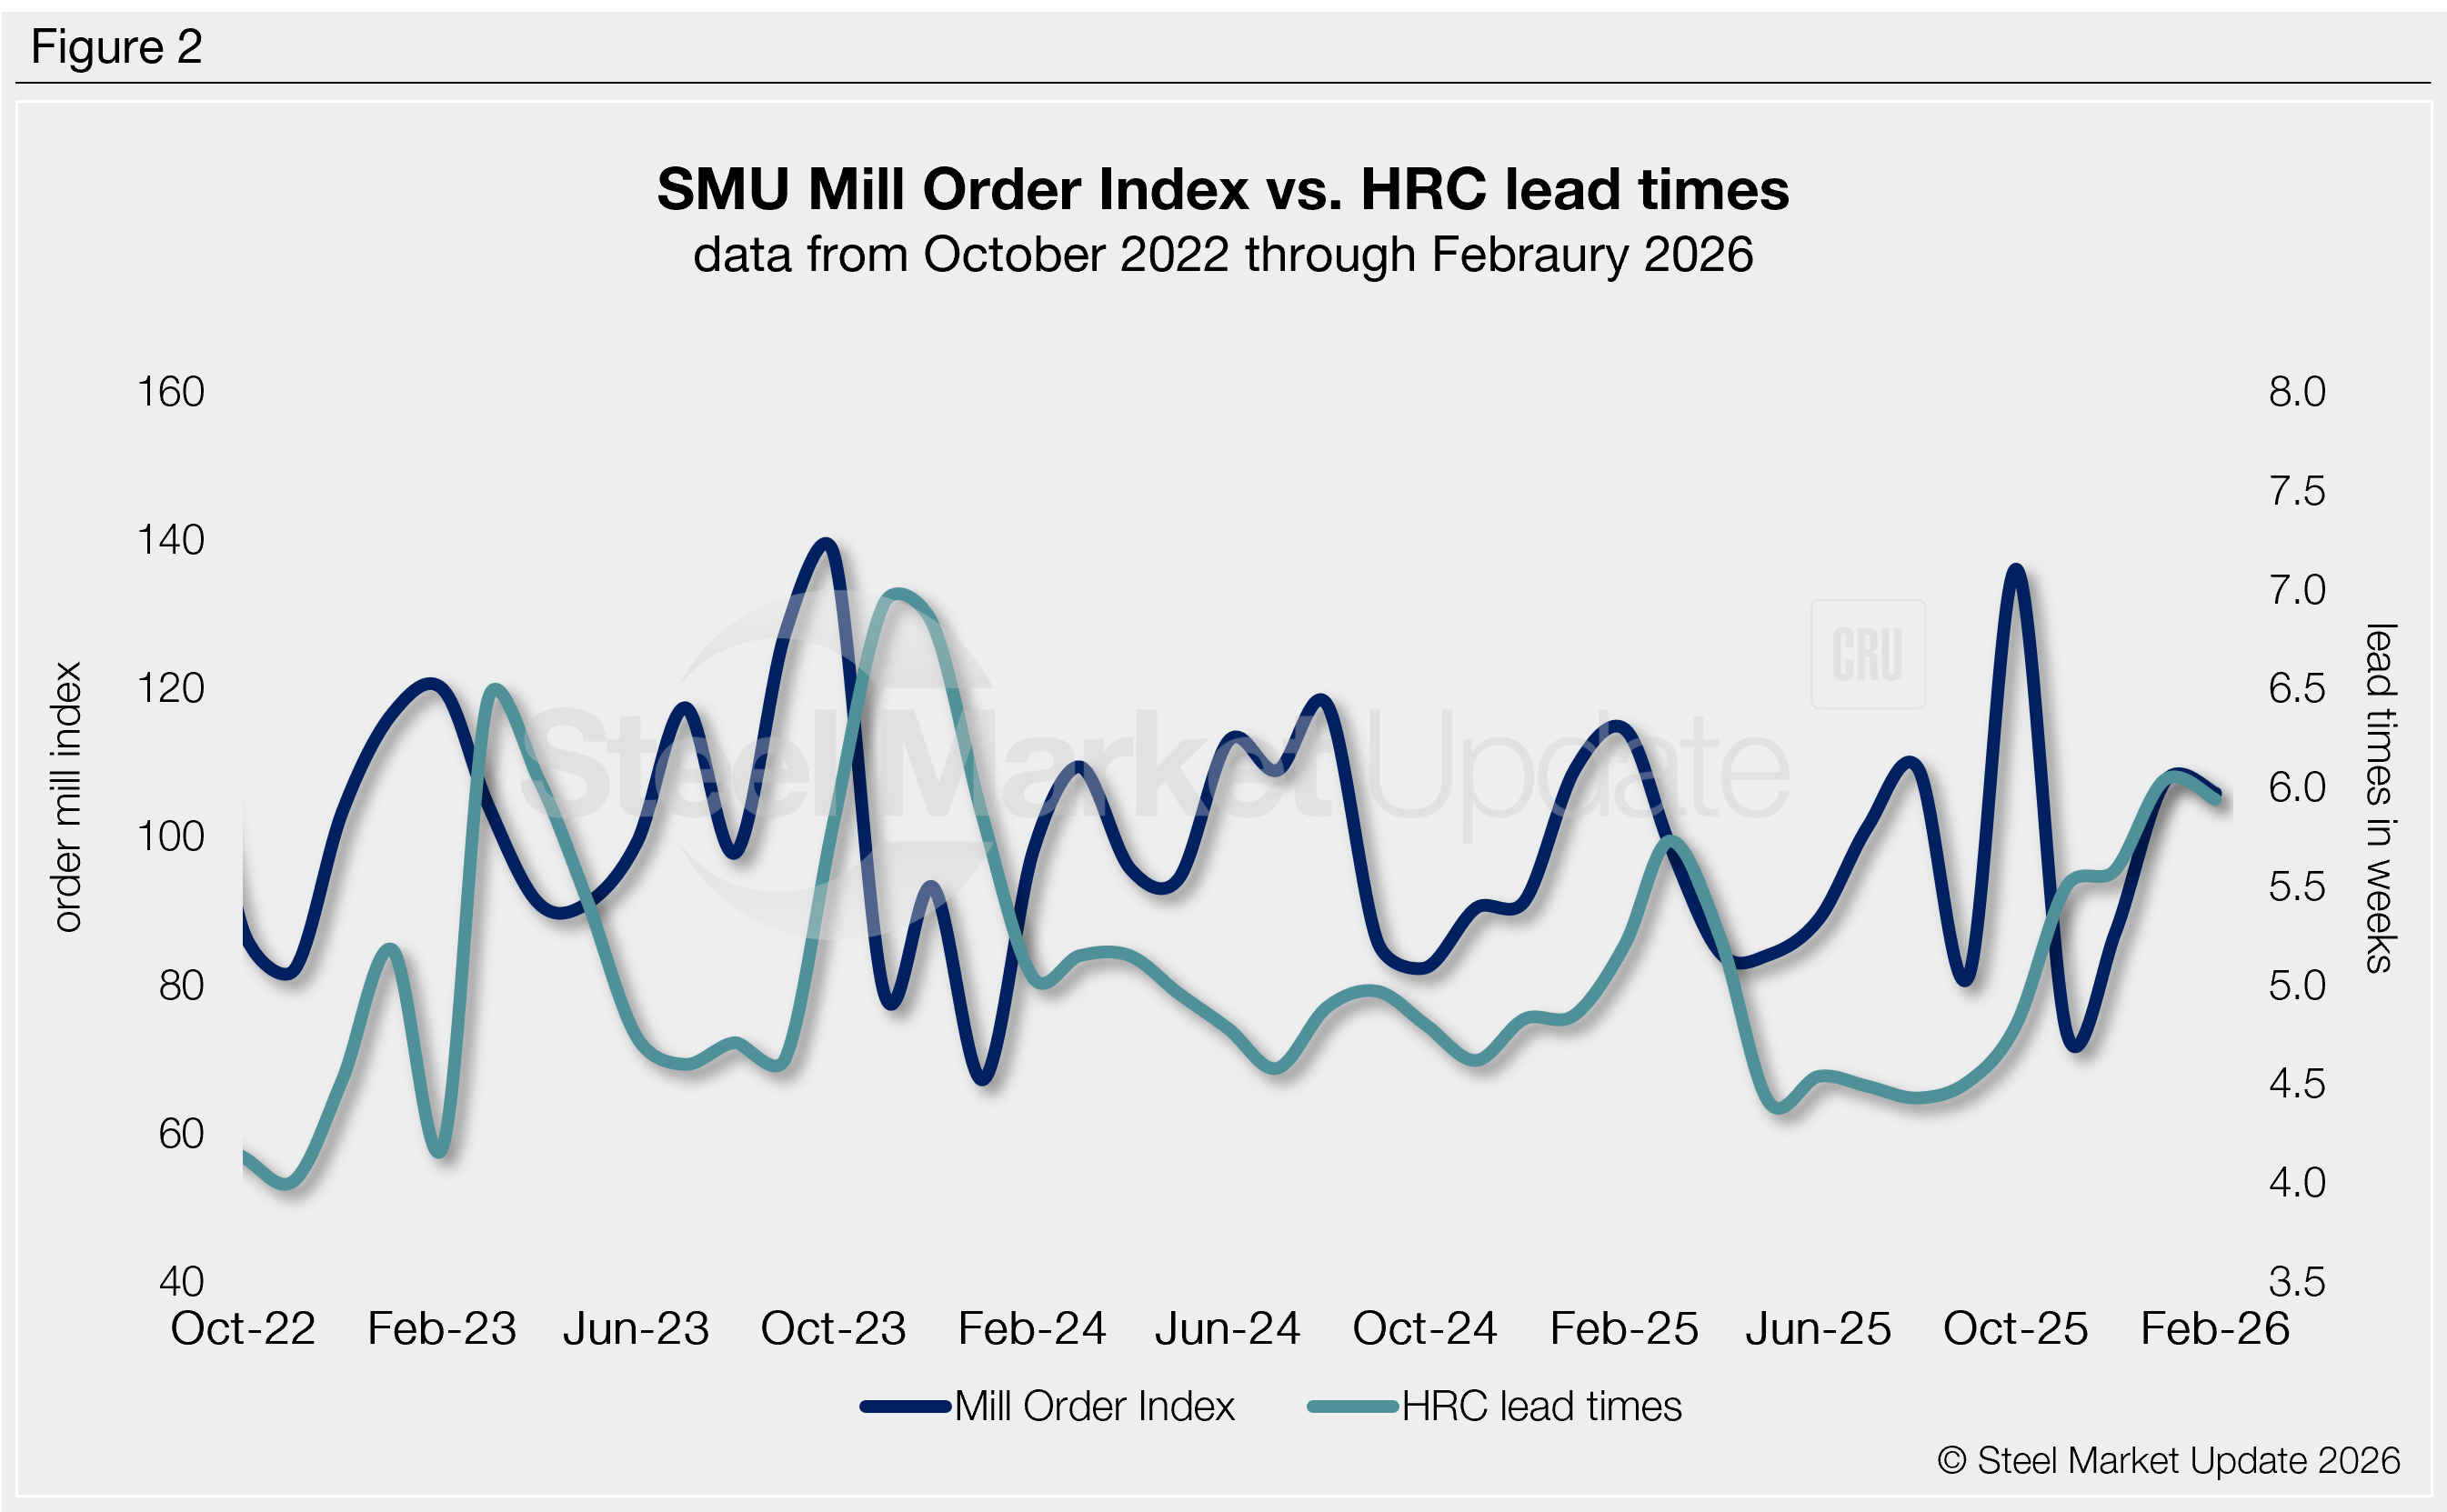
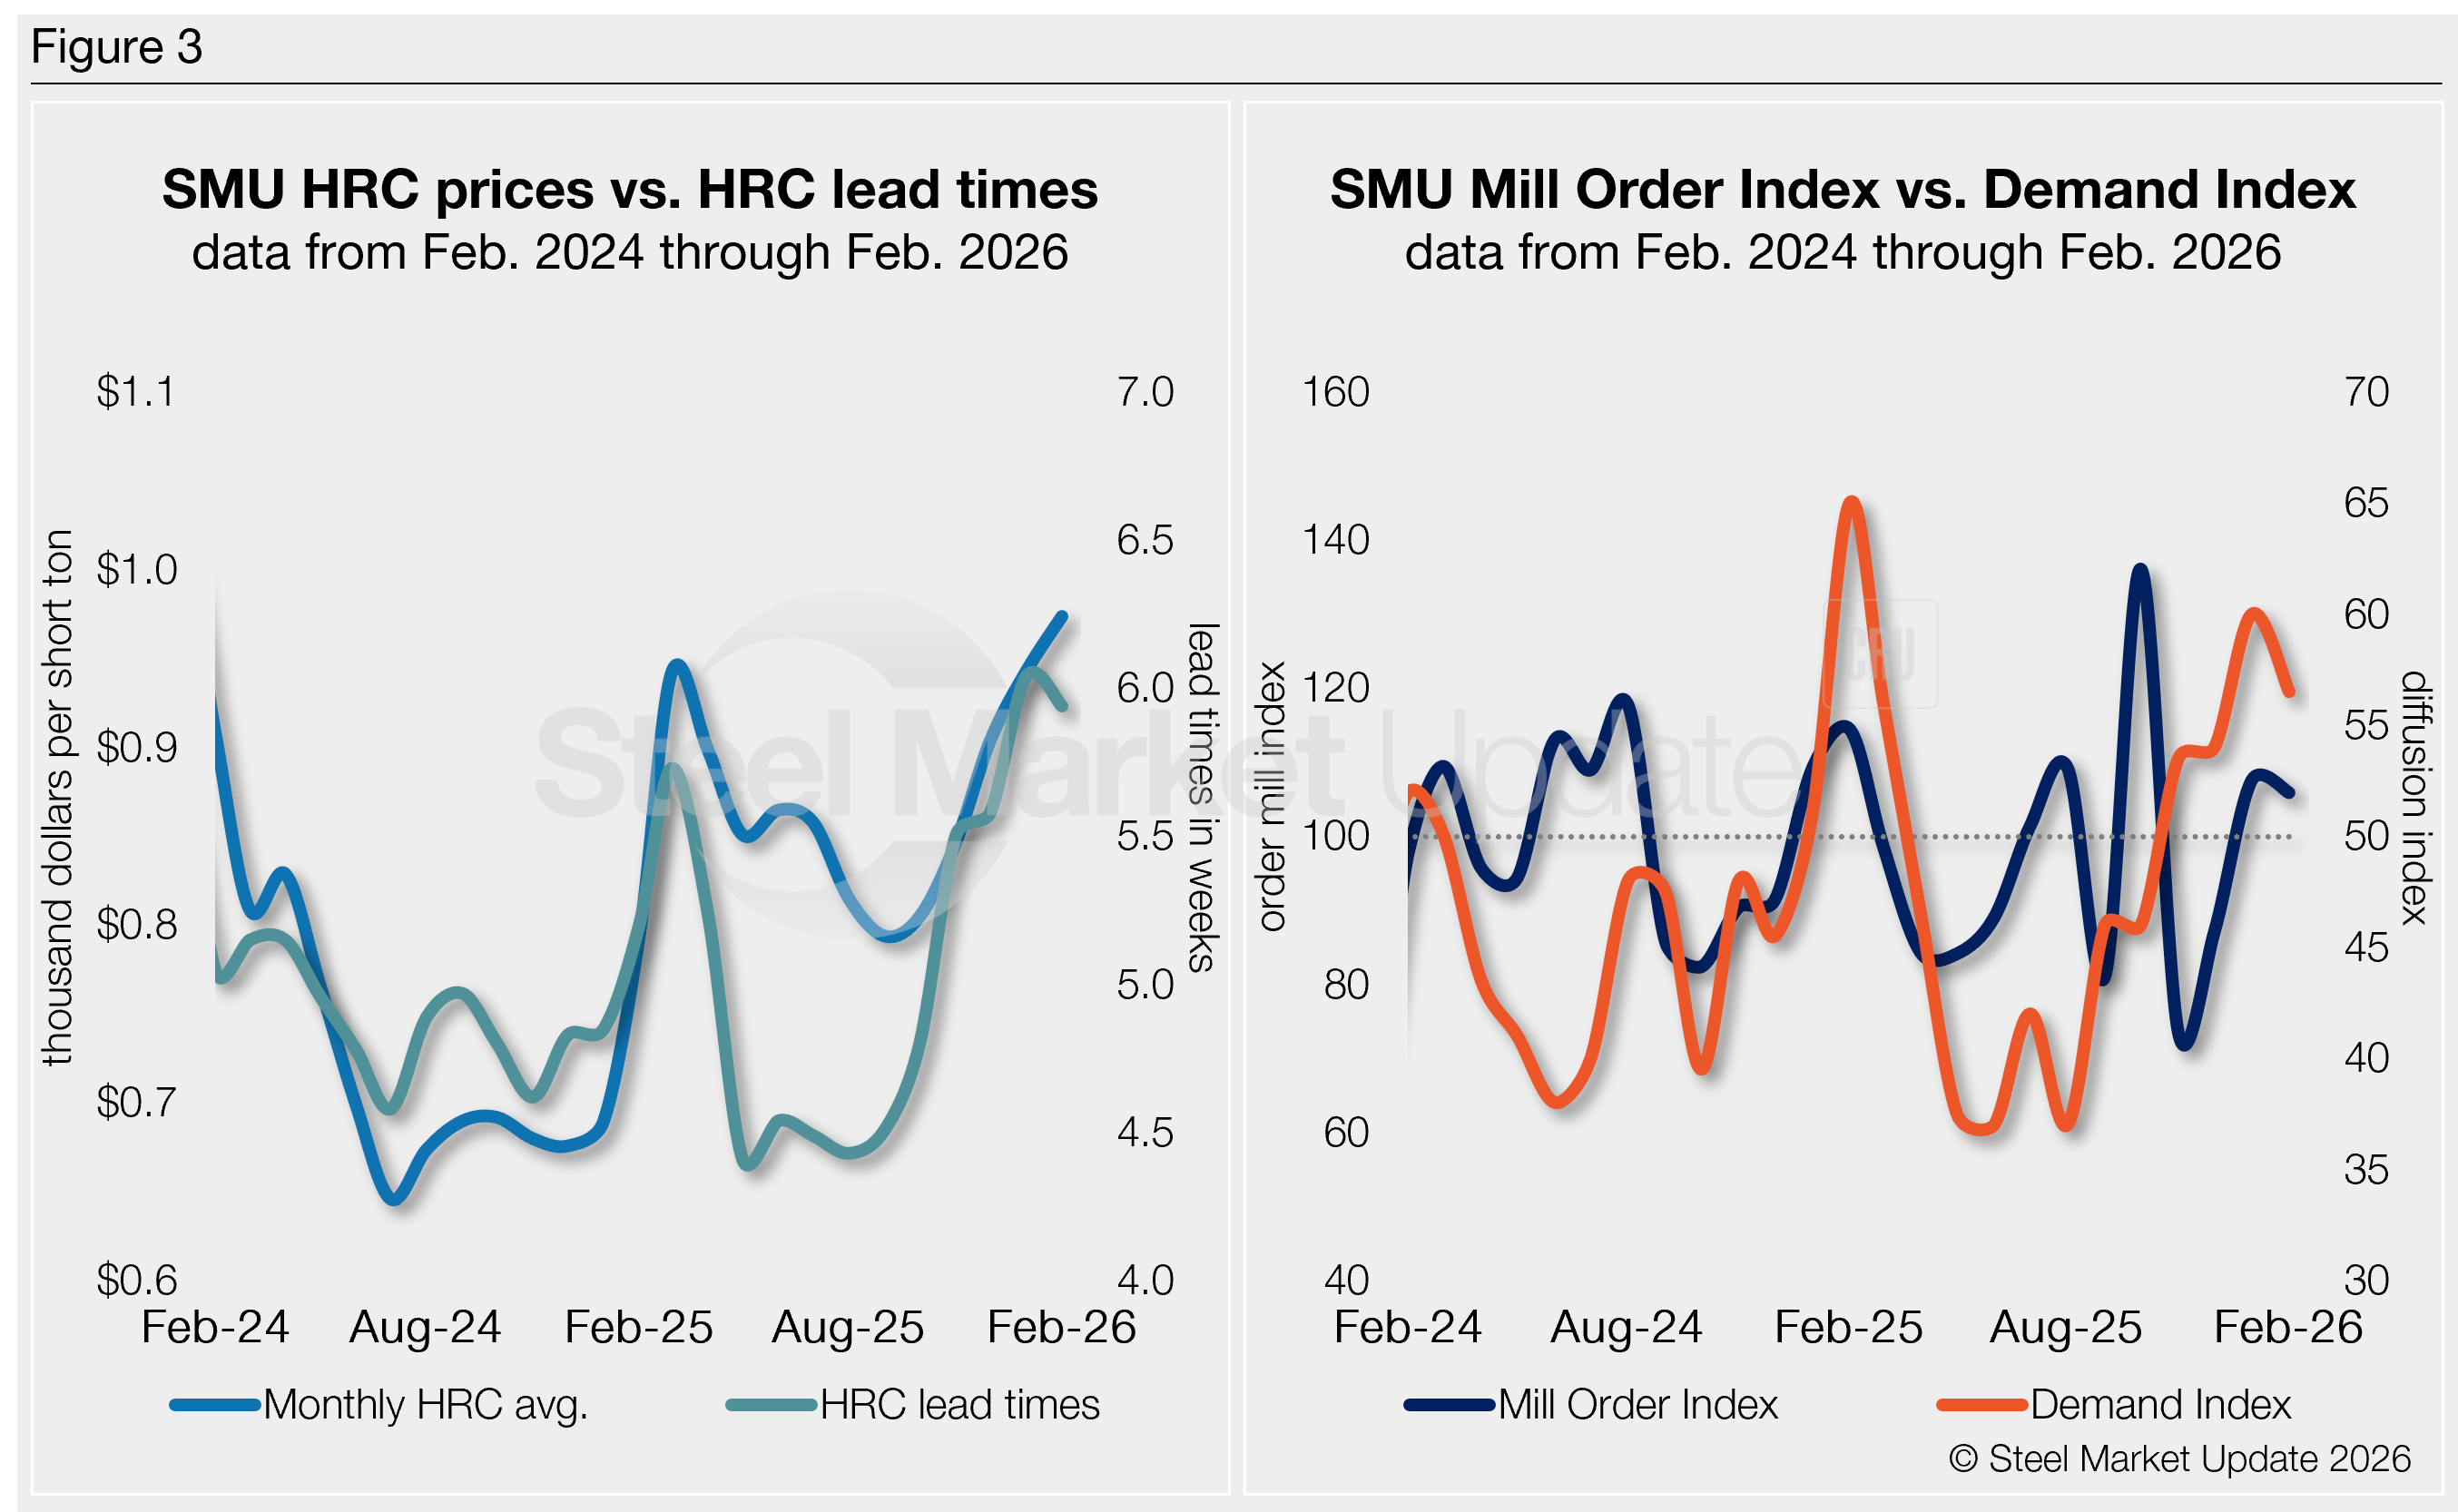
SMU’s MOI pairs well with—and for the past five years has preceded—moves in mill lead times (Figure 2), though the latest results would indicate a divergence. And SMU’s lead times have also been a leading indicator of flat-rolled steel prices, particularly for HRC (see left-side chart in Figure 3).
Our MOI also pairs well with our Steel Demand Index (see right-side chart in Figure 3), which, for nearly a decade, has preceded moves in mill lead times. But, again, the latest data denotes a disagreement.
How it shakes out
HRC prices have been on the rise, now up $220 per short ton (st) since late September. And lead times have been steadily stretching out, now at 6.4 weeks on average in our latest assessment, up from 5.9 in early March.
The trend appears to denote a downstream supply chain that is in balance, though very lean. Some might say inventories appeared well-matched to demand in February, while others are concerned the dynamic is partially to blame for the current price rise.
If lead times continue to push out, added spot buying could tip the scales, pushing prices up even further in the near term.
This is likely why the Mill Order Index is firm, and our Demand Index is still expanding.
We’ll be tracking any changes closely as we move through March and into Q2.


