

Long Products
April 17, 2026
Apparent steel supply slipped in February
Written by Brett Linton
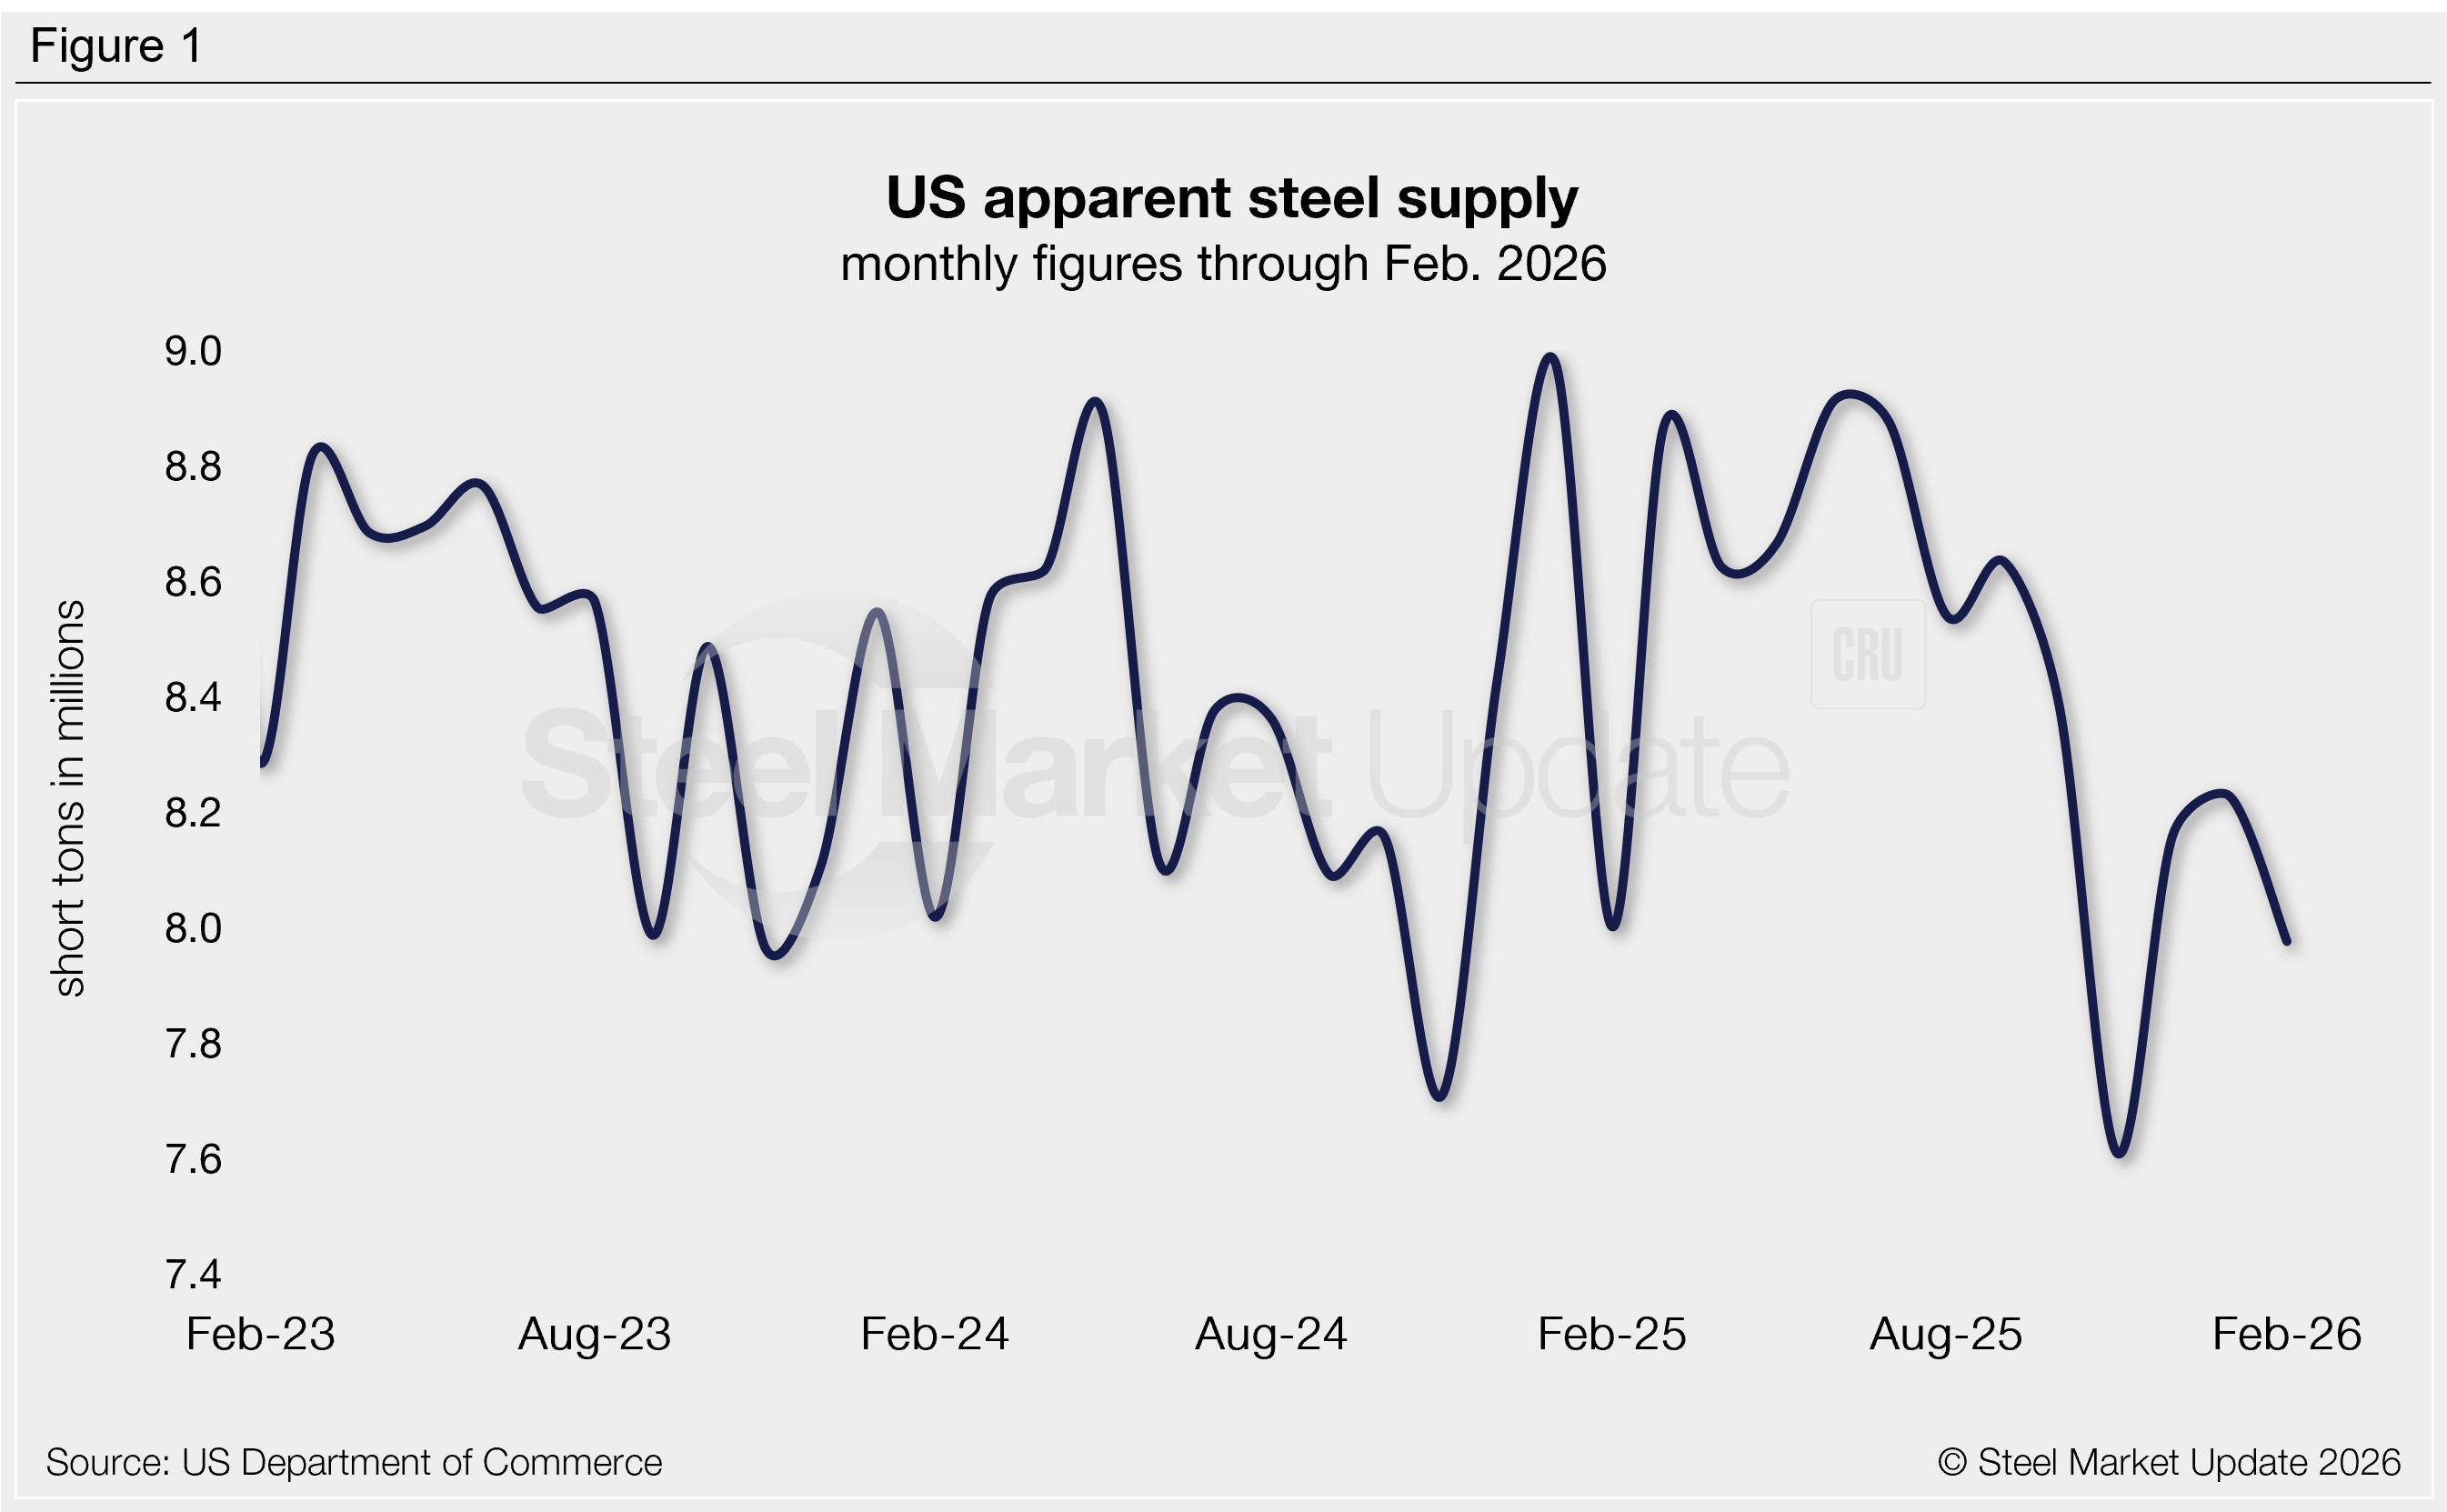
The volume of finished steel that entered the US market declined 3% from January to February, according to SMU’s analysis of recently released Department of Commerce and American Iron and Steel Institute (AISI) data. February represents the third-lowest monthly supply rate recorded in the past two years and is just 5% above the near-five-year low set last November.
Dubbed apparent steel supply, this measure is calculated by combining domestic mill shipments and finished US steel imports, then subtracting total US exports.
February supply fell 252,000 short tons (st) from January to 7.98 million st. This decline was primarily due to a reduction in domestic shipments, followed by a decline in finished imports.
Prior to last November, supply had fluctuated within a relatively stable range for over three years, averaging 8.45 million st per month during that time (Figure 1). For comparison, the highest measure recorded in our 15-year data history was 10.90 million st in 2014 and the lowest was 6.52 million st in 2020.
Trends
To better highlight trends, supply can be calculated on a three-month moving average (3MMA) basis to smooth out monthly fluctuations. Following January’s 14-month low of 8.00 million st, the 3MMA increased in February to 8.12 million st (Figure 2). This is marginally above the four-year low of 7.99 million st seen in November 2024.
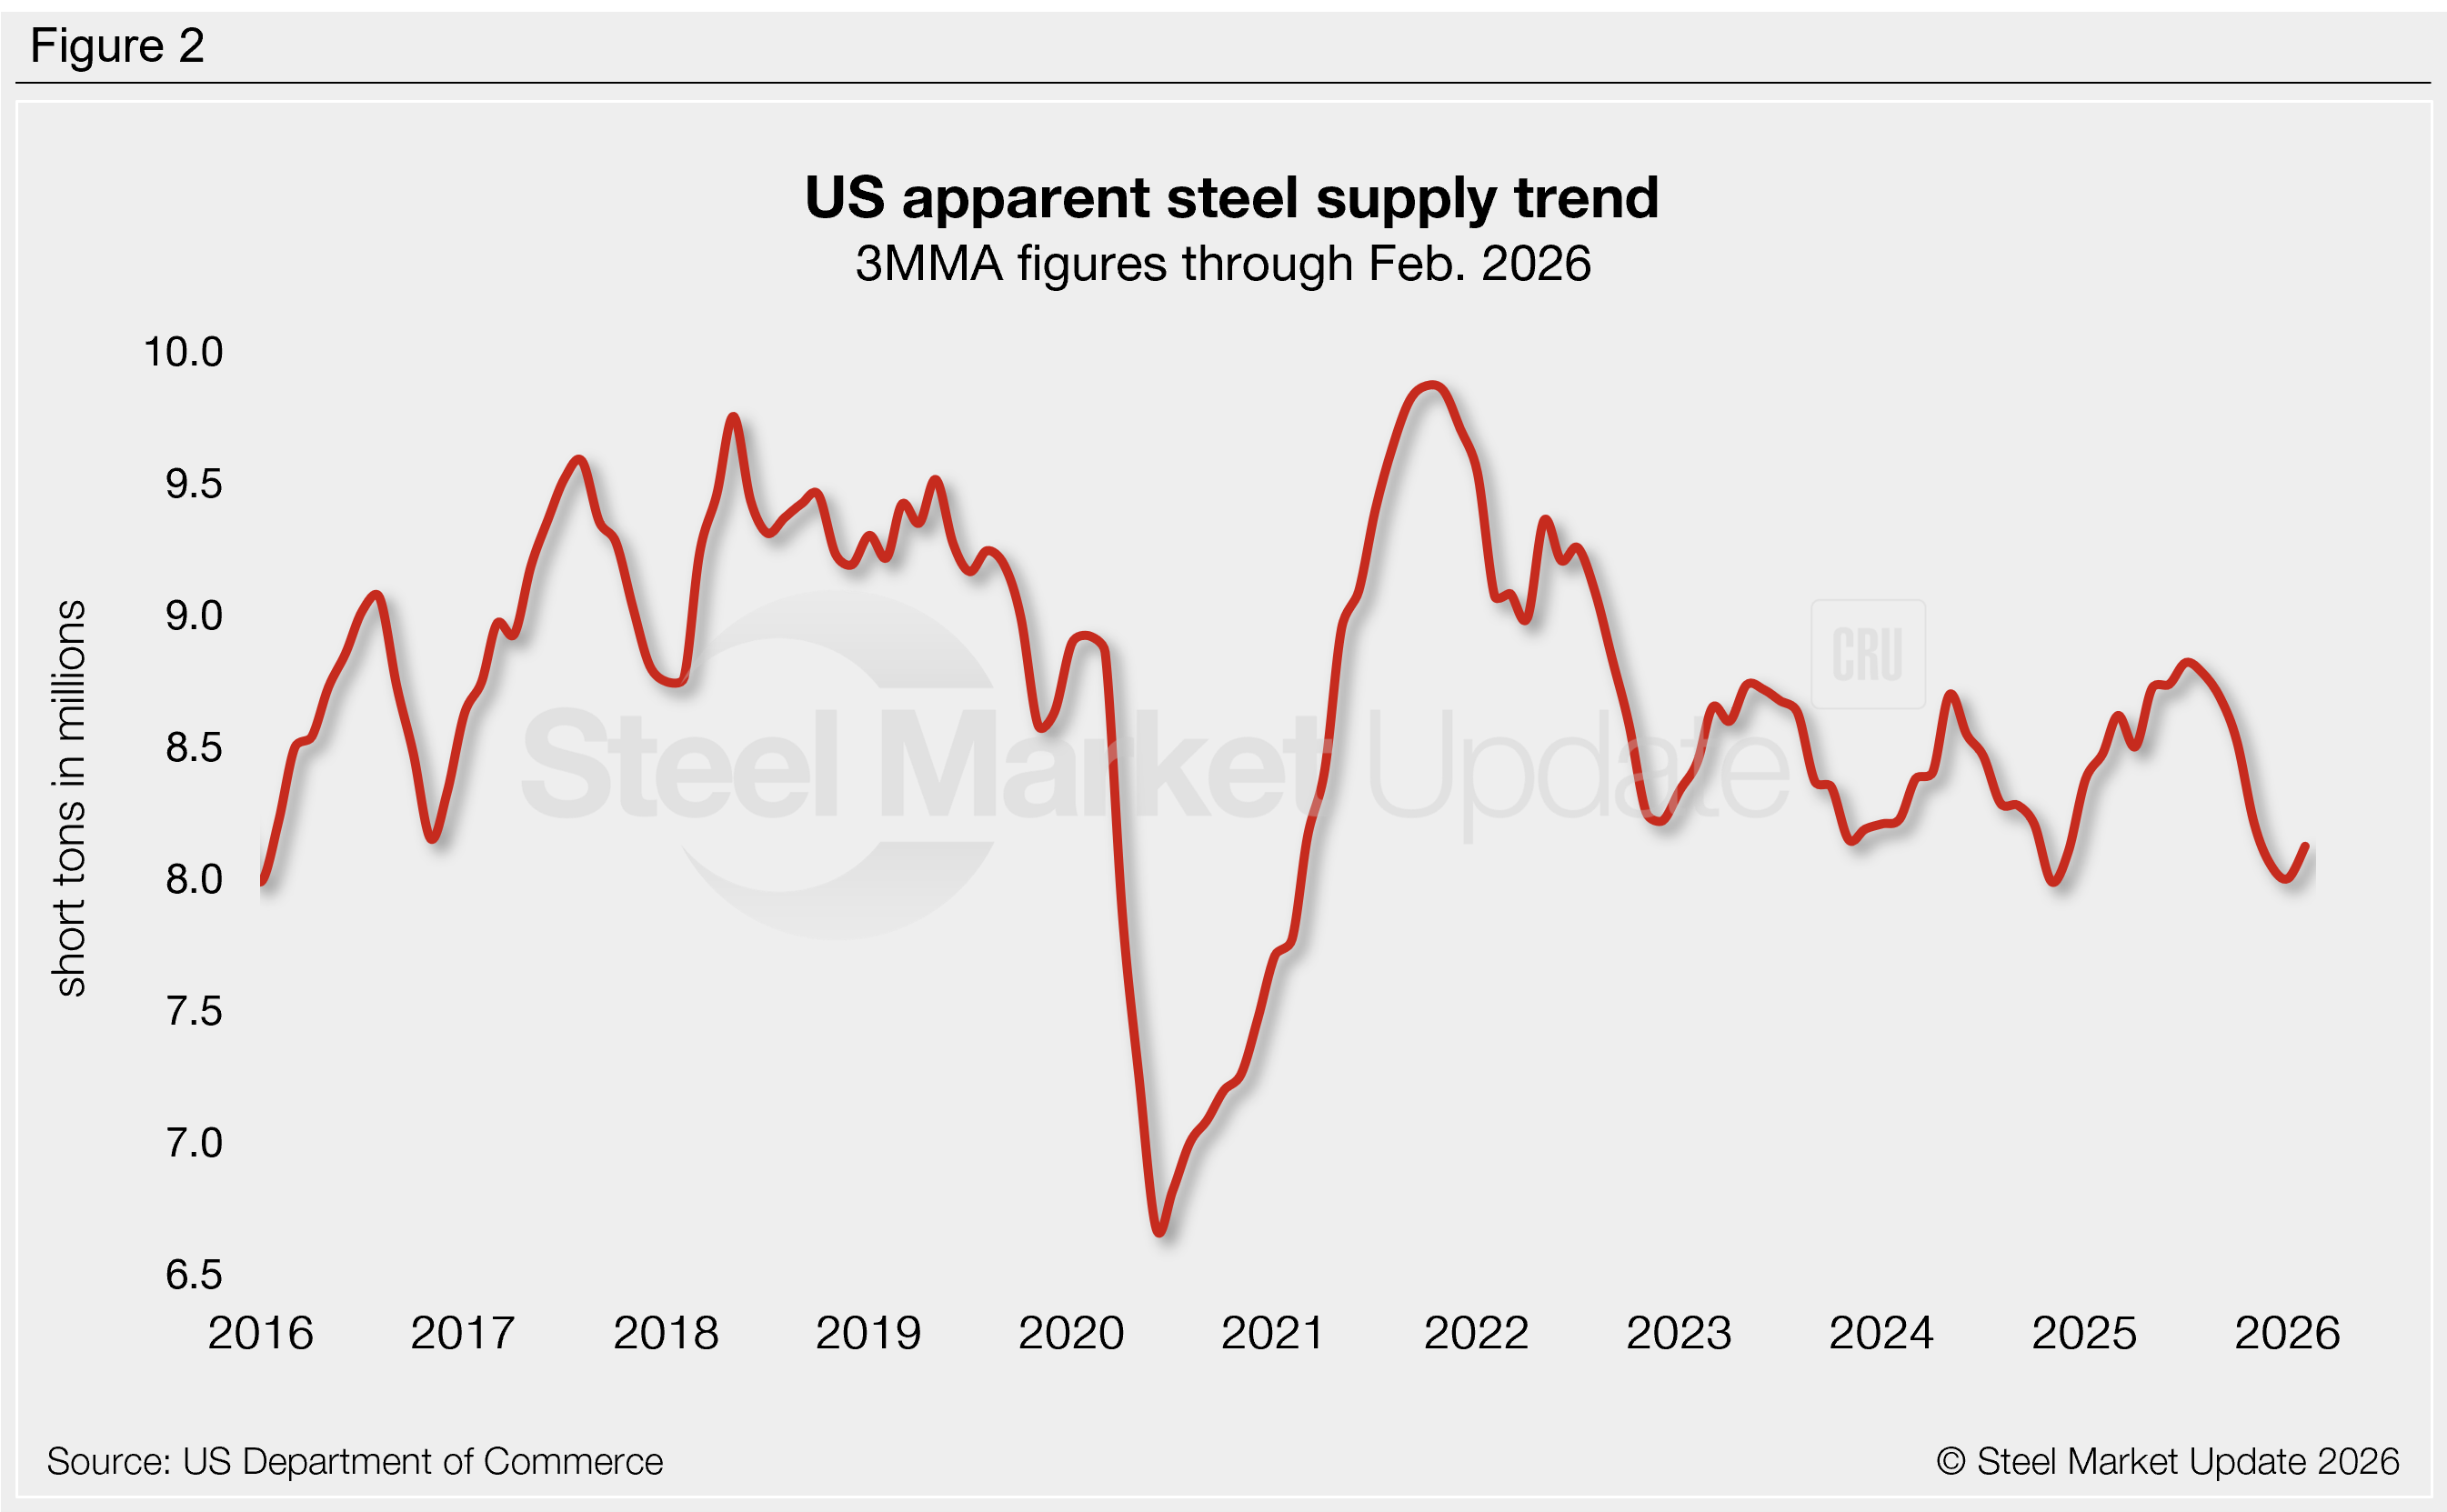
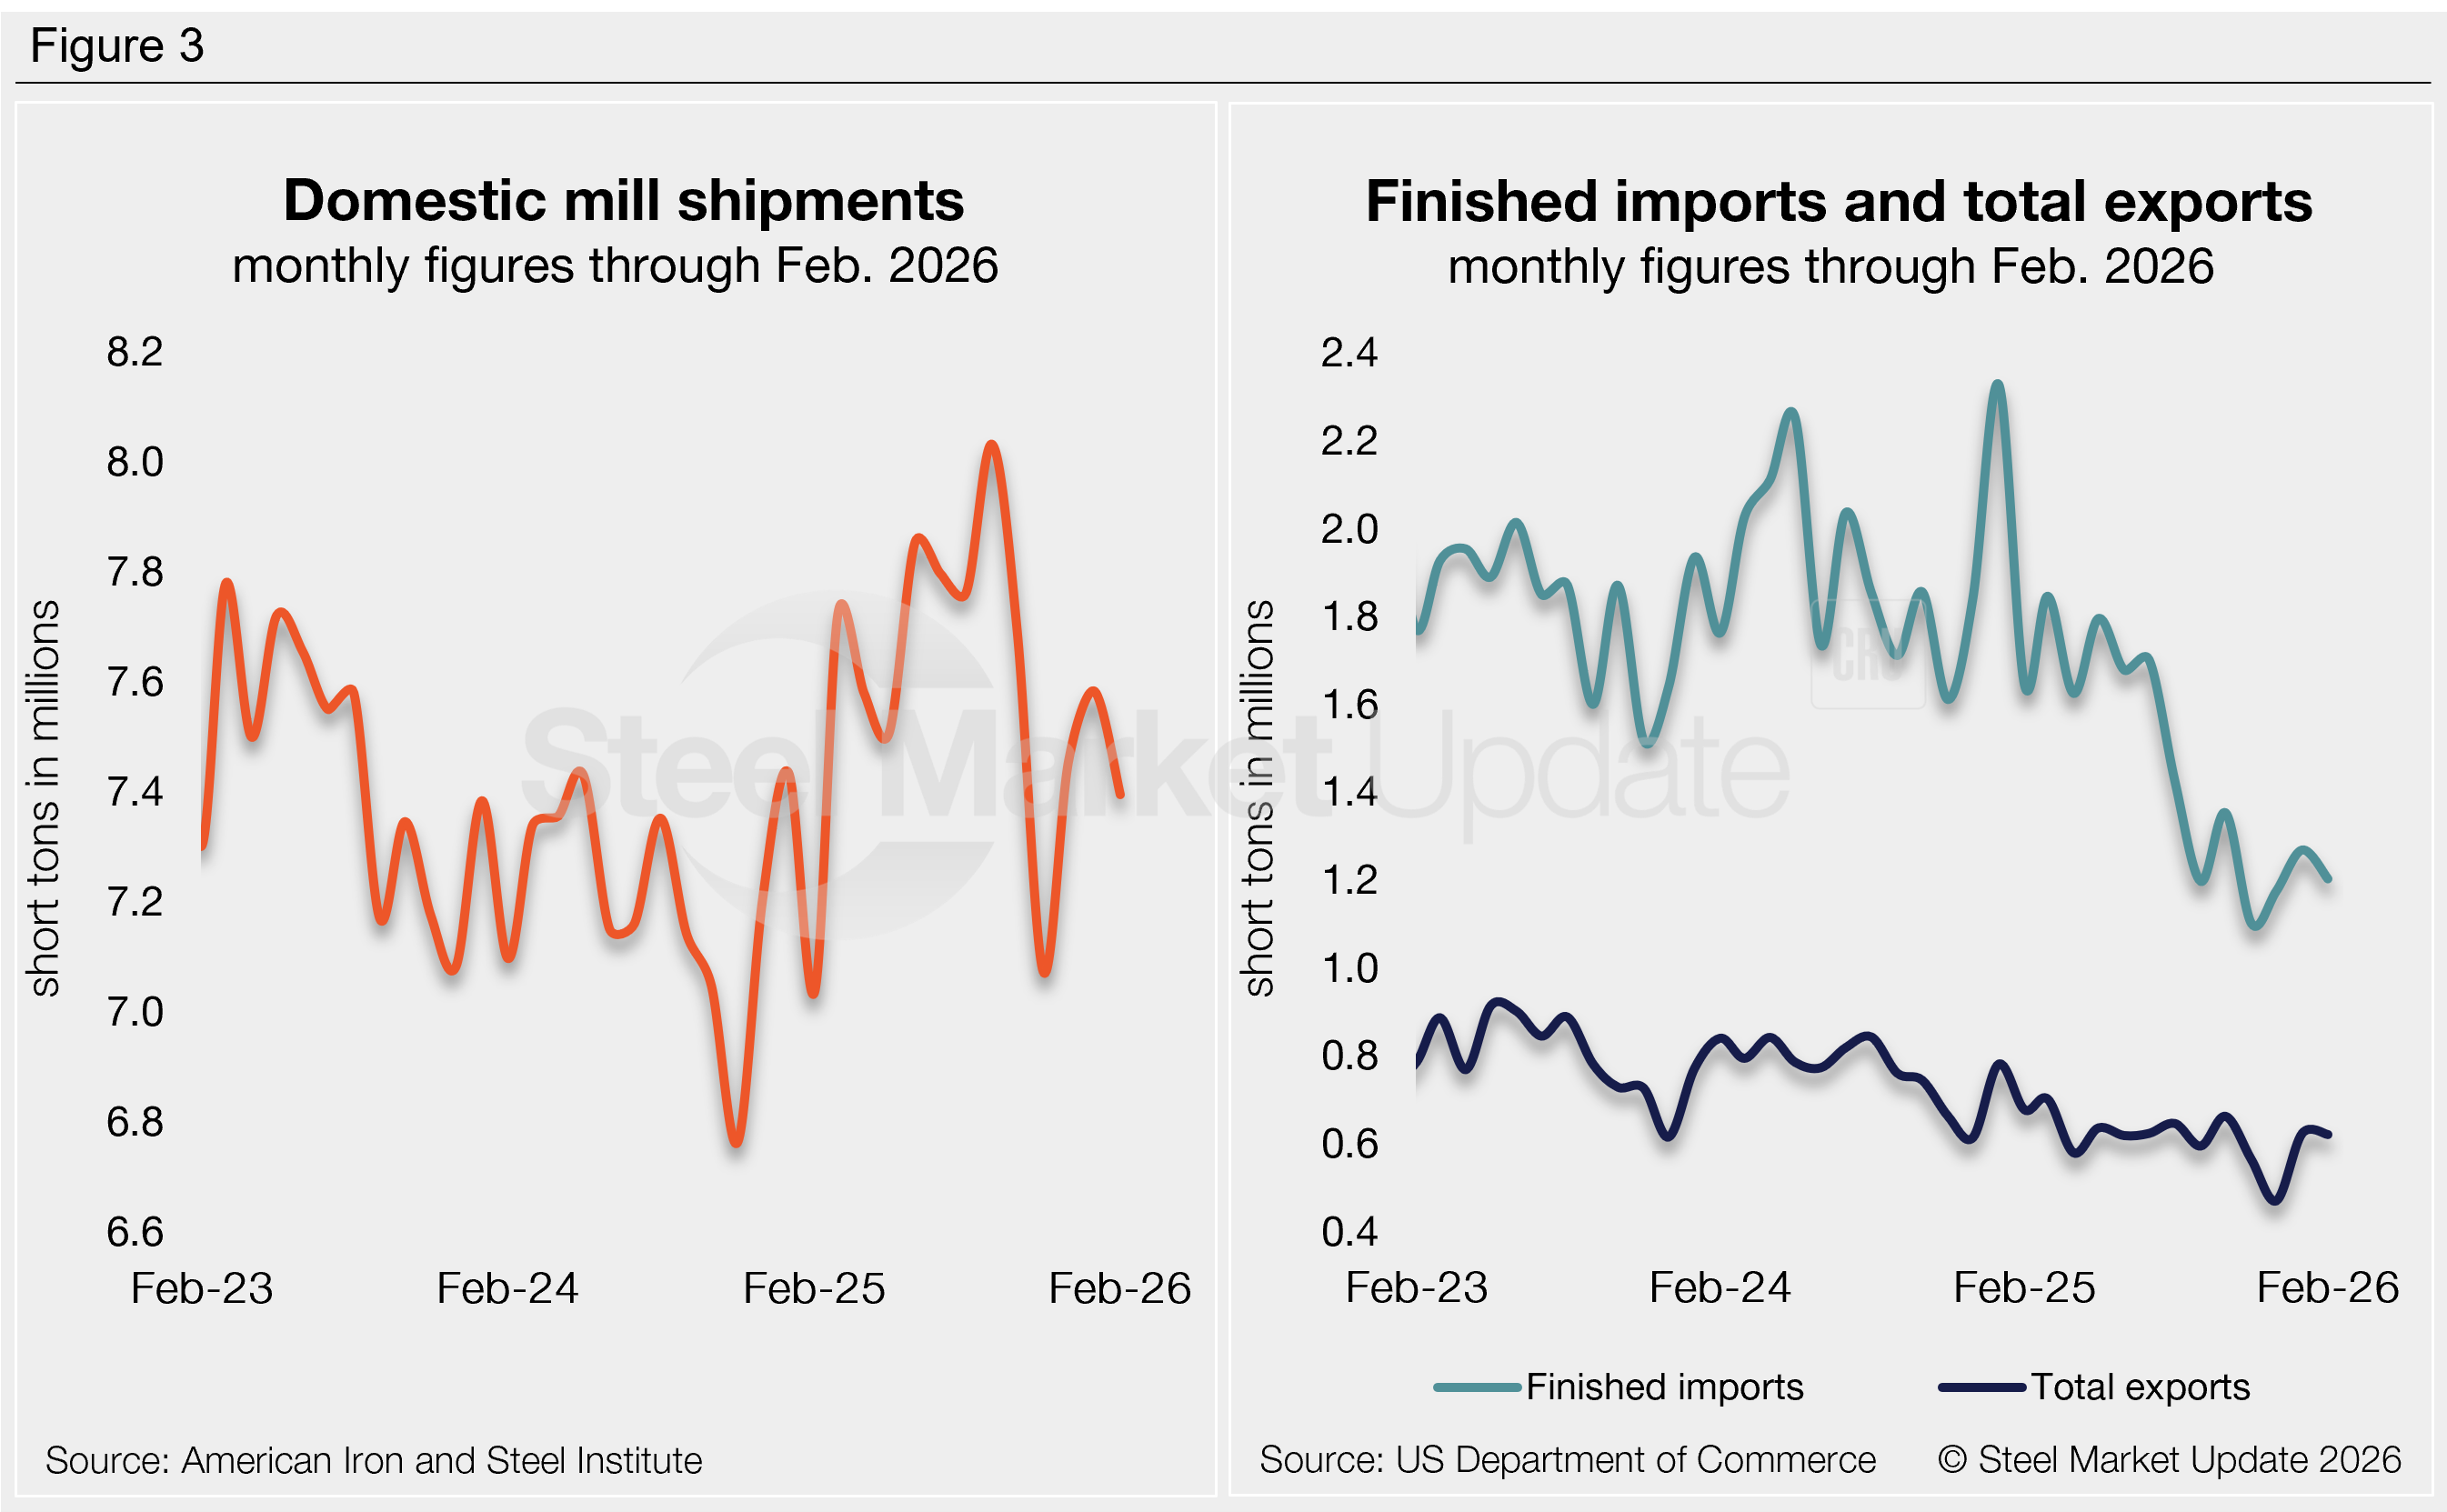
Figure 3 shows the individual components of apparent supply and their changes from January to February:
– Domestic shipments slipped 188,000 st month over month (m/m) (2%) to 7.40 million st, accounting for 93% of total supply.
– Finished steel imports fell 65,000 st (5%) to 1.20 million st. The latest license data shows a potential 10% recovery in March.
– Steel exports eased 2,000 st (less than 1%) to 620,000 st, remaining near historical lows.
– Net imports (finished imports minus exports) made up 7% of supply in February. This is one of the lower rates seen in recent years (it averaged 12% across the prior two years).
To see an interactive graphic of our apparent steel supply history, click here. If you need any assistance logging into or navigating the website, contact us at smu@crugroup.com.

