Analysis
May 8, 2026
Steel imports recover modestly in March and April
Written by Brett Linton
After reaching historic lows in recent months, steel import volumes increased marginally in March and April, according to recently released US Commerce Department data. Final March imports rose 5% month-over-month (m/m), and April license data show another 10% recovery.
Recall that imports briefly surged to a two-and-a-half-year high at the start of 2025, then began to ease in the middle of the year. From September 2025 through February 2026, monthly import volumes were at some of the lowest levels seen since 2020.
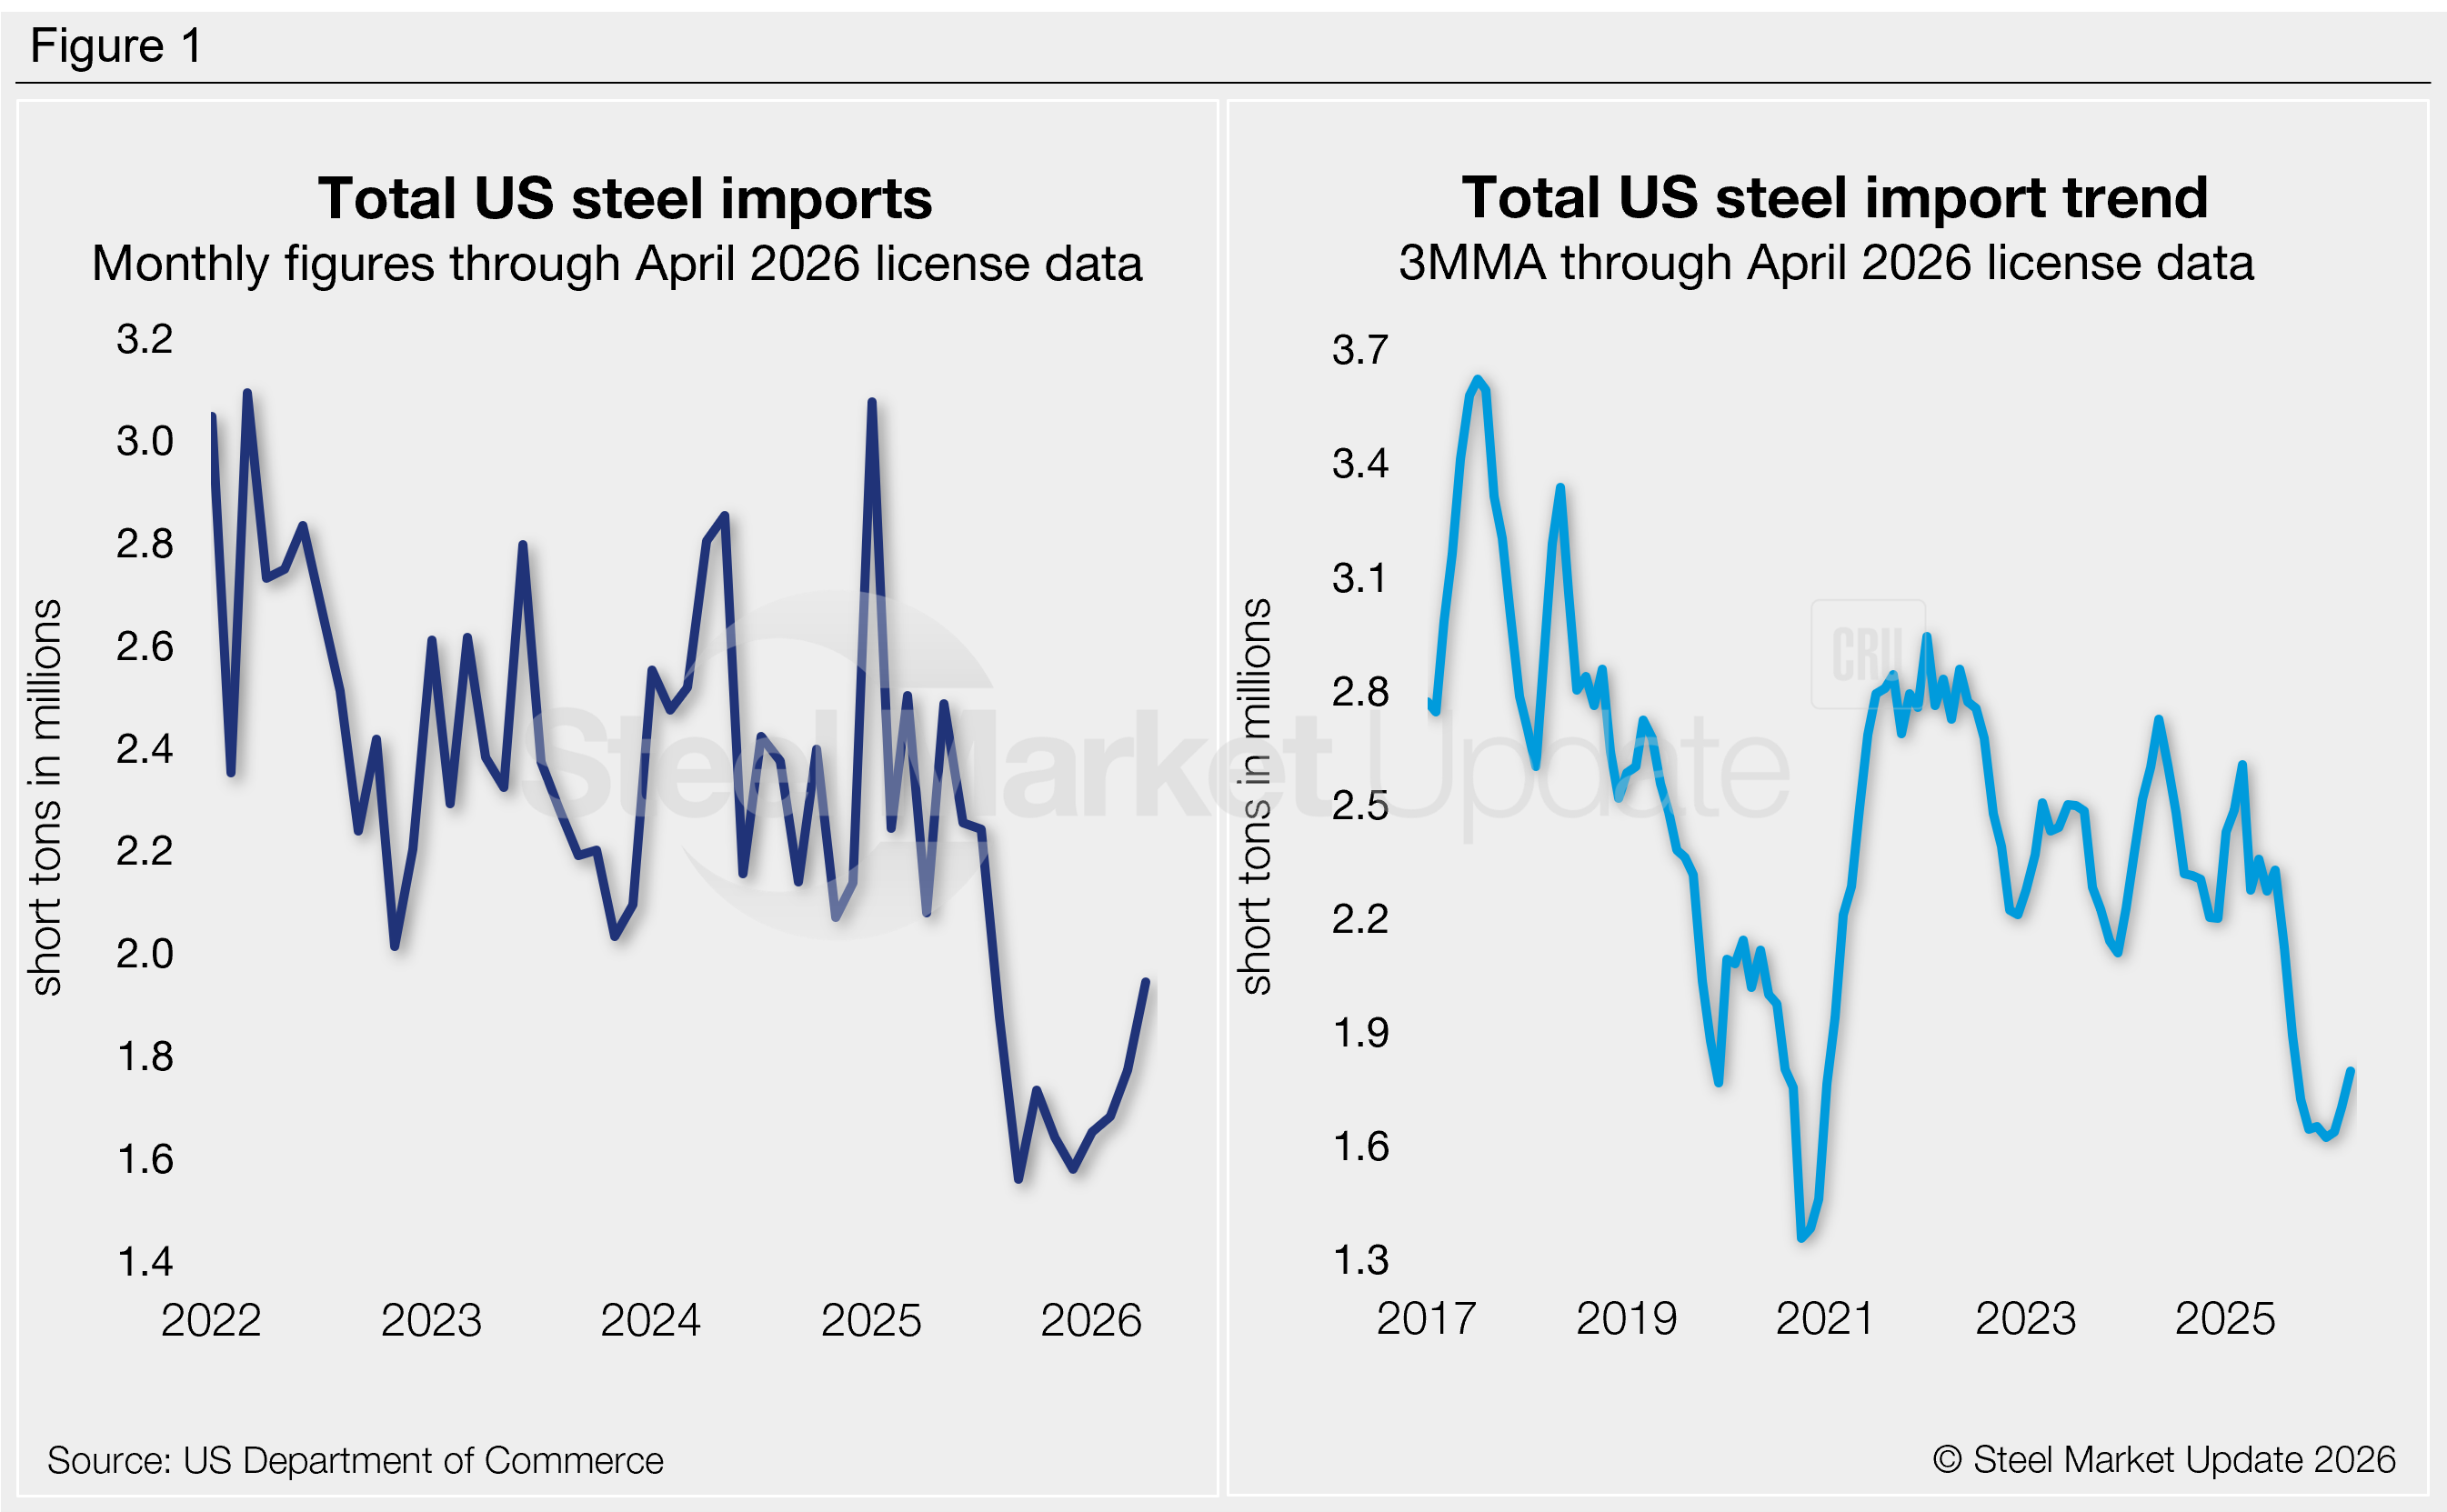
Final March data show that 1.77 million short tons (st) of steel were imported into the country throughout the month, a six-month high. This is a 211,000 st, or 14%, recovery from the near five-year low set last September. April license data collected through May 3 currently total 1.95 million st, potentially an eight-month high (Figure 1, left).
Imports by country
In March, two-thirds of the steel that entered the country came from just five countries: South Korea (16%), Brazil (16%), Canada (16%), Vietnam (10%), and Mexico (8%). Other major suppliers included Taiwan, Japan, India, Turkey, the United Arab Emirates, Germany, China, and the United Kingdom, each contributing 1-5% of the total. Combined, these 13 countries accounted for 90% of all March imports.
Visit the International Trade Administration’s Steel Import Monitor to explore steel import data by country, category, or specific product.
Import trends
To better highlight trends, import data can be analyzed as a three-month moving average (3MMA) to smooth out monthly variations (Figure 1, right). From this perspective, 3MMA imports generally trended lower across 2025, bottoming out in January 2026 and marginally increasing since.
The 3MMA inched up to 1.70 million st in March (a five-month high) and to 1.80 million st in April (a potential seven-month high). These 3MMA measures remain well below most others seen in the last five years.
Imports by product
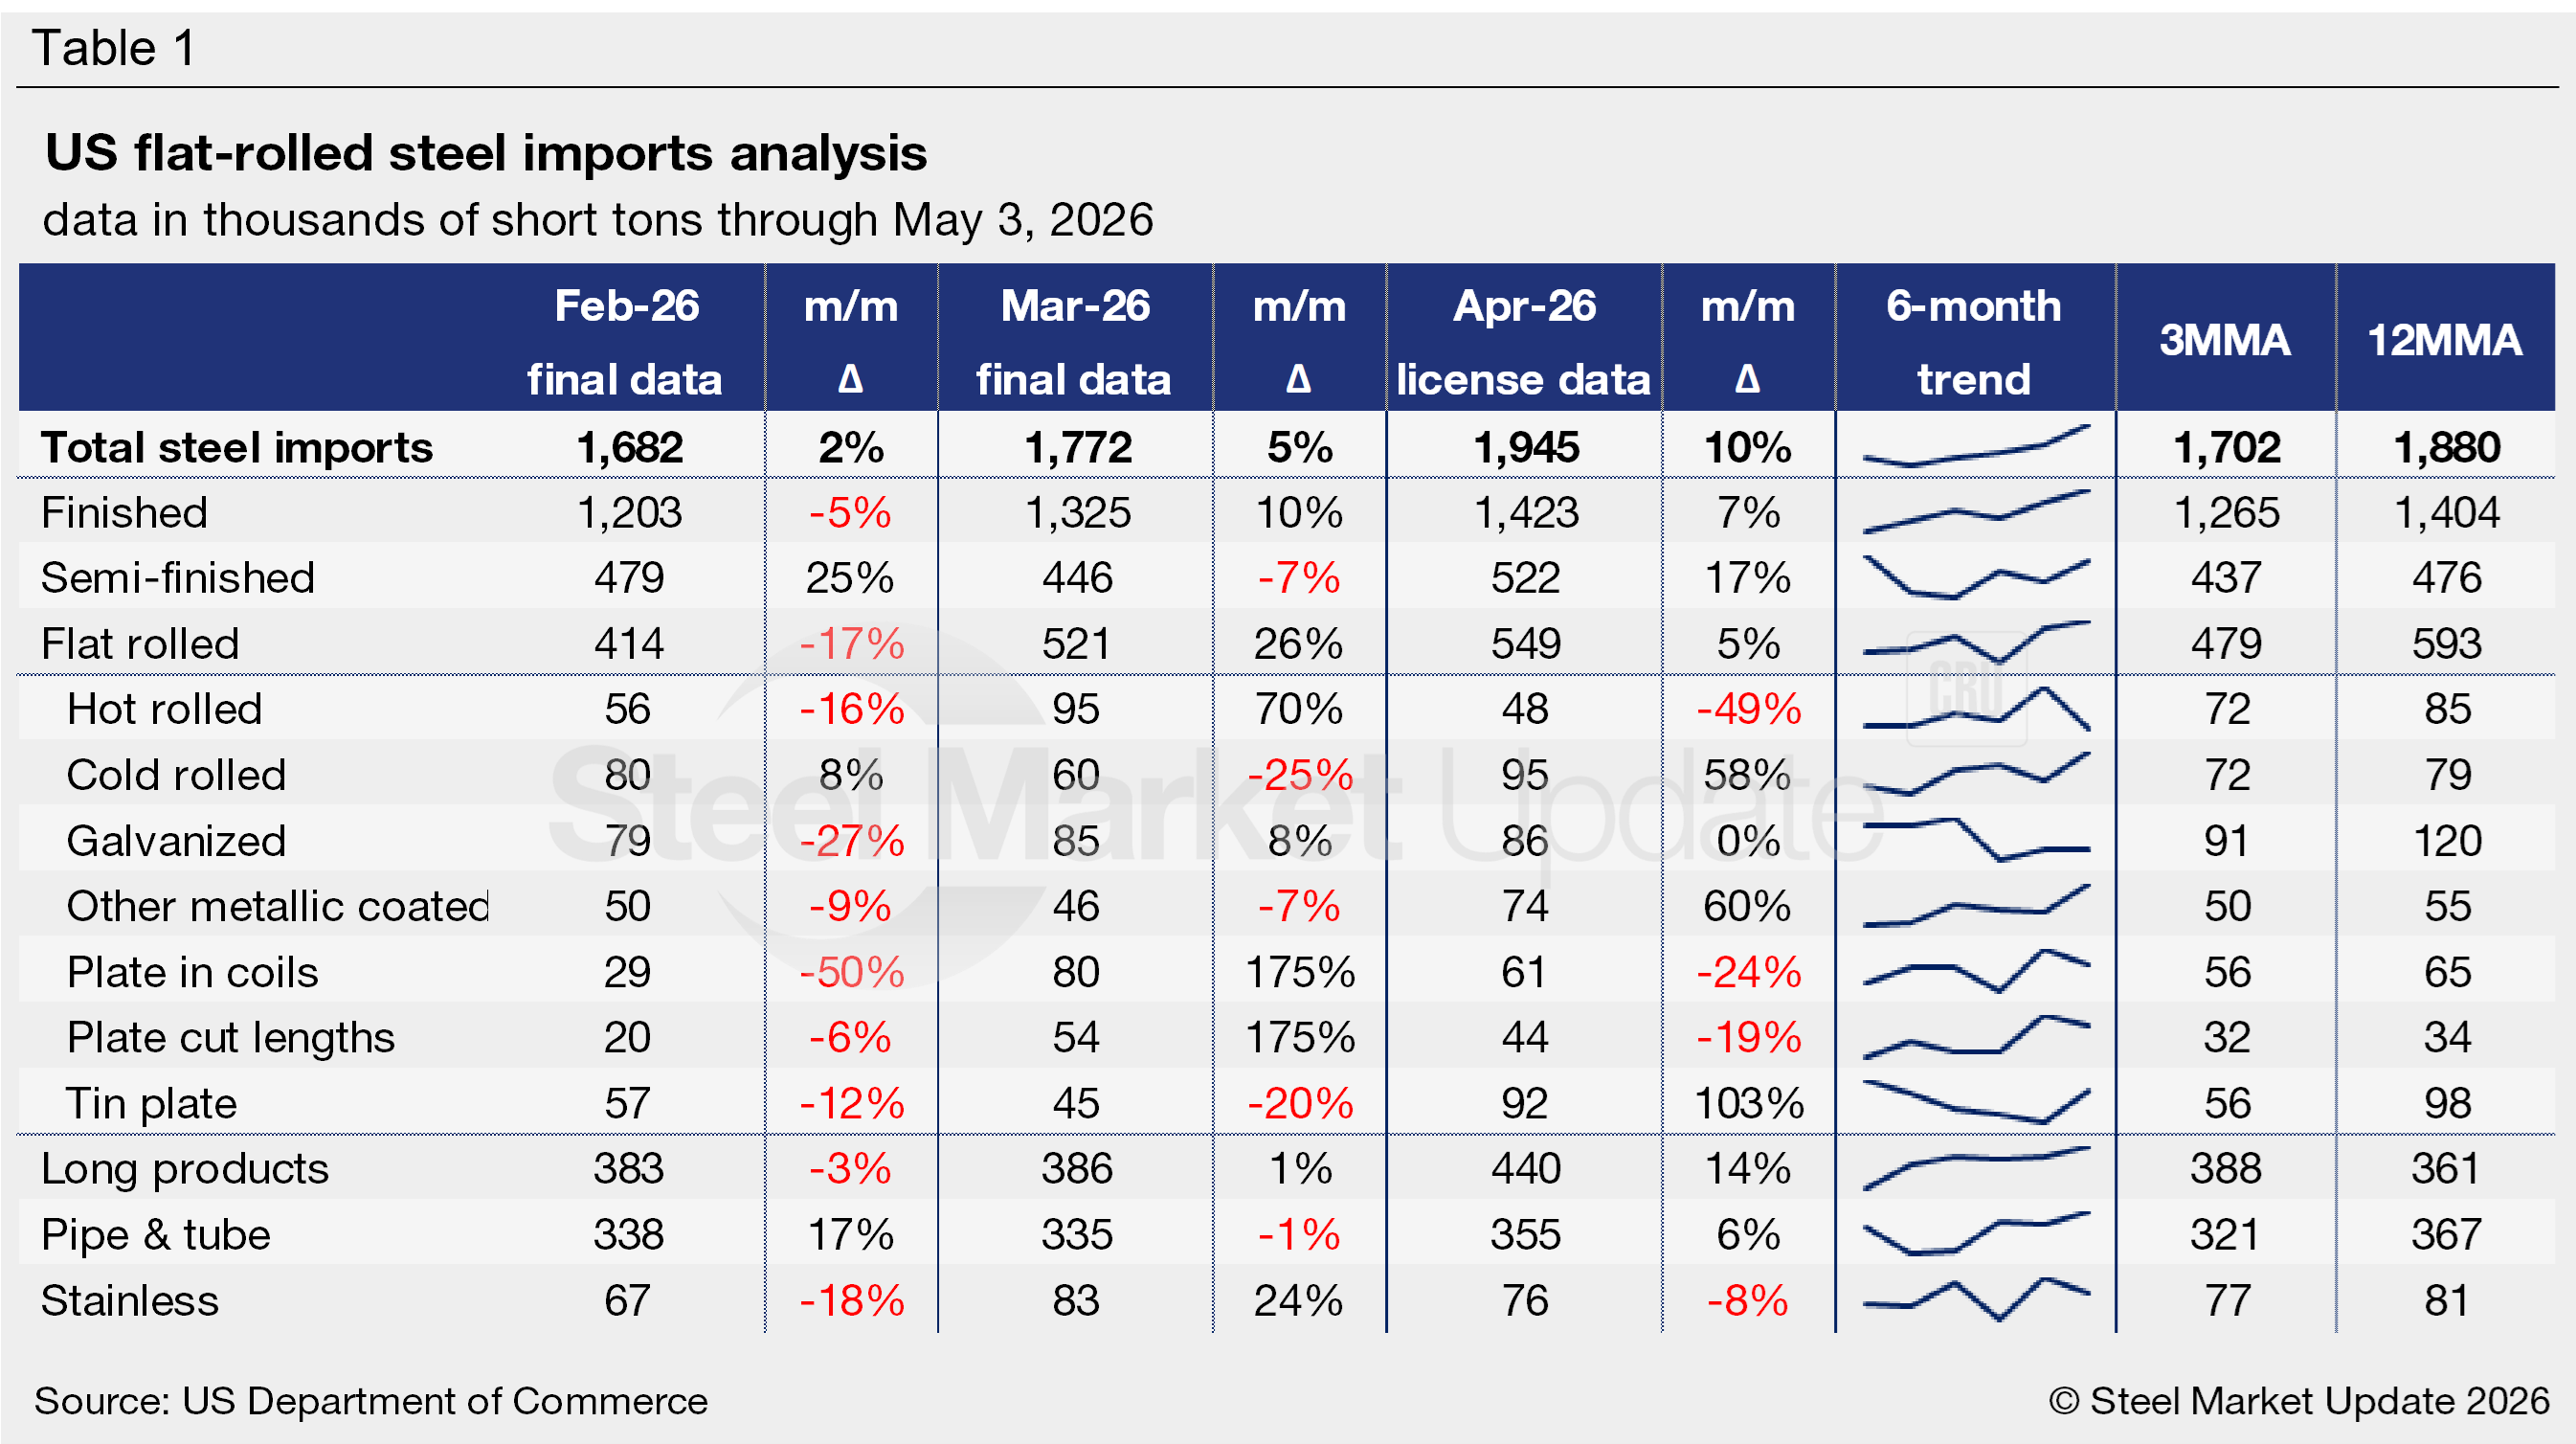
Table 1 highlights high-volume steel product imports (click to expand). Note that the 3MMA and 12MMA columns are calculated through final March data and do not include April licenses. For deeper analysis, visit our Steel Imports page.
Finished vs. semi-finished imports
Imports of finished steel vs. semi-finished products (mostly slabs to be further processed by a mill) have trended differently in recent months (Figure 2).
Semi-finished trade slipped 7% from February to March to 446,000 st. April licenses are currently back up 17% to 522,000 st. Year-to-date (YTD) volumes are down 26% compared to the first four months of 2025.
Finished imports recovered 10% m/m in March to 1.33 million st. April licenses are up another 7% to 1.42 million st, a potential eight-month high. Volumes are down 30% YTD compared to the same period in 2025.
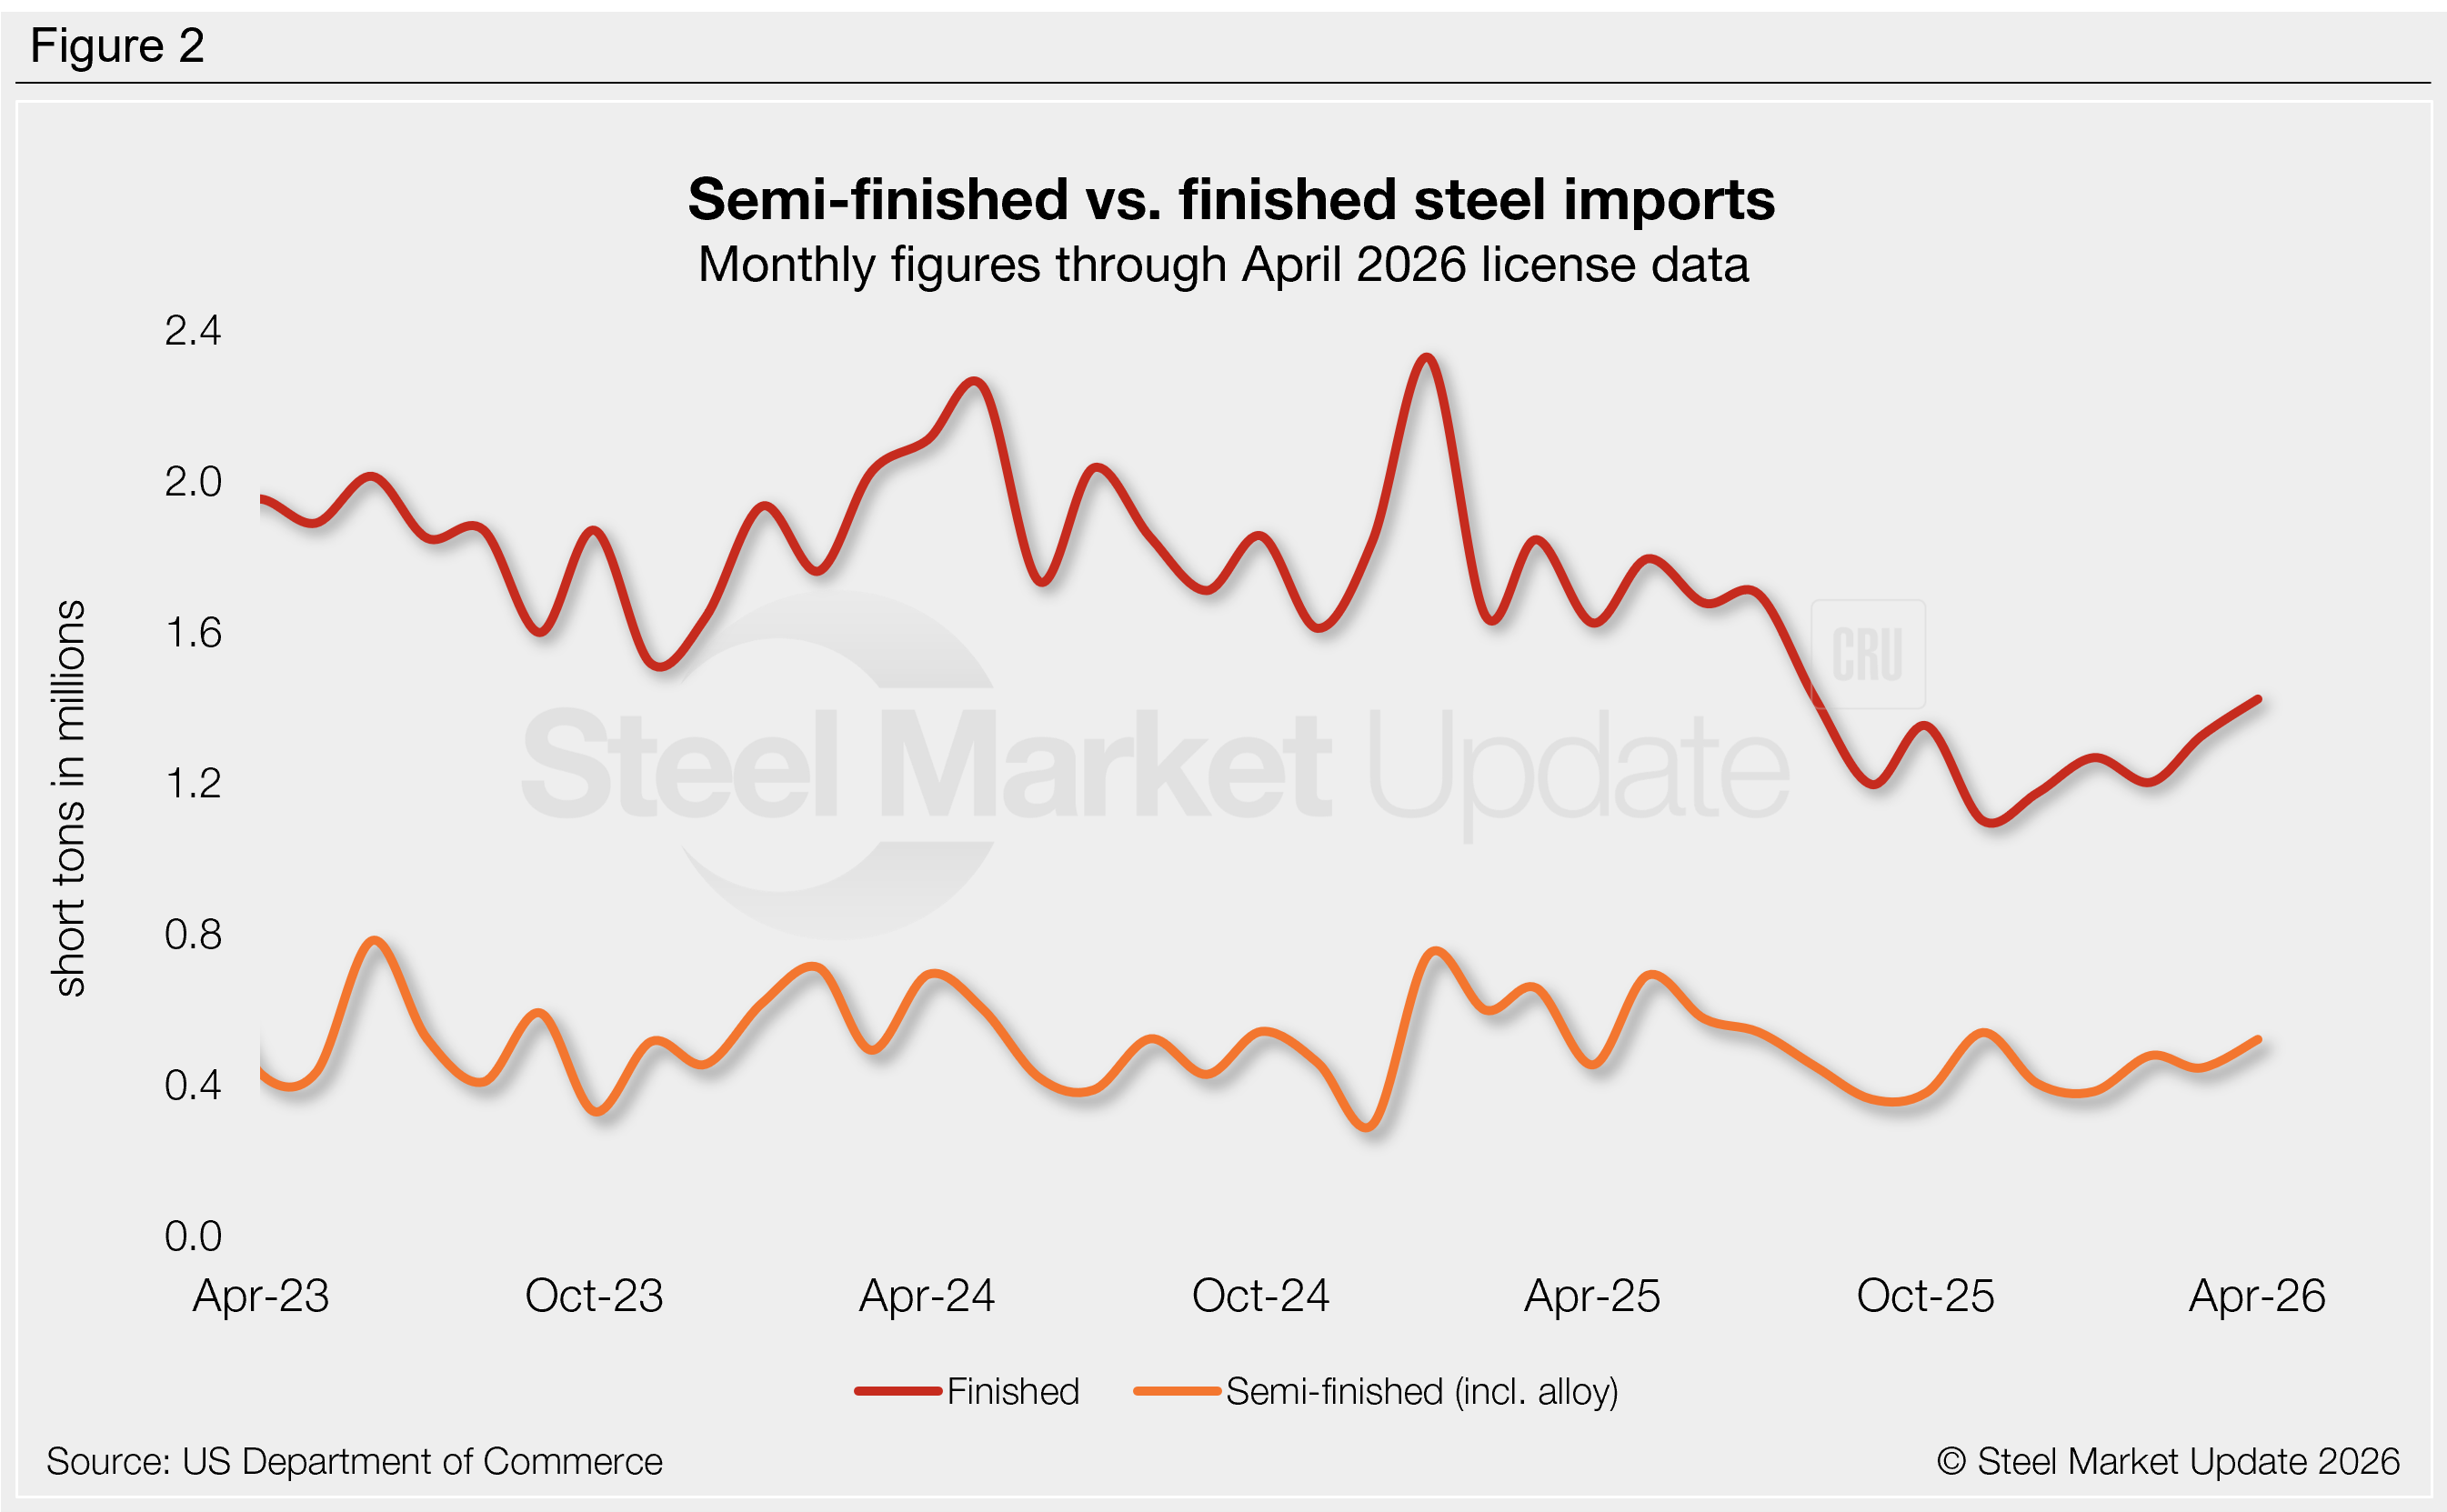
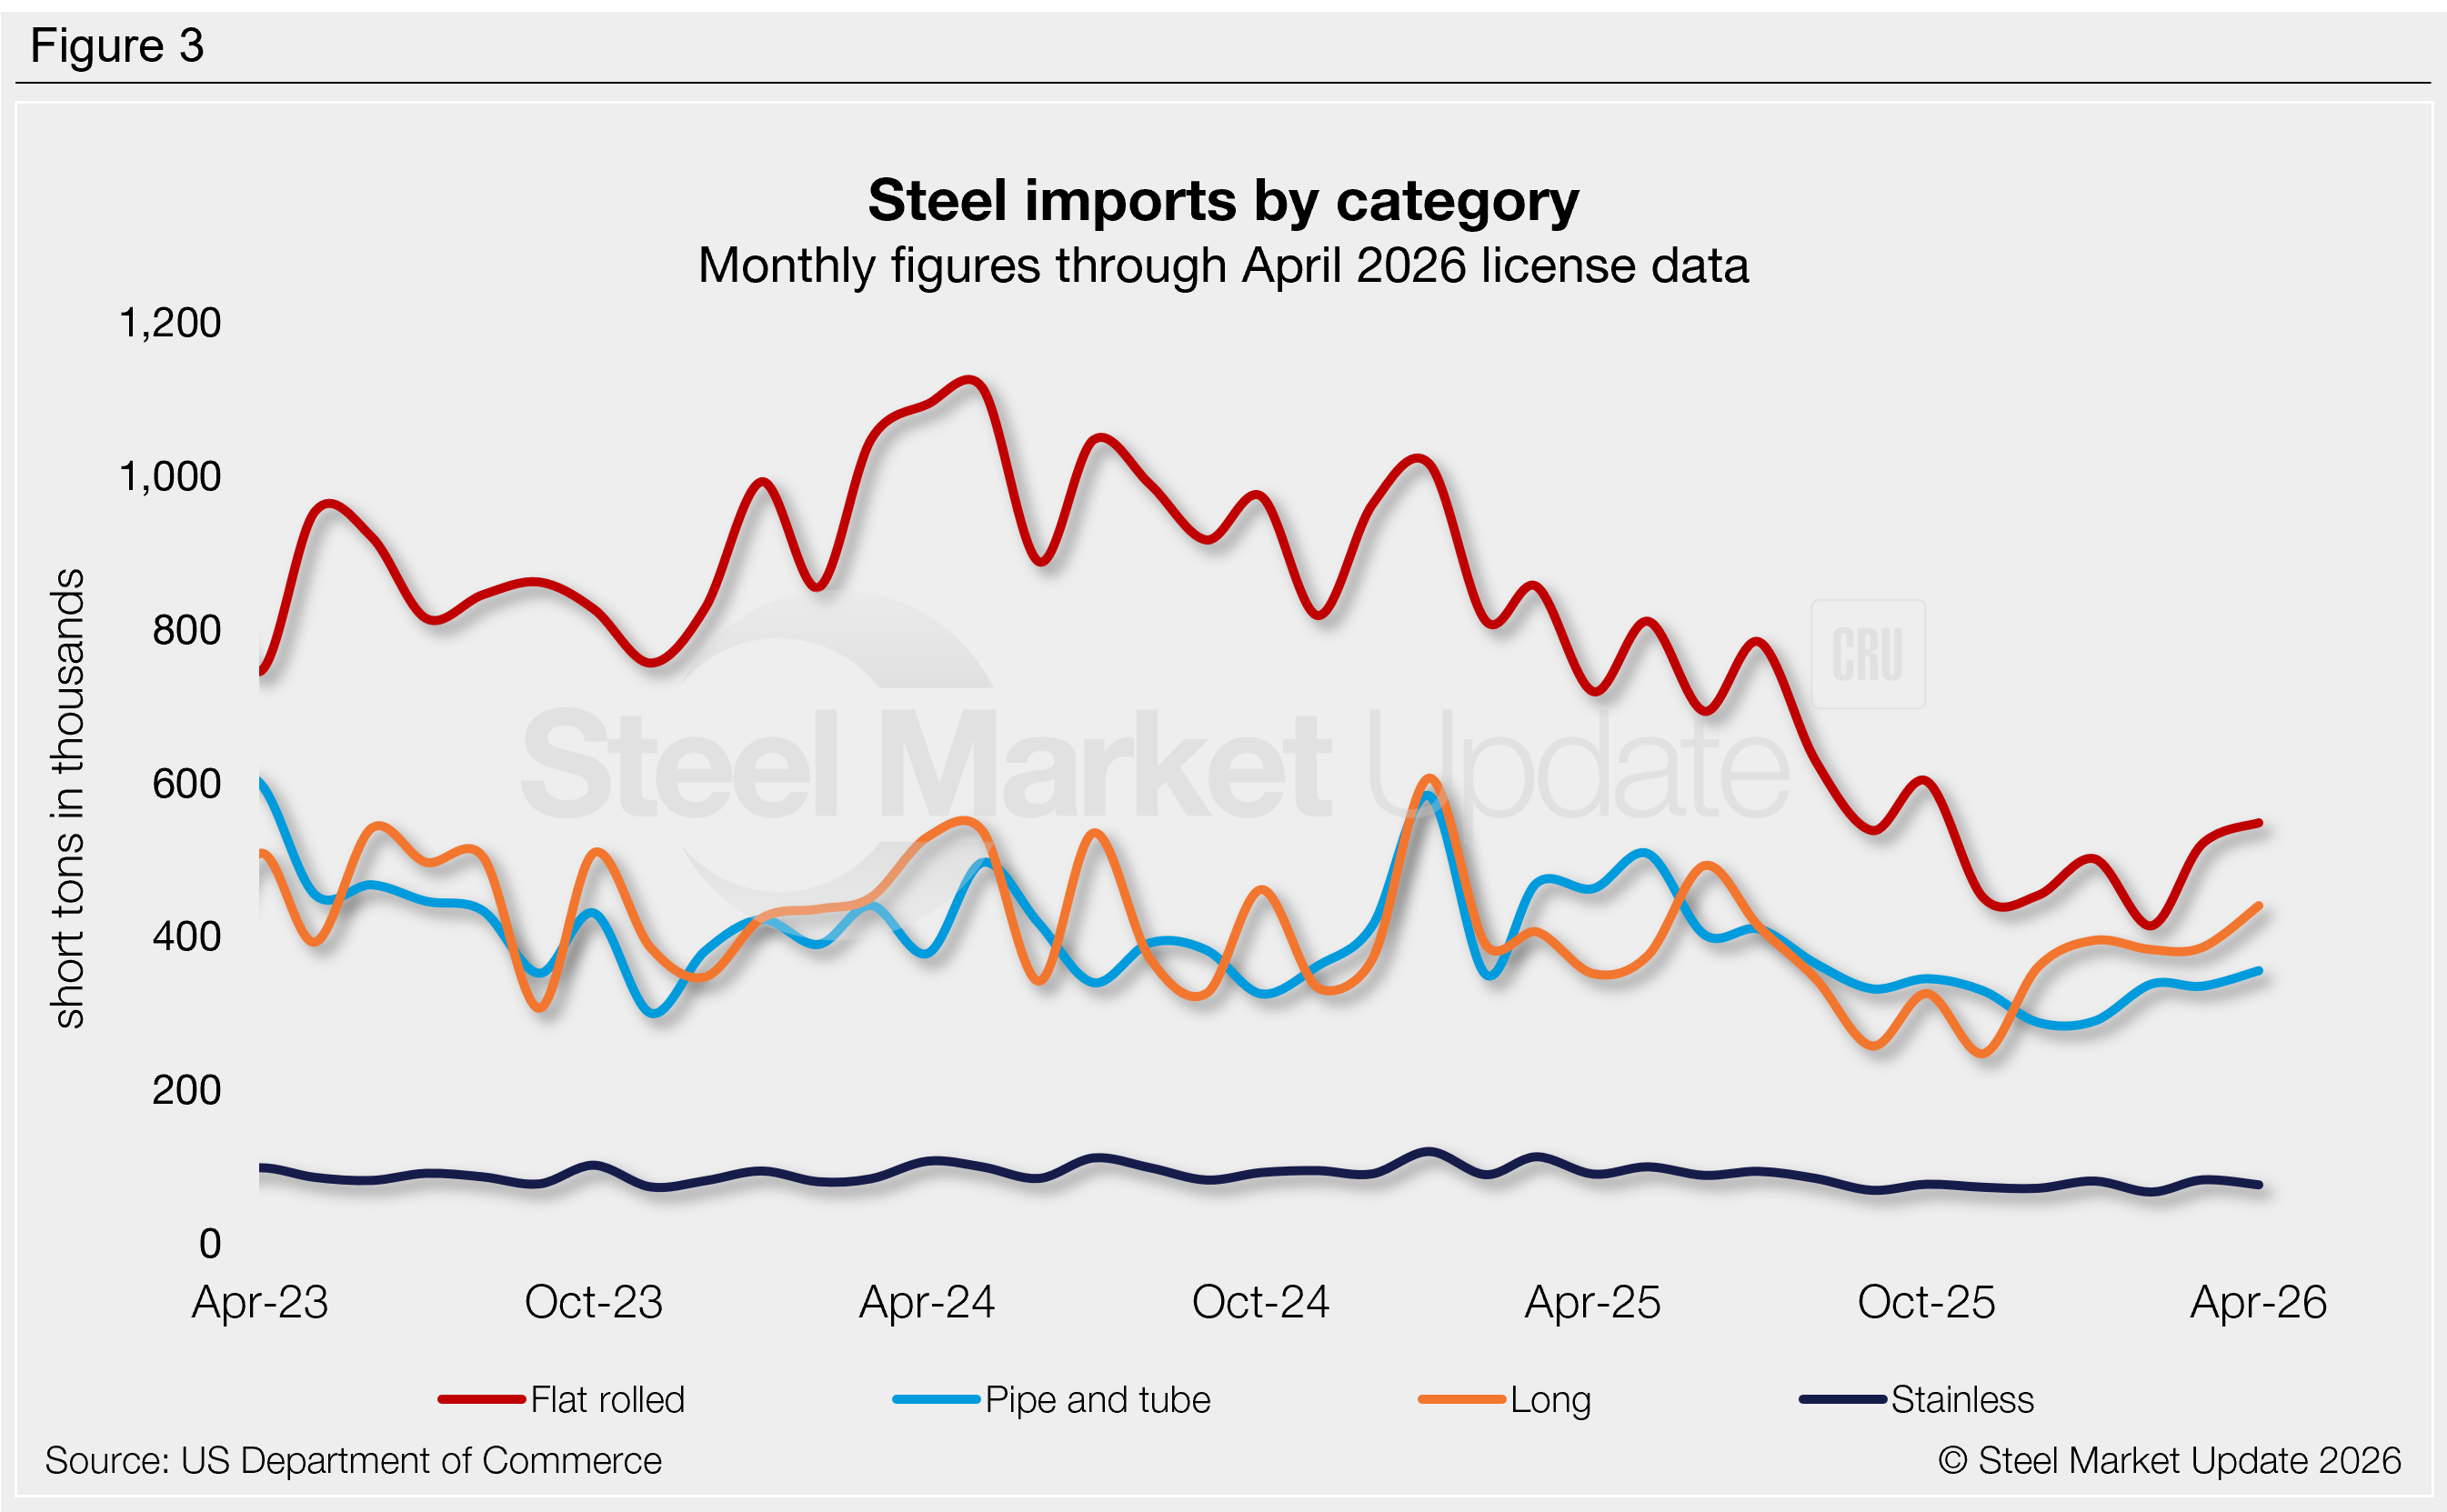
Figure 3 shows monthly imports of popular steel product categories. Notable shifts include:
- Flat-rolled imports rebounded 26% month-over-month (m/m) in March, previously at the lowest measure seen in our limited seven-year data history. April licenses are up another 5% m/m to a potential six-month high.
- Long product imports saw little change in March, up 1% m/m. License data shows a 14% recovery in April, possibly the highest monthly rate seen in 10 months.
- Pipe and tube imports eased 1% in March, while April licenses are back up 6% to a potential eight-month high.
- Stainless imports jumped 24% m/m in March, moving from a near five-year low to a seven-month high. April licenses are back down 8%.
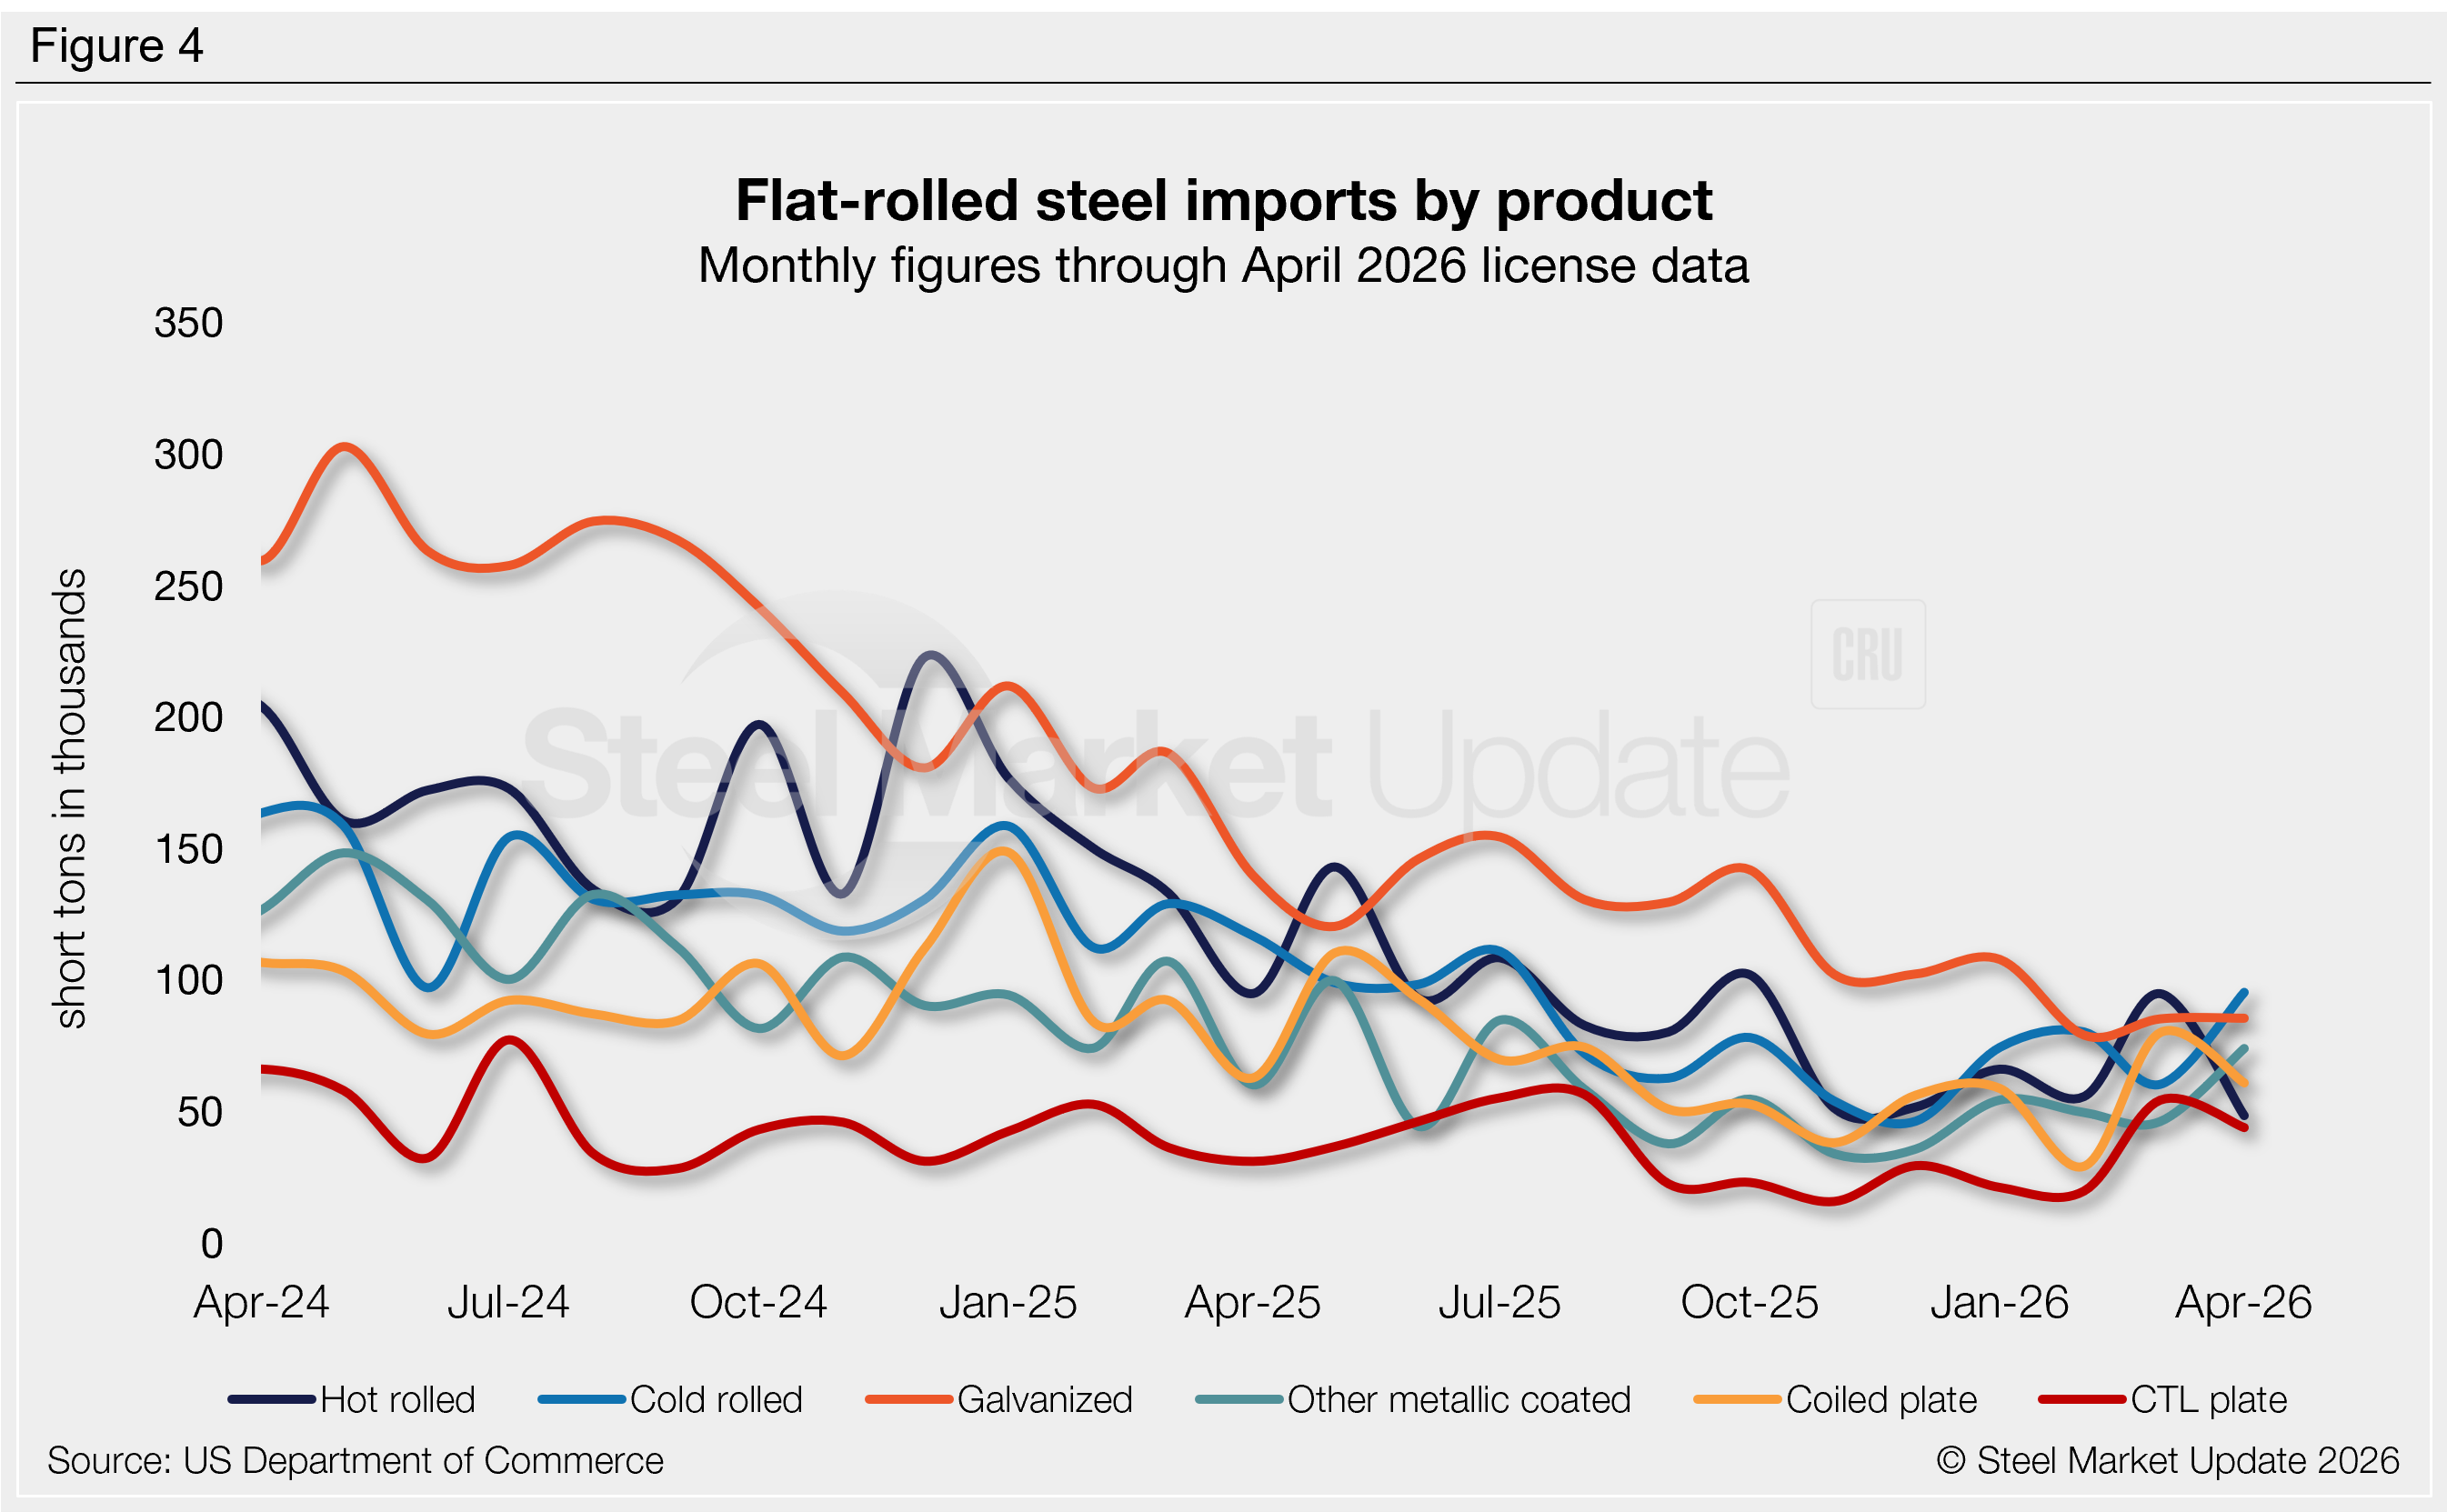
Flat-rolled imports
Figure 4 tracks flat-rolled imports for six popular sheet products. All but two products saw a m/m increase in March, while April was divided. Key highlights:
- Hot-rolled coil imports jumped 70% m/m in March to a five-month high. April licenses are back down 49%, potentially the lowest rate seen in our limited 28-year data history.
- Cold-rolled coil imports slipped 25% in March to the fourth-lowest monthly rate seen in the last decade. April licenses are back up 58%.
- Galvanized imports increased 8% m/m in March, previously at a 15-year low. License data shows stable trade through April.
- Other-metallic coated (mostly Galvalume) imports declined 7% m/m in March, though April licenses indicate a potential 60% recovery.
- Coiled plate imports surged 175% m/m in March to a nine-month high, previously at the lowest rate seen in our 17-year data history. April licenses are currently down 24%.
- Cut-to-length (CTL) plate imports also jumped 175% m/m in March to a seven-month high. License data shows a possible 19% reduction in April.