Analysis

May 15, 2026
April service center shipments and inventories report
Written by David Schollaert
Flat rolled = 45.7 shipping days of supply
Plate = 41.5 shipping days of supply
Flat rolled
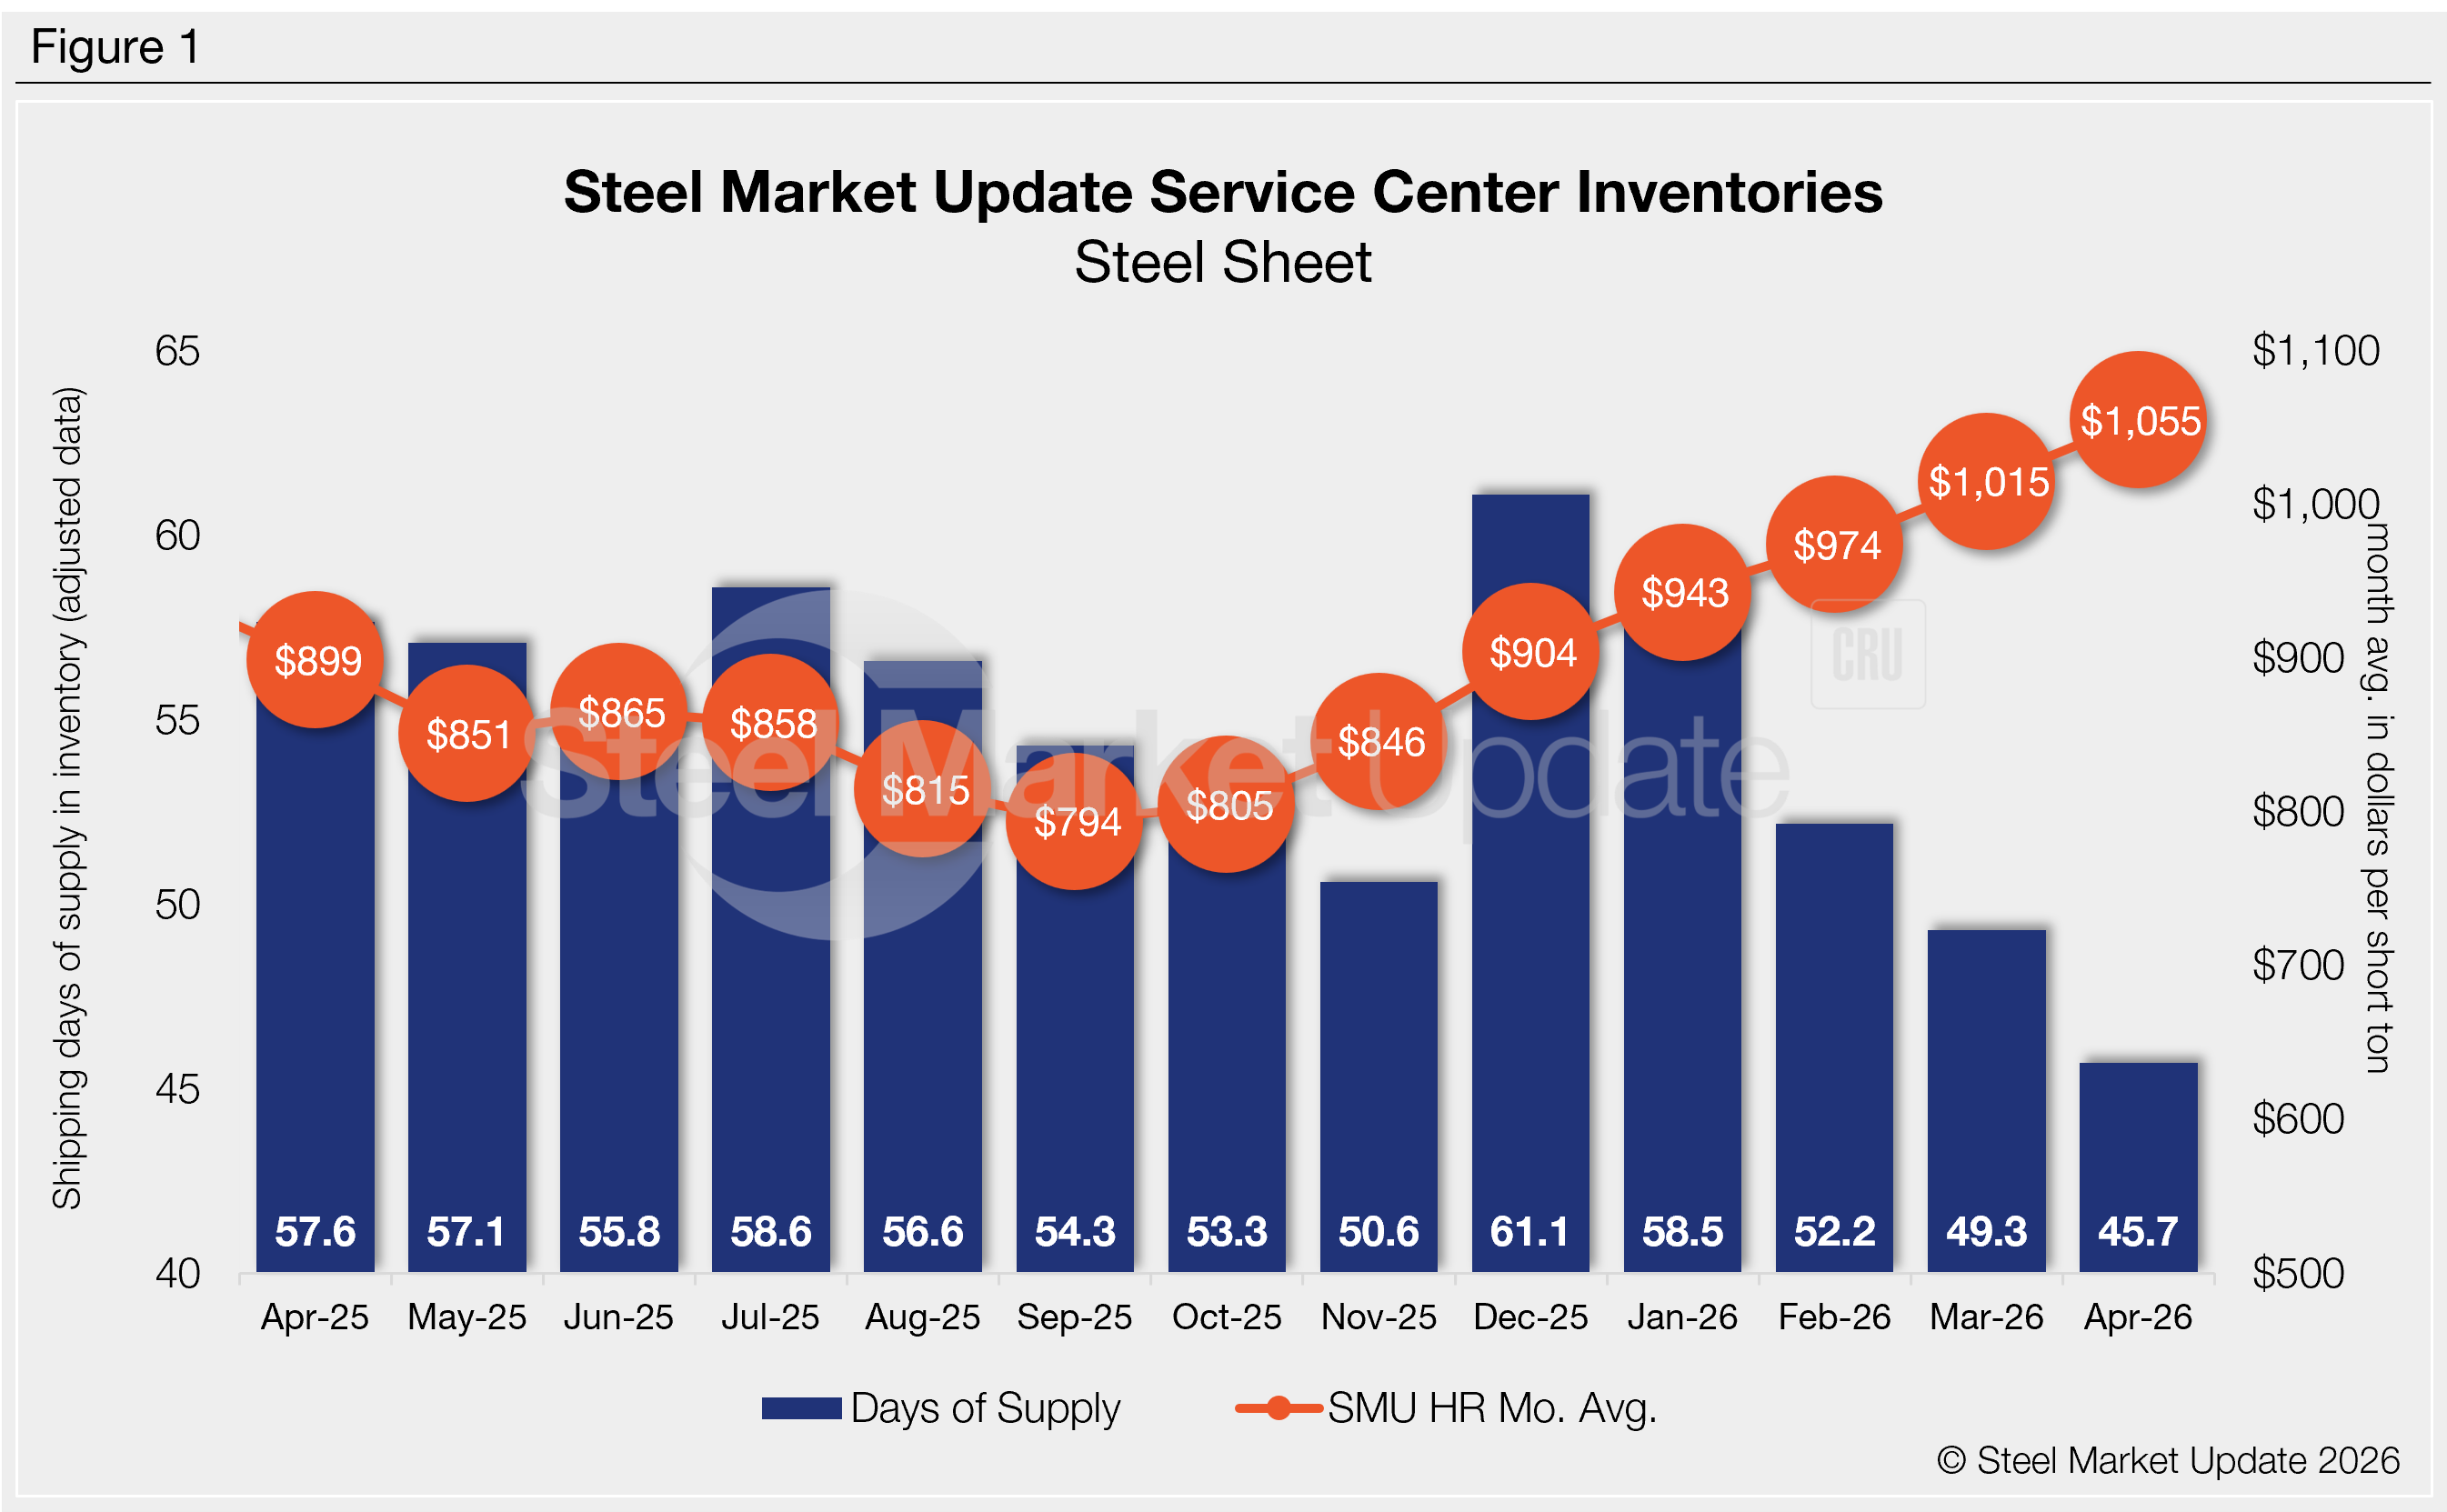
US service centers’ flat-rolled steel supply fell for a fourth straight month in April, with shipping days of supply slipping to 45.7 on an adjusted basis, according to SMU data.
That figure marks a 20% drop from 57.6 shipping days in April 2025. It also marks the lowest total since May 2021.
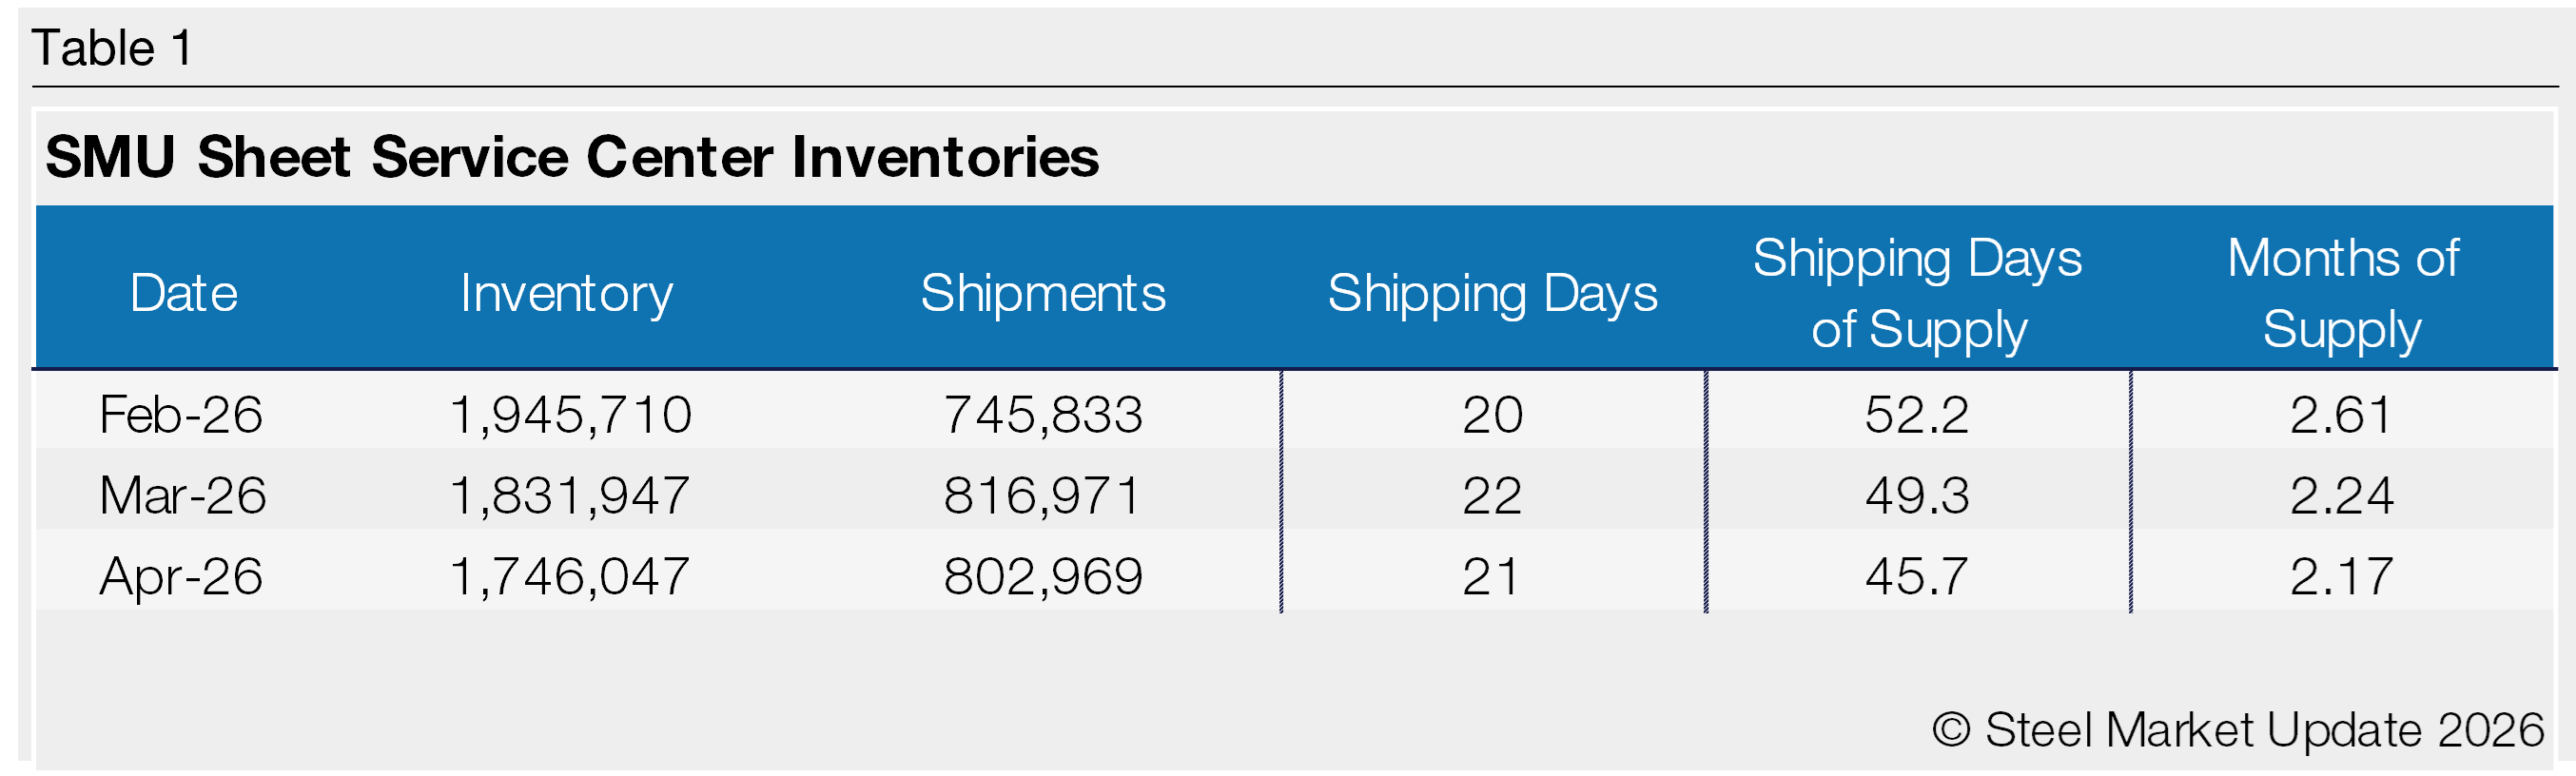
Flat roll inventories represented 2.17 months of supply in April, down 3% from 2.24 in March, and down 17% from 2.62 months in April 2025. The month-on-month (m/m) decrease in inventories was slightly offset by a slight increase (+2%) in intake.
The driver of low inventories continues to be late shipments from domestic mills. Service centers report that their own external shipments are outpacing receipts from mills as lead times stretch out.
Service center shipments in April outpaced intake by 12%, leading to the decline in flat-rolled steel supply last month.
All told, service center shipments in April were 1.7% lower m/m but are up about 0.5% y/y. The shipping pace remained high, despite April having 21 shipping days – one day less than March. The daily shipping rate was up 3% m/m and 5.3% higher y/y.
Increased shipments track with market participants’ characterization of demand as flat or up. Case in point: SMU’s late-April survey found that 44% of service centers were releasing the same amount of steel compared to a year earlier, while another 39% were releasing more steel. Only 17% reported releasing less vs. the same time a year earlier. (We find that late-month survey figures are a strong indicator of where full-month service center inventory data will land.)
At the end of April, service centers’ shipping days of supply on order were up 2% m/m, and up more than 14% y/y. The numbers appear even more significant when compared with how lean inventories remain.
The latest SMU survey from May 14 showed that lead times remained extended. The result corresponded well with SMU’s April survey, which saw, on average, 37% of service centers focused on building inventory. Fifty-eight percent maintained their inventory levels, while just 5% reported material reductions.
Plate
US service center plate inventories were also down in April, despite a rebound in intake—which jumped 31% m/m, according to SMU data.
At the end of April, service centers held 41.5 shipping days of supply of plate, down from 45.1 in March. Plate supply in April represented 1.98 months, down from 2.05 months in March.
A sharp rebound in intake came as service centers’ external shipments outpaced receipts due to mill delays, the same trend we saw in sheet. April inventories were marginally lower (-0.5%) m/m, while shipments saw a 3.2% increase vs. March.
April plate supply was also down vs. year-ago levels, when service centers carried 54.5 shipping days of supply, or 2.48 months of supply.
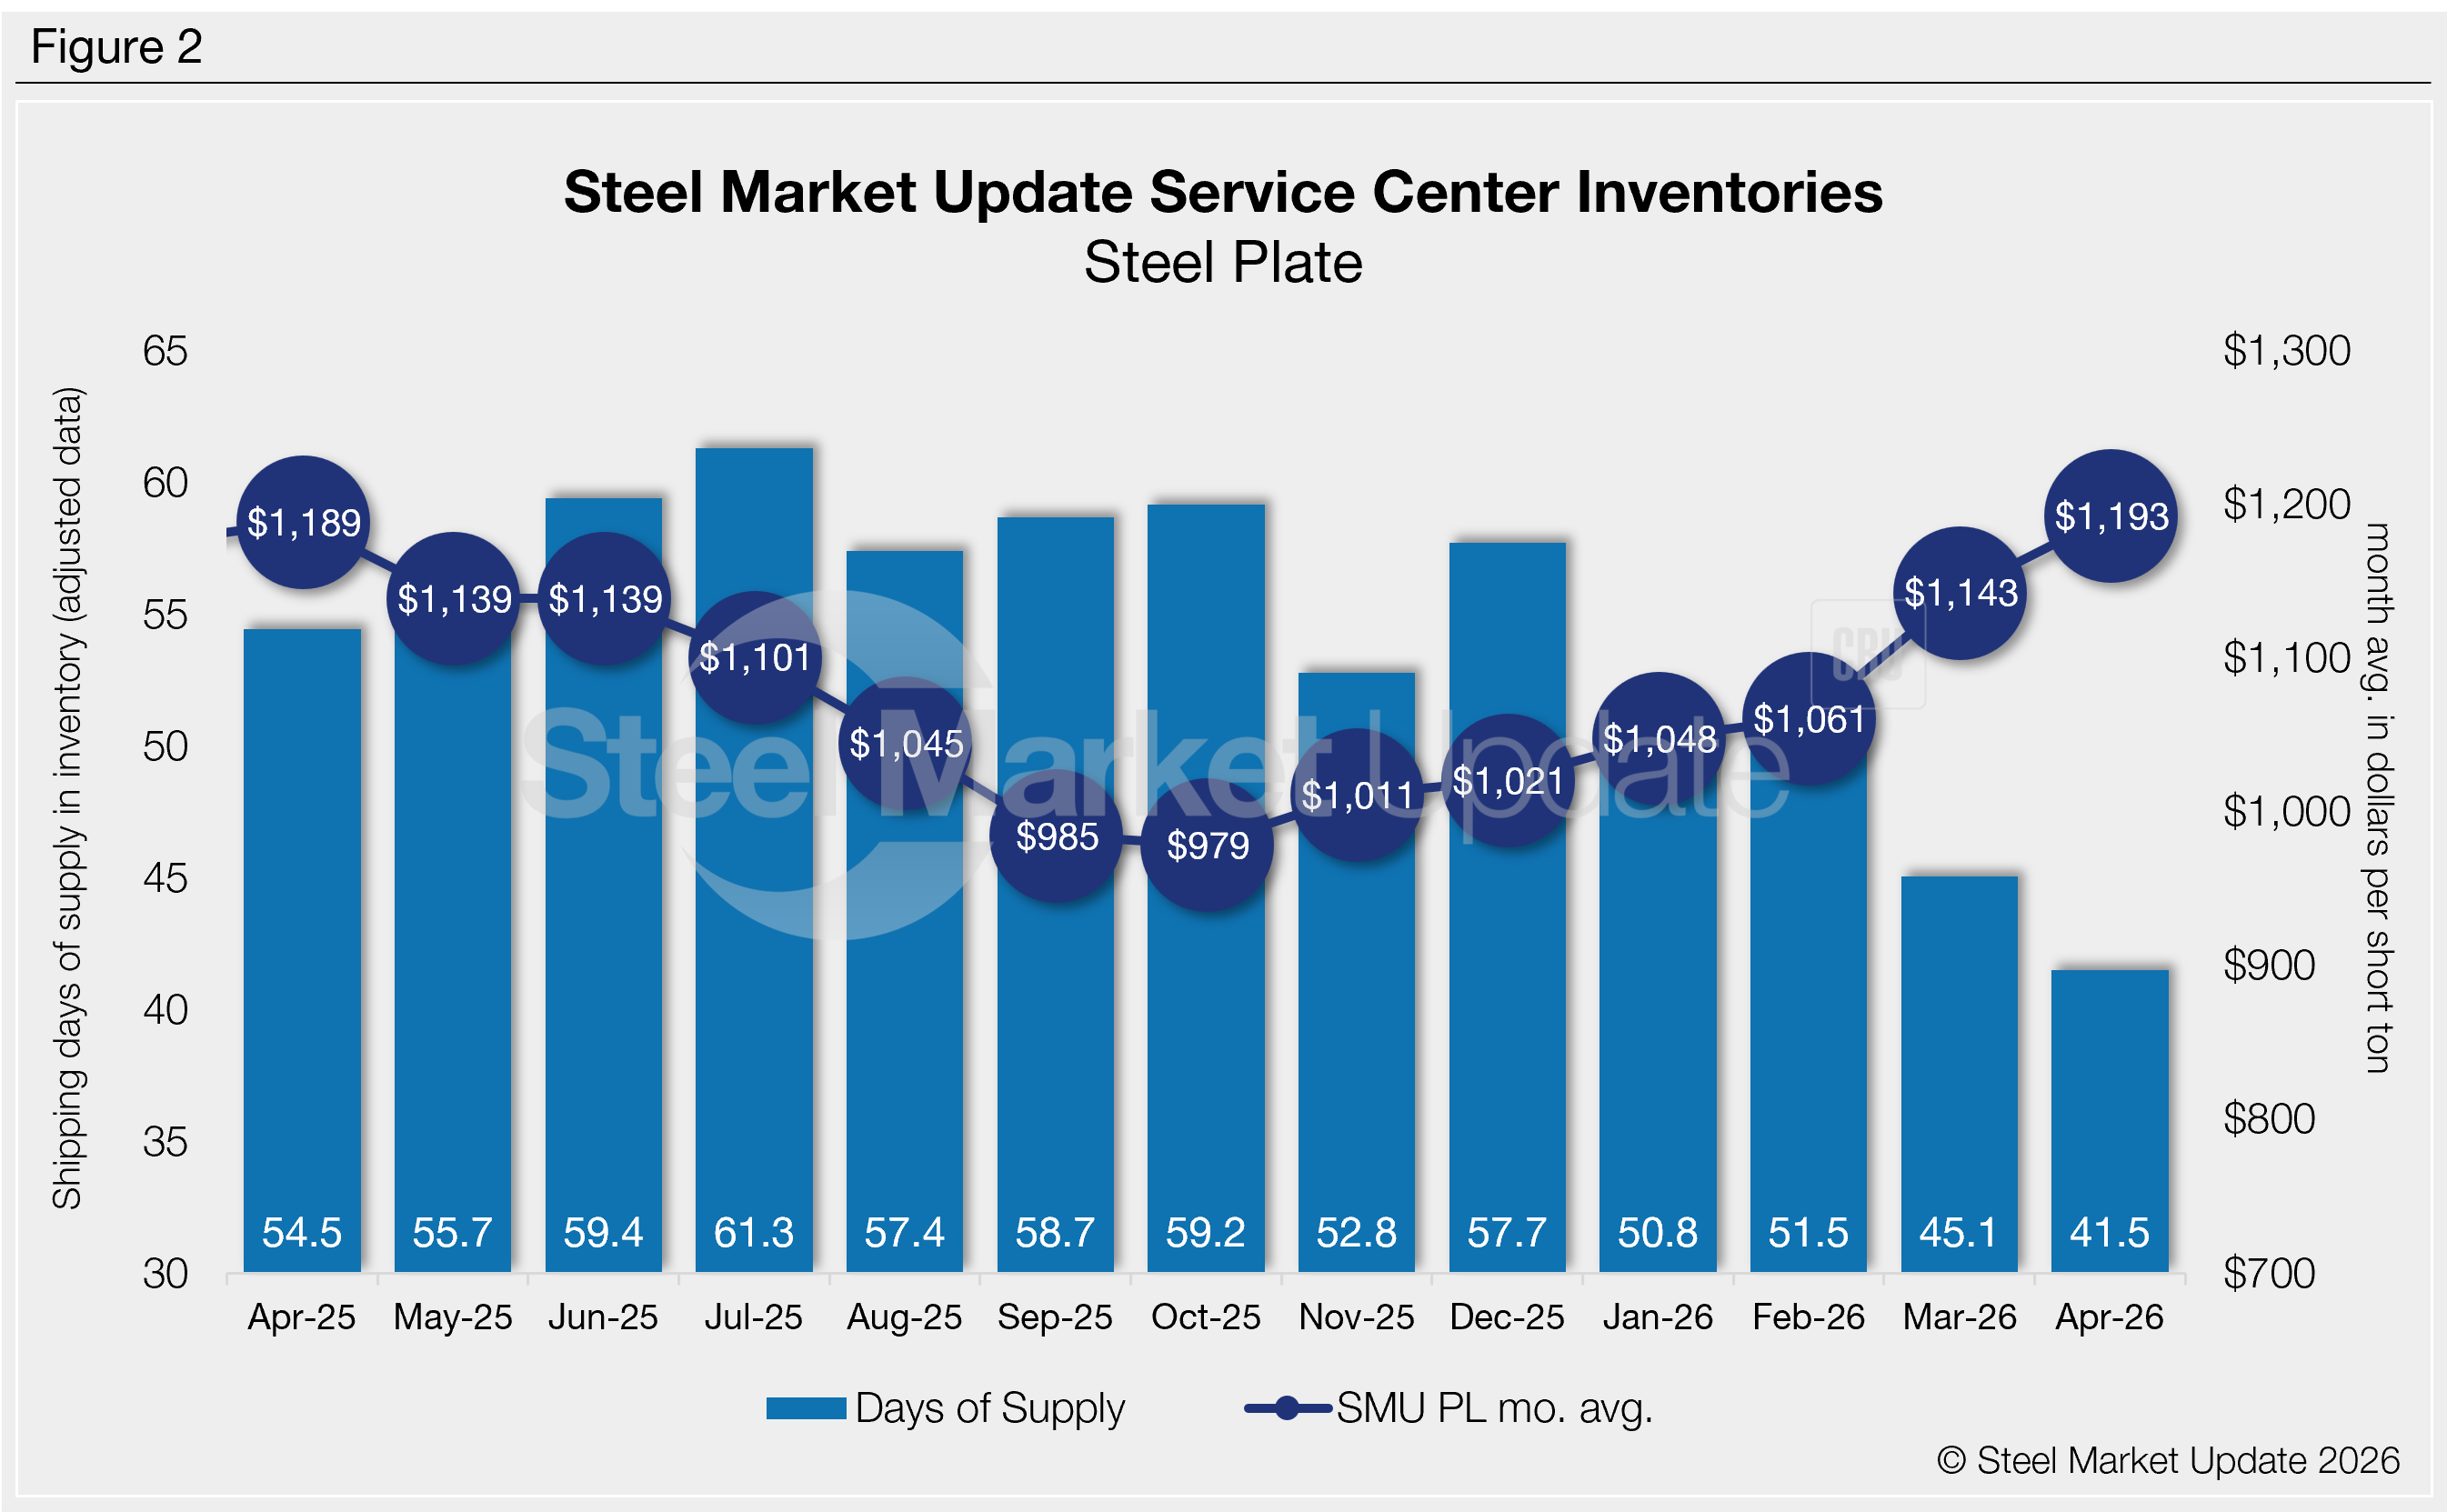
Meanwhile, the daily shipping rate was up 8.1% m/m. It now stands at the highest level since February 2020.
There are still some questions about what’s driving the increase in demand. Some think buying is reflective of strong demand while others see it as demand being pull-ahead of anticipated future price hikes.
Similarly, some market participants fear inventories are becoming too lean, especially given an uptick in project work. But others tell us plate demand has not picked up materially for the better part of the last eight months, and so the inventory situation is not dire.

Material on order rose in April. It’s up more than 8% m/m, and up a staggering 56% y/y. At the end of April, service centers’ shipping days of supply on order were up just 0.2% from March, but up 18% from April 2025.
While added domestic capacity has offset lower imports, plate lead times remain extended. They now stand at nearly 7.2 weeks on average, up modestly from a month earlier, according to the latest SMU survey.