Analysis
June 12, 2026
Steel imports grow through April and May
Written by Brett Linton
Steel imports recovered further in April and May, according to recently released data from the US Commerce Department. After reaching historic lows late last year, import volumes have increased each month of 2026. Final April figures show an 8% month-over-month (m/m) gain, and May license data show another 10% gain.
Recall that imports briefly surged to a two-and-a-half-year high at the start of 2025, then began to ease in the middle of the year. From September 2025 through February 2026, imports fell to some of the lowest levels recorded since 2020.
The final tally for April amounted to 1.91 million short tons (st), a nine-month high. This is up 347,000 st or 22% from the near five-year low set last September. May license data collected through June 7 currently totals 2.10 million st, potentially a 10-month high (Figure 1, left).
Imports by country
In April, two-thirds of the steel that entered the country came from just seven countries: South Korea (15%), Canada (14%), Brazil (11%), Mexico (10%), Vietnam (7%), Taiwan (5%), and Germany (4%). Other major suppliers included Japan, China, India, Malaysia, Romania, Spain, the Netherlands, Austria, and Argentina, each contributing 2-4% of the total. Combined, these 16 countries accounted for 87% of April imports.
To further explore steel import data by country, category, or specific product, visit the International Trade Administration’s Steel Import Monitor.
Import trends
Import data can be analyzed as a three-month moving average (3MMA) to smooth out monthly variations and better highlight trends (Figure 1, right). From this perspective, imports trended lower across 2025, bottomed out in early 2026, and have trended back upward since.
The 3MMA rose to a seven-month high of 1.79 million st in April and is up to 1.93 million st through May licenses, a potential nine-month high. Although up, the recent 3MMA measures remain historically weak in comparison to those of the prior five years.
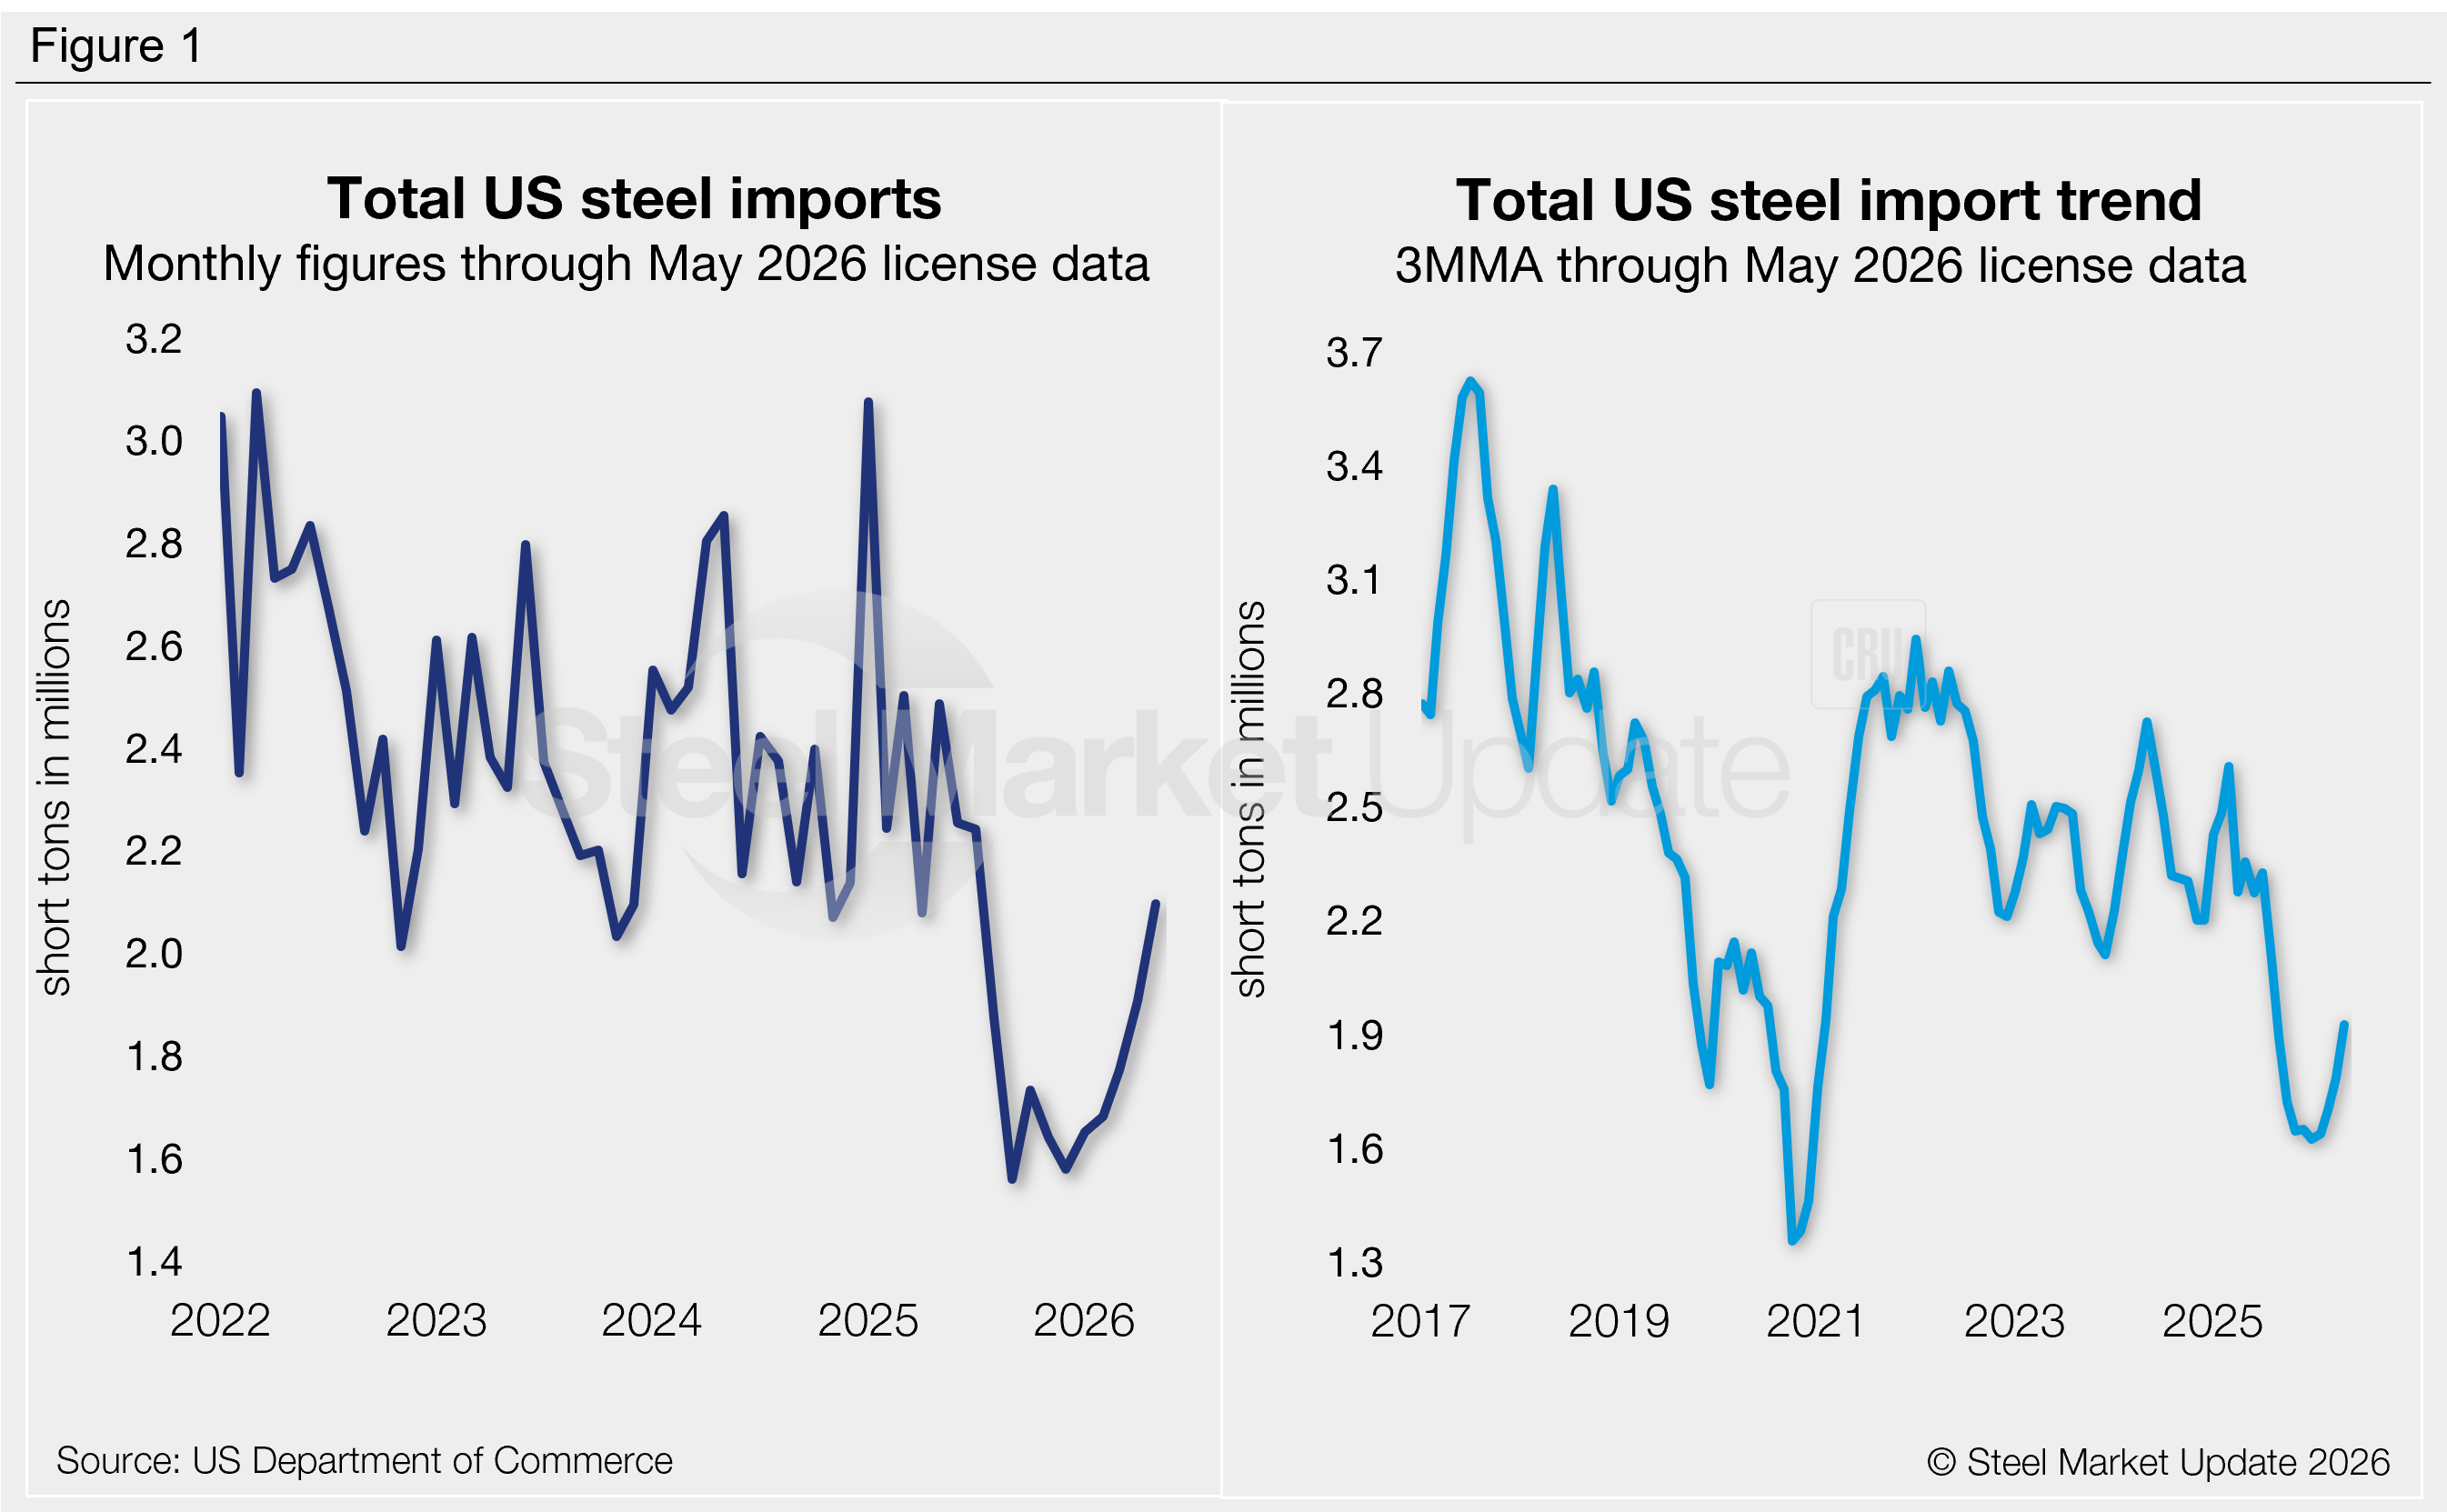
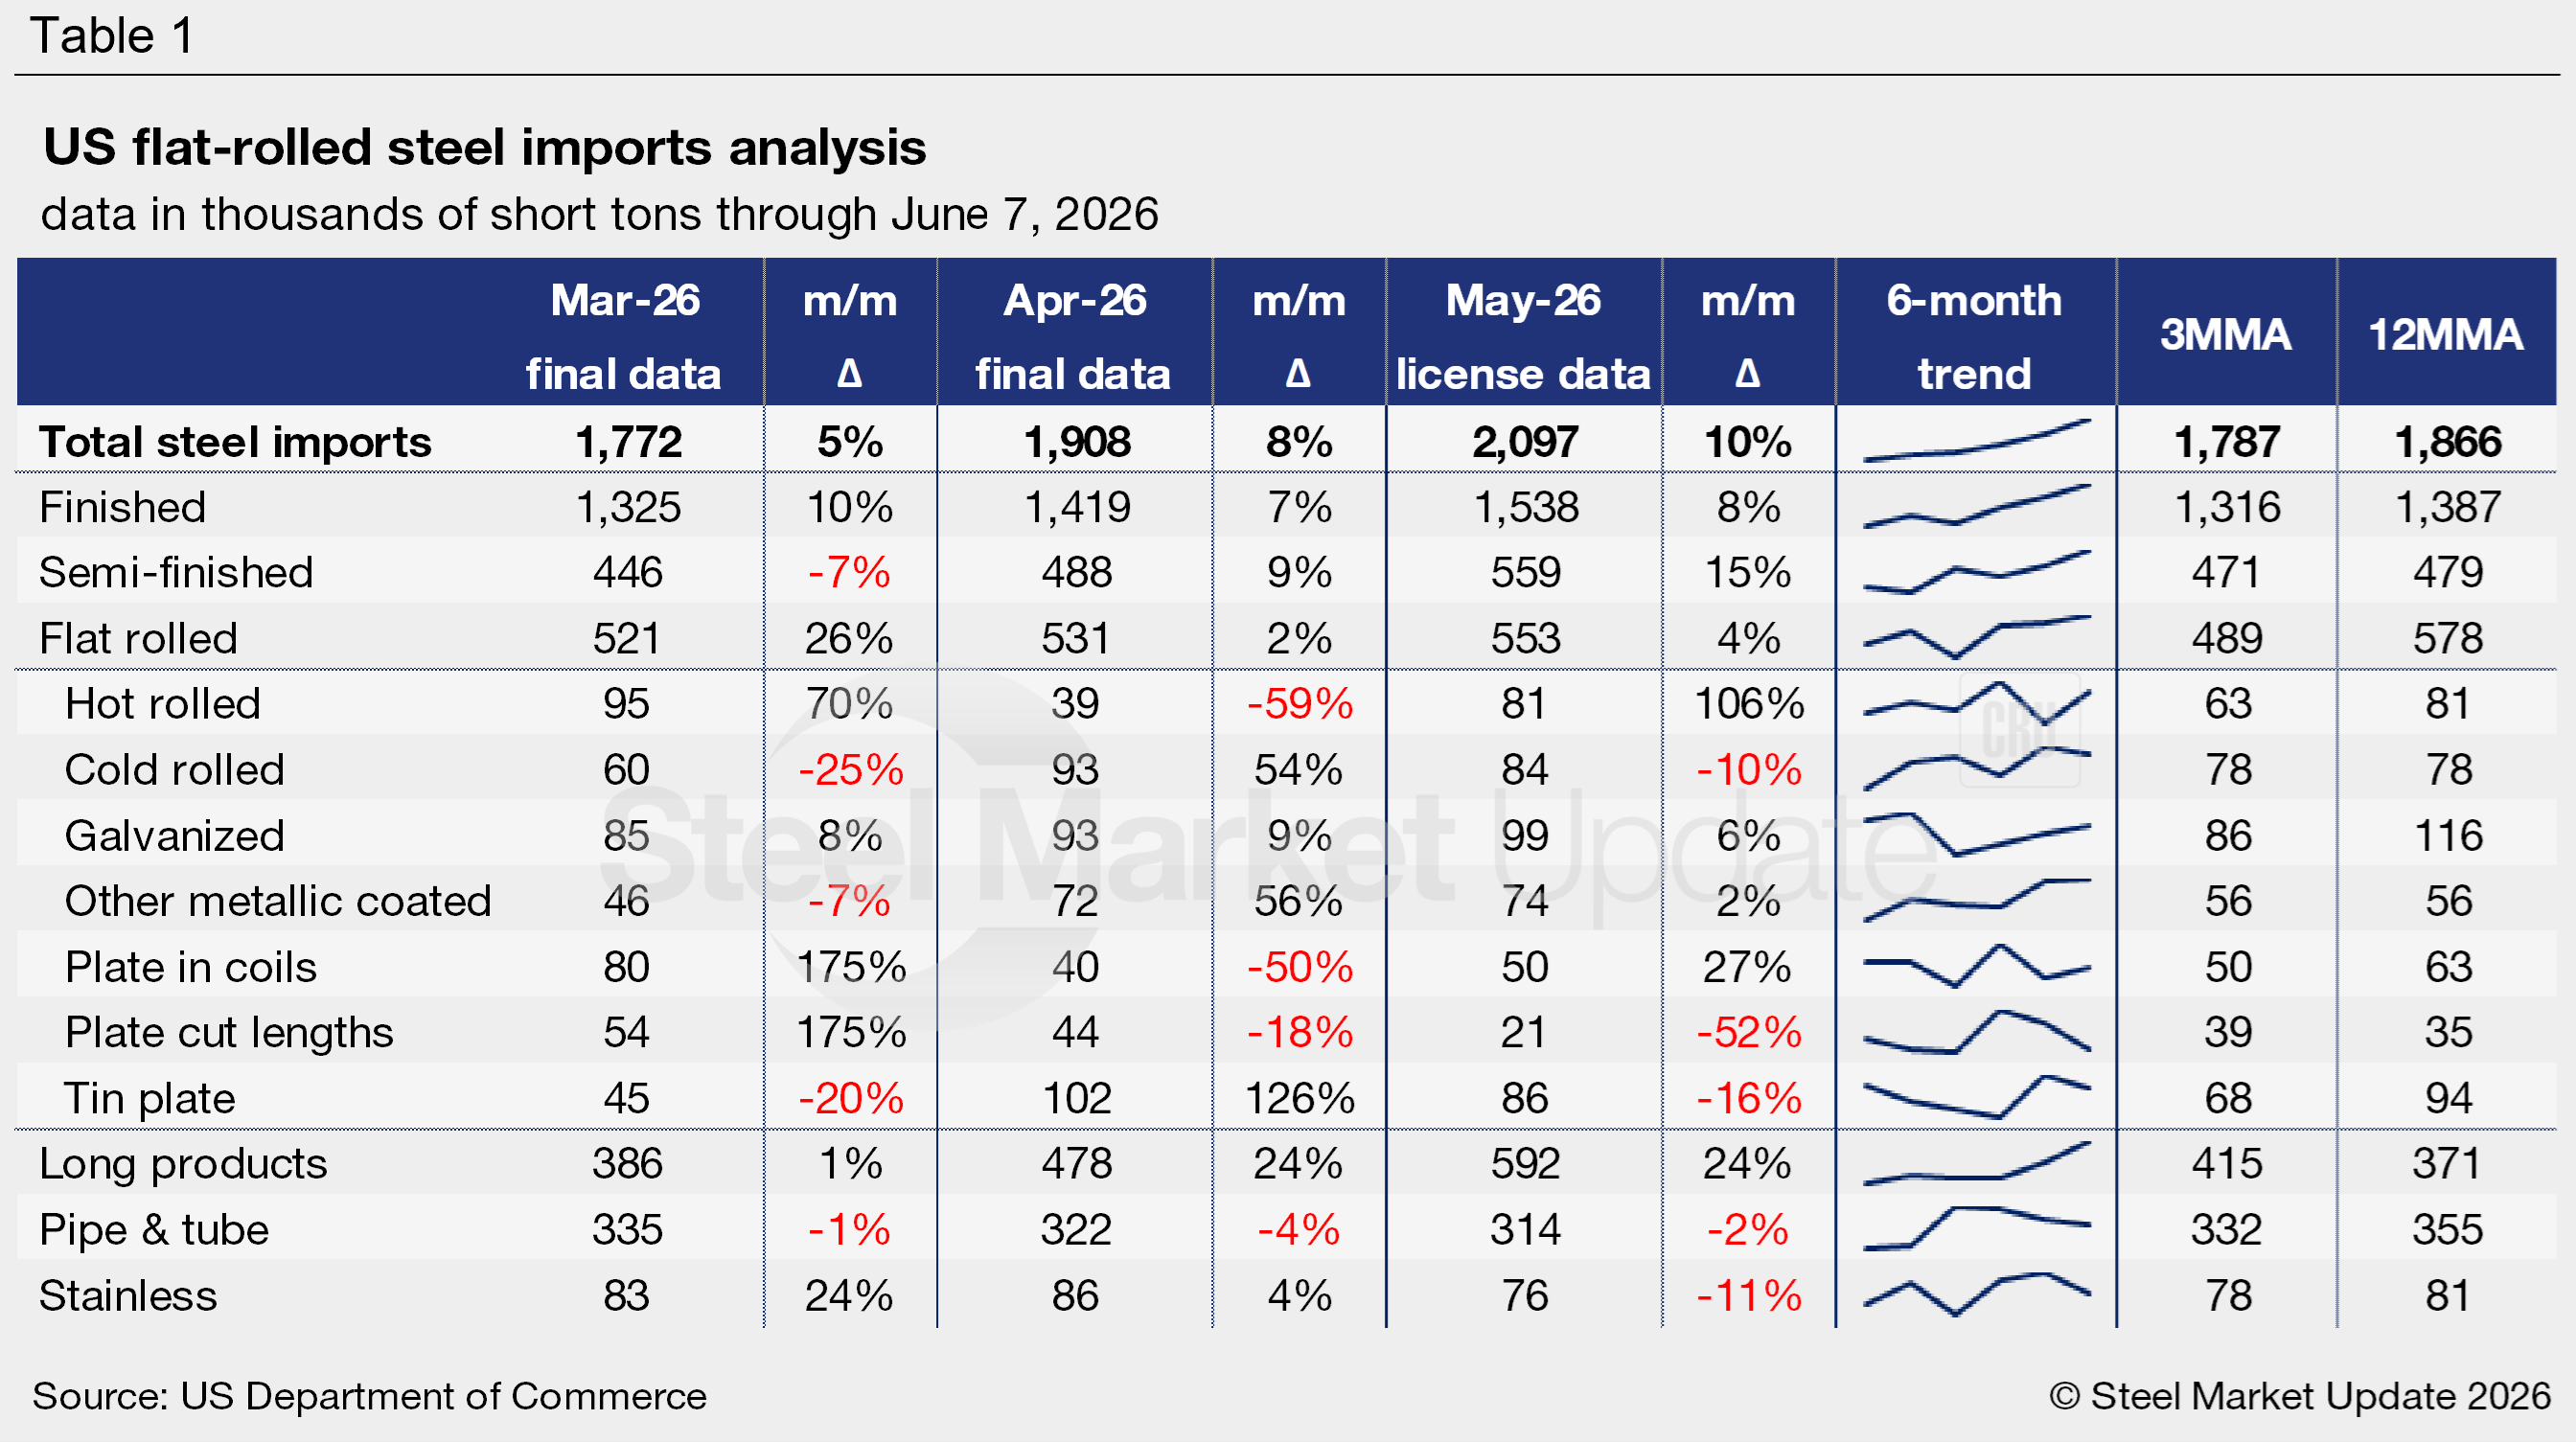
Table 1 highlights high-volume steel product imports (click to expand). Note that the 3MMA and 12MMA columns are calculated through final April data and do not include May licenses. For deeper analysis, visit our Steel Imports page.
Finished vs. semi-finished imports
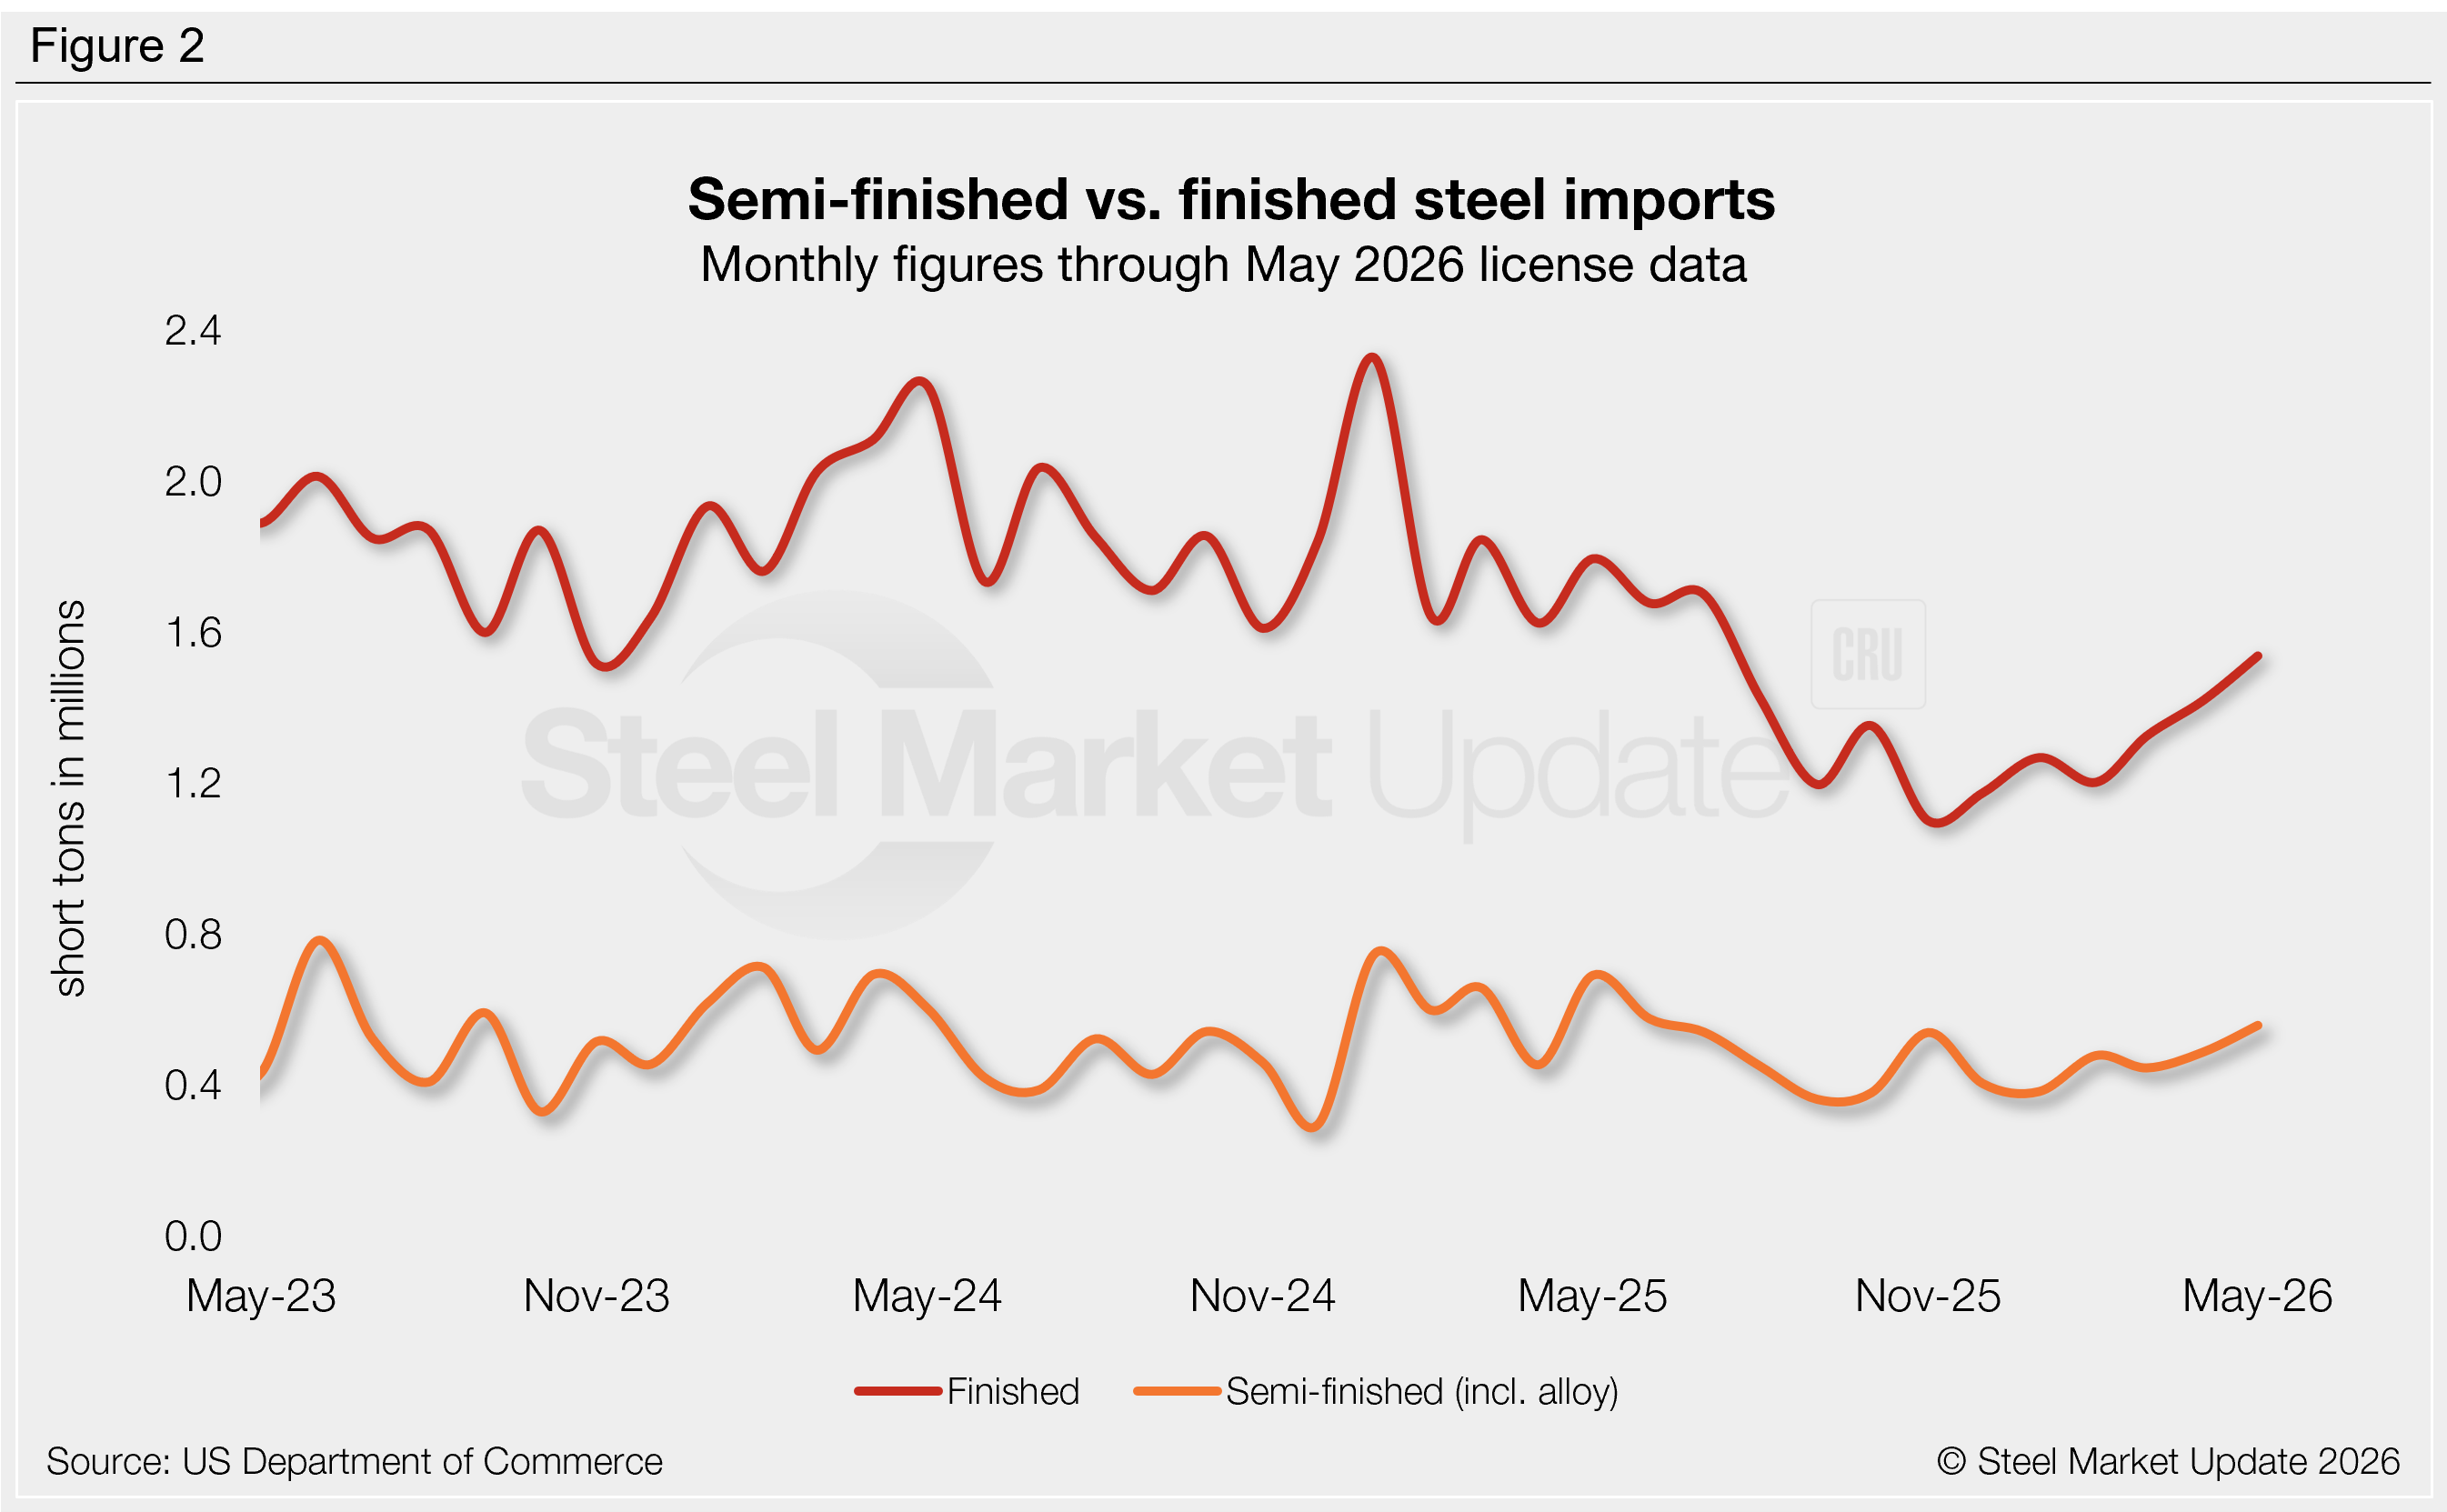
Imports of finished steel products vs. semi-finished material (mostly slabs to be further processed by a mill) followed similar trends in April and May (Figure 2). This was not the case from late 2025 through early 2026.
- After falling 7% m/m in March, April semi-finished trade rose 9% to 488,000 st. May licenses are currently up another 15% to 559,000 st (a potential 11-month high).
- Finished imports recovered 7% m/m in April to 1.42 million st, and May licenses are up another 8% to 1.54 million st (a potential 10-month high).
Imports by category
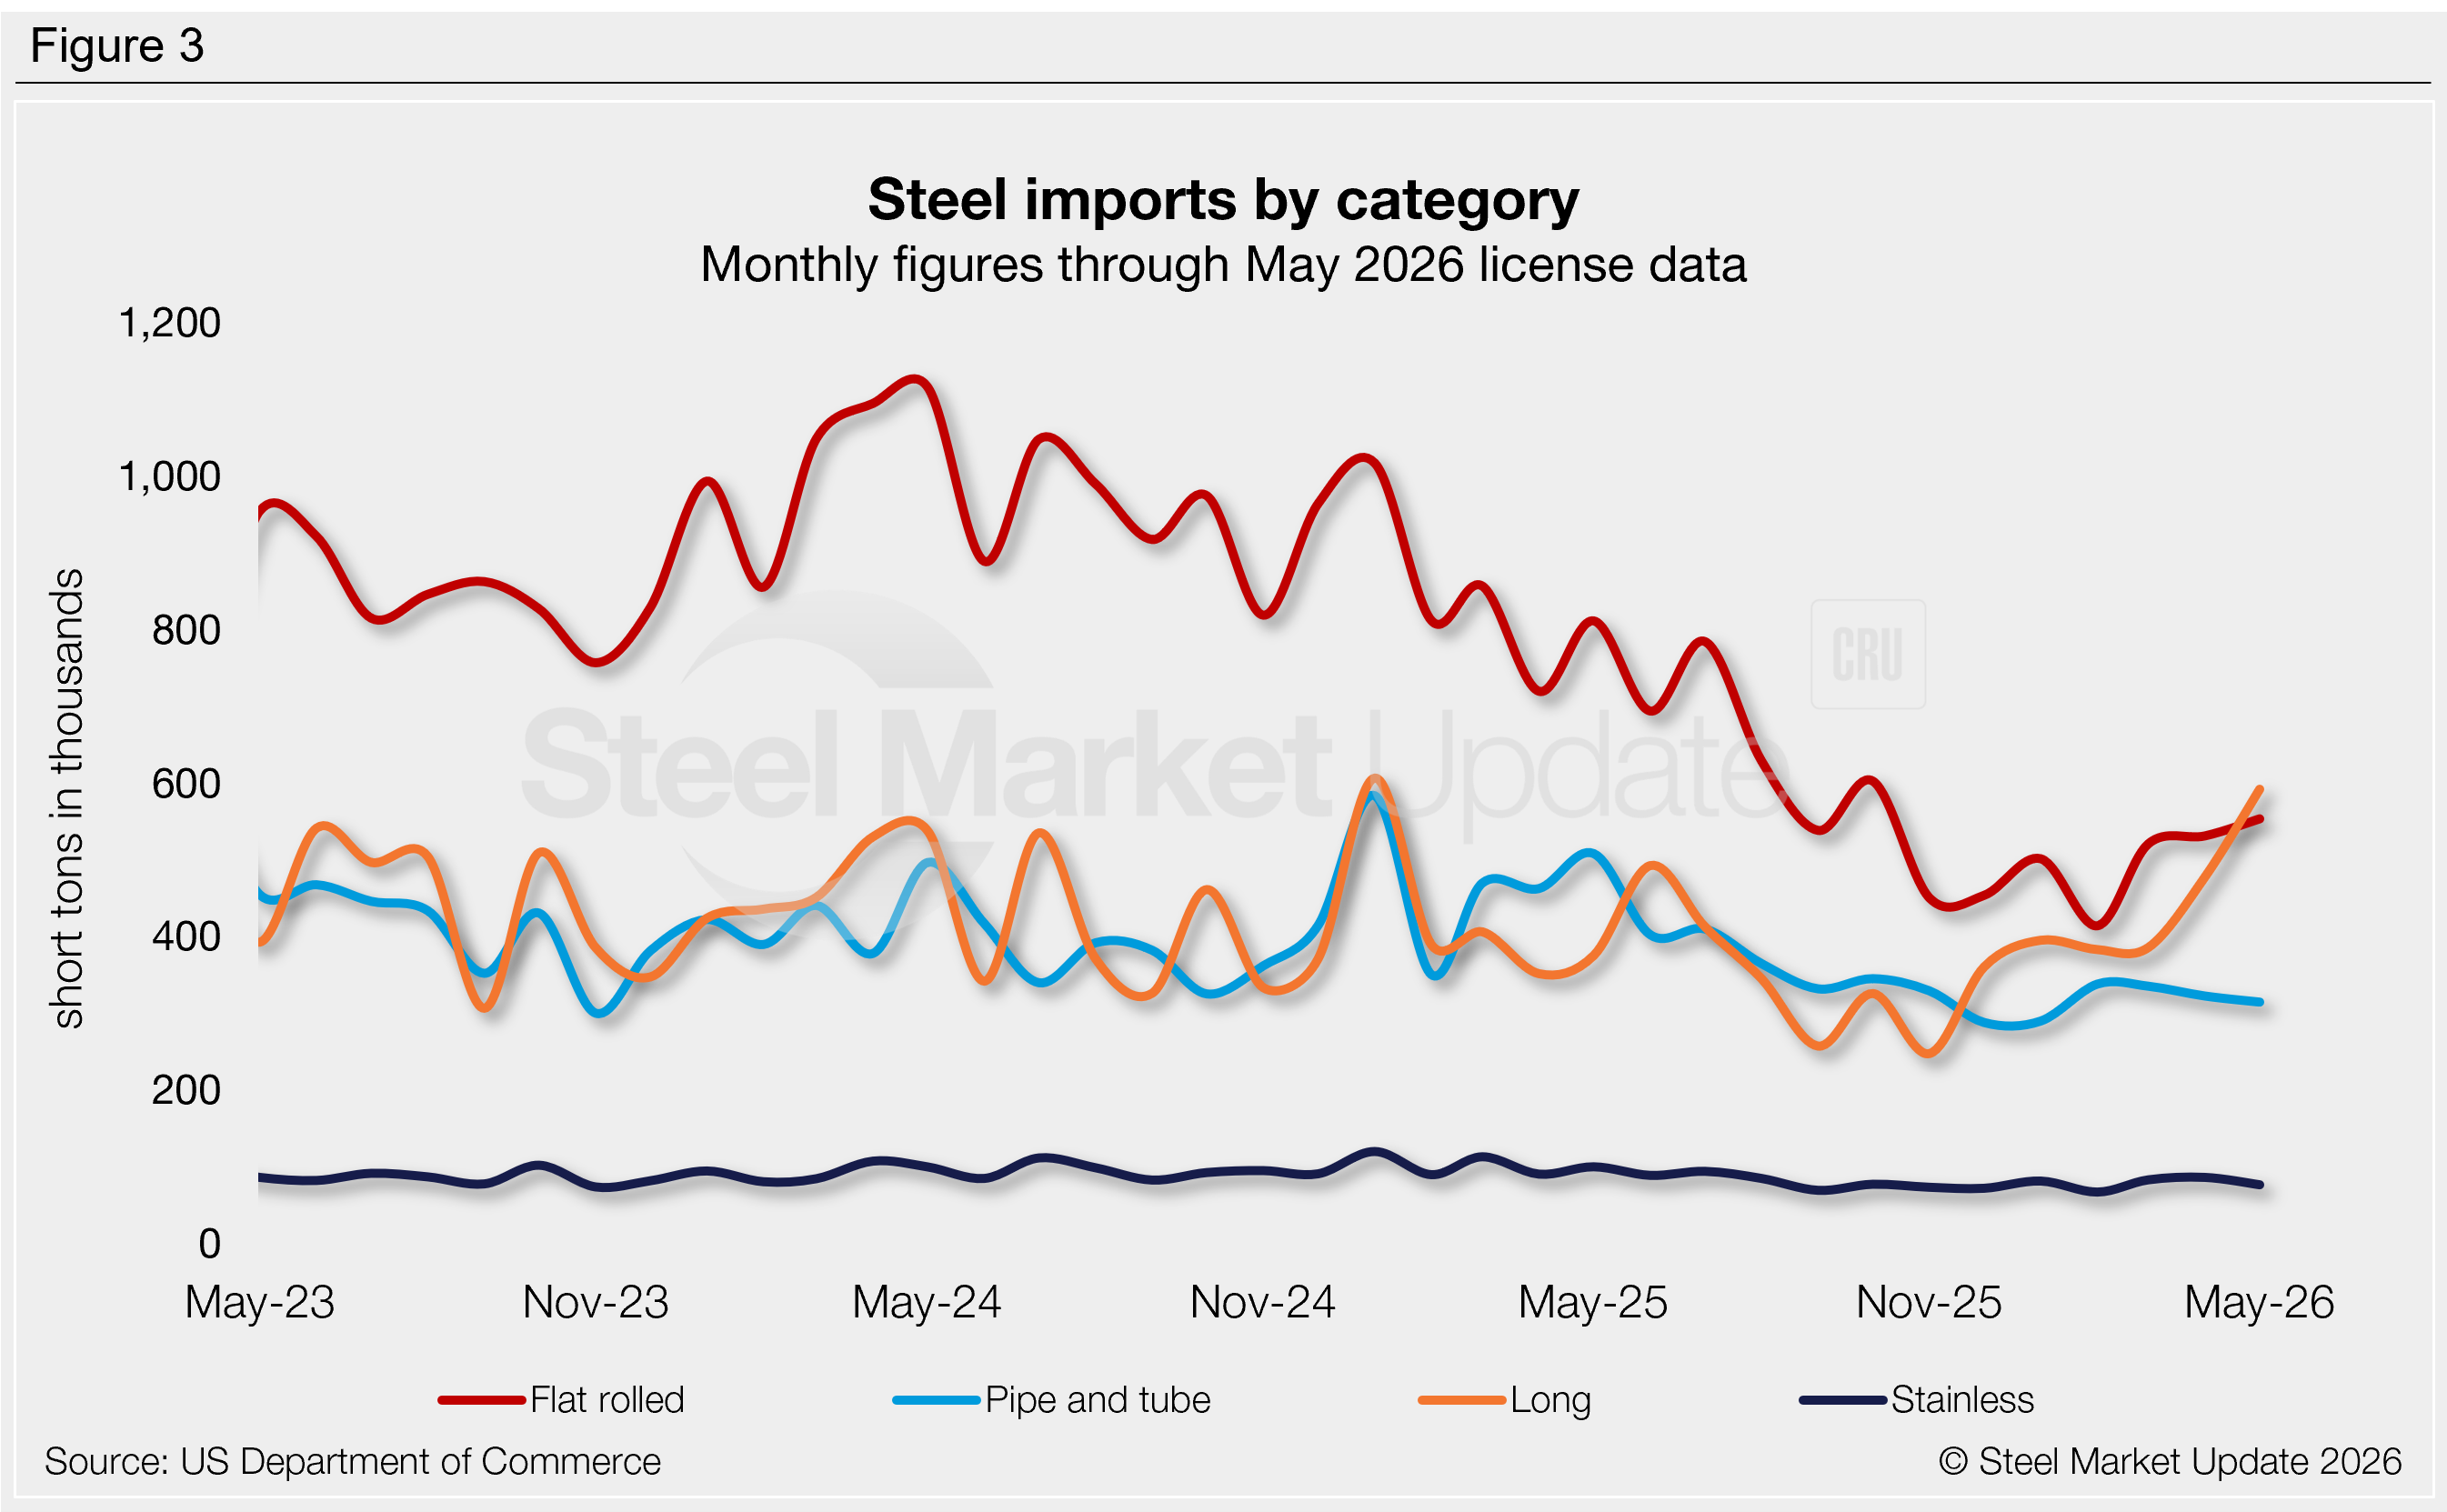
Figure 3 shows monthly imports of popular steel product categories. Not all groups are performing the same. Notable shifts include:
- Flat-rolled imports had rebounded 26% in March following February’s multi-year low. They rose 2% further in April and another 4% in May, potentially a seven-month high.
- Long product imports jumped 24% m/m in April and another 24% in May (potentially the highest level seen in 16 months).
- Pipe and tube imports peaked in February and have fallen each month since. March was down 1% m/m, April slipped 4%, and May is potentially down 2% further.
- Stainless imports rose 4% m/m in April to a nine-month high, but May licenses are back down 11%.
Flat-rolled imports
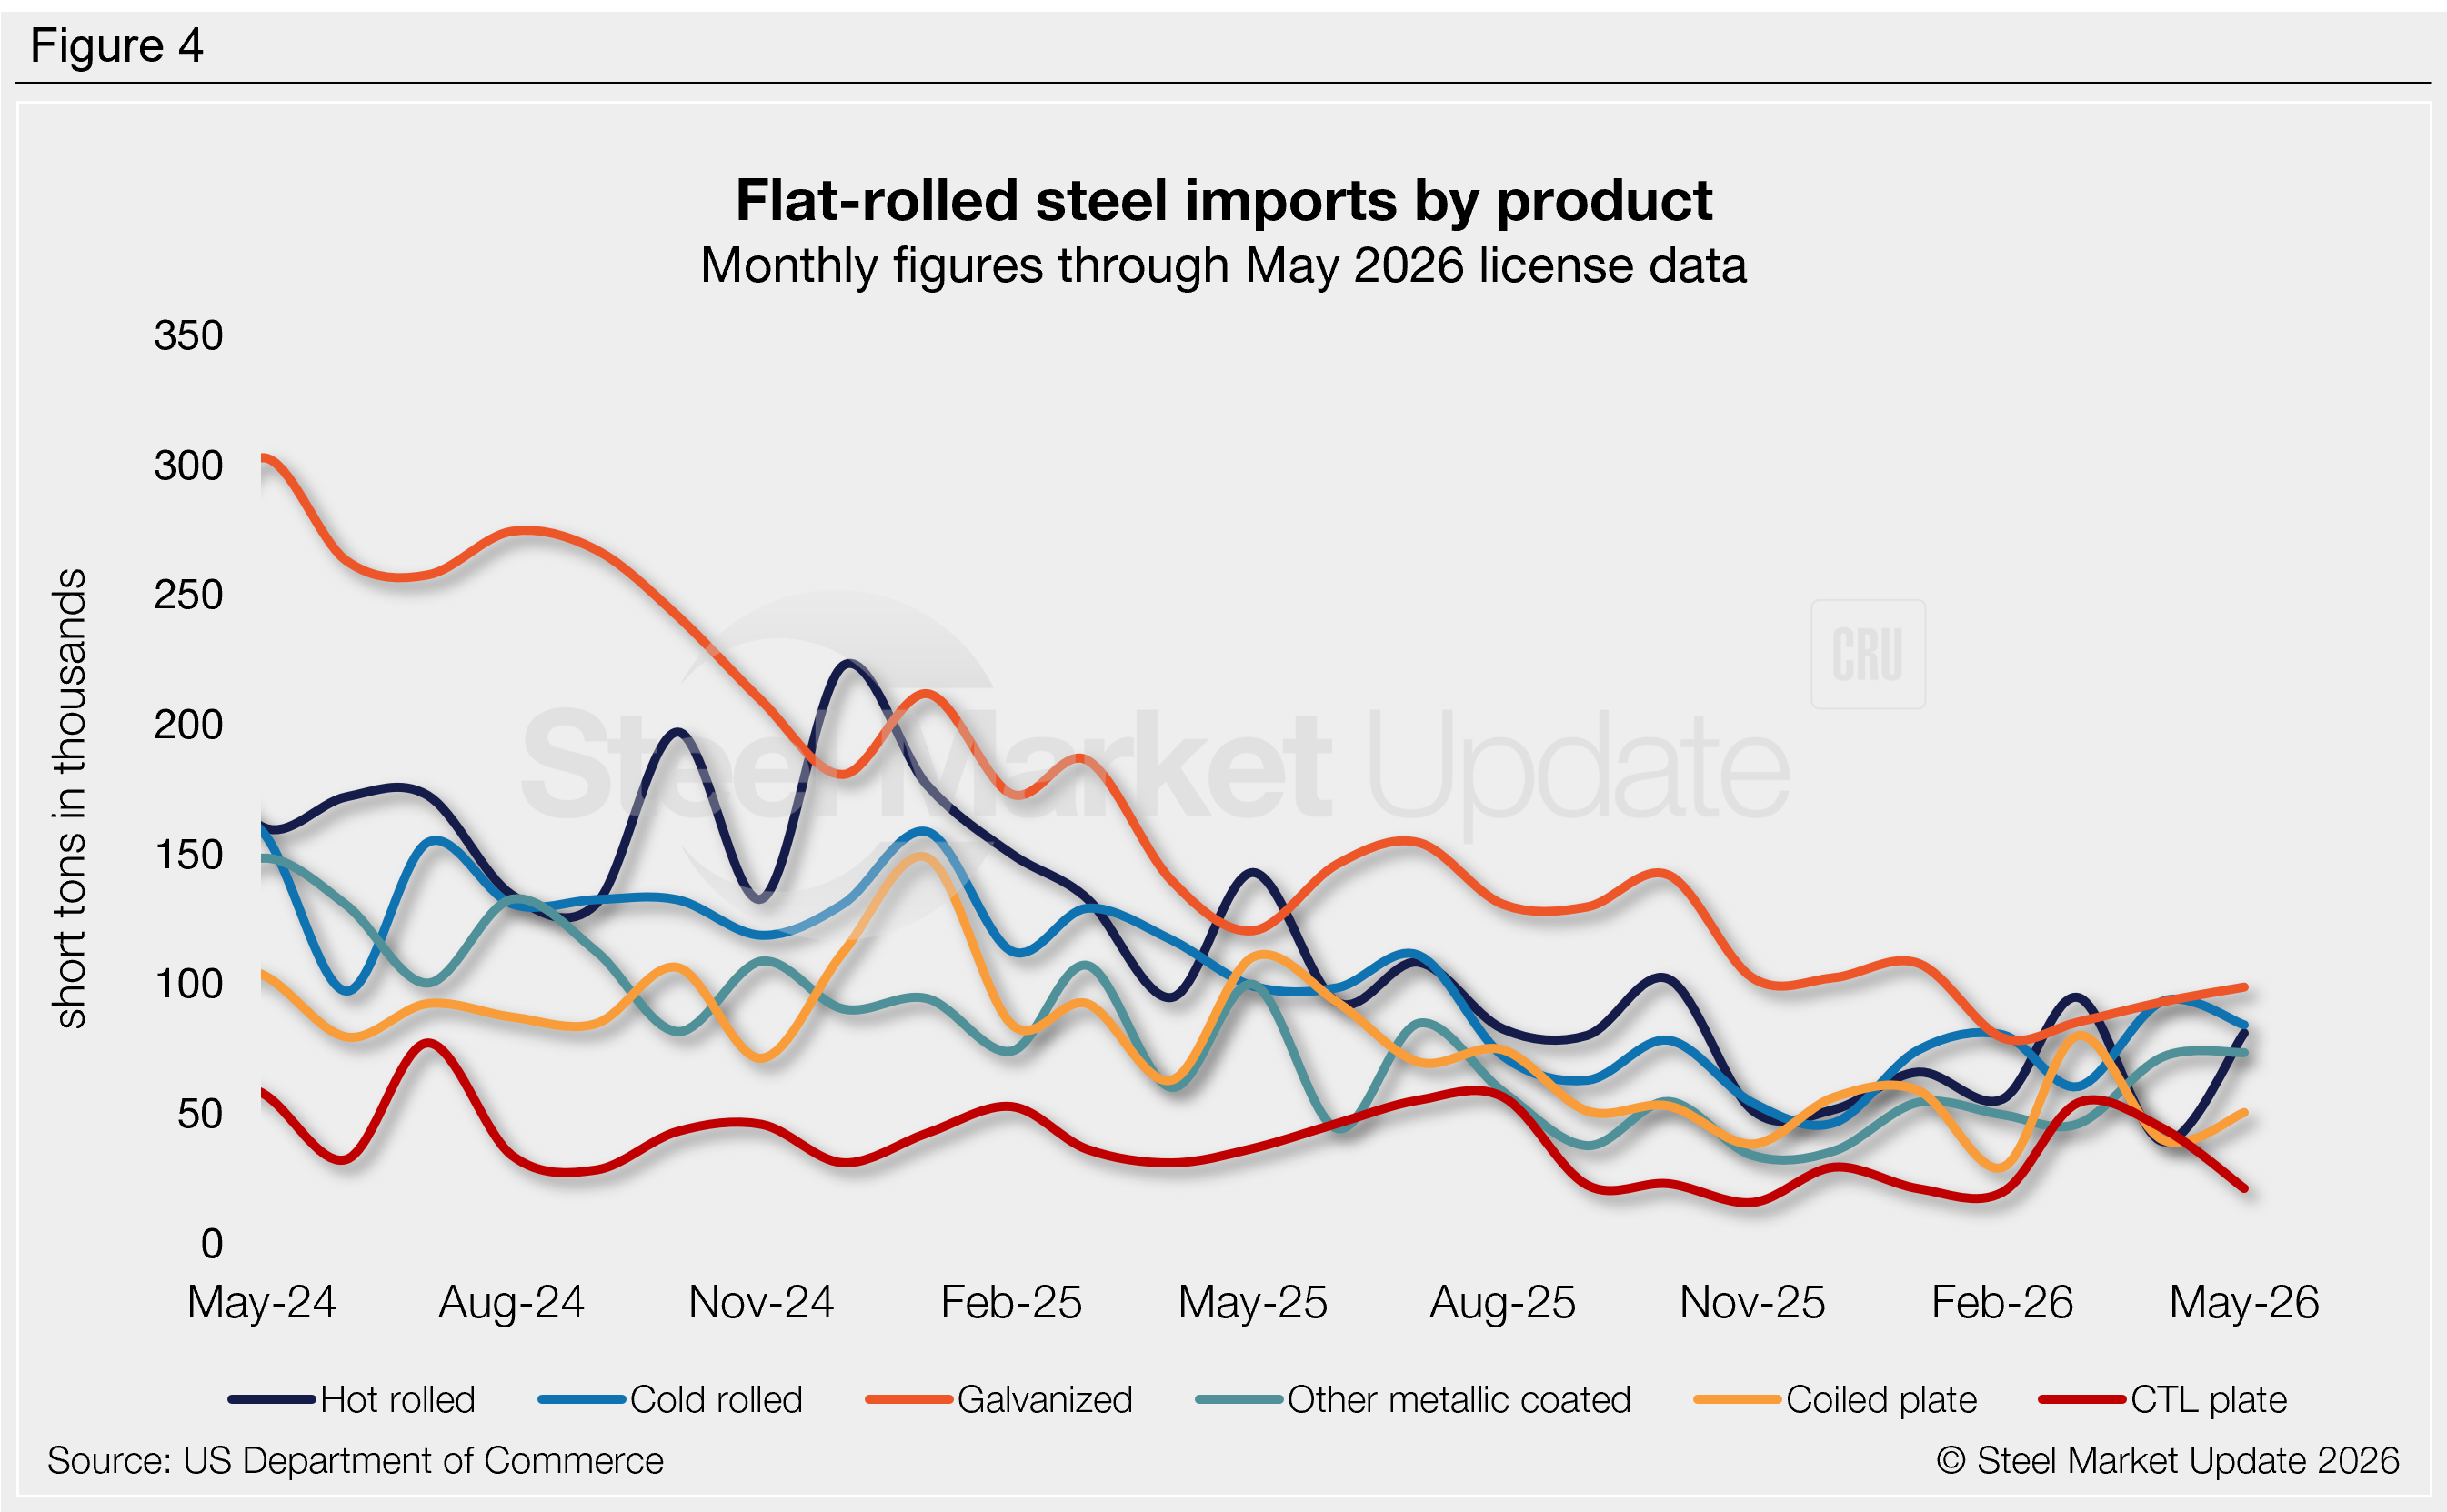
Figure 4 tracks flat-rolled imports for six popular products. Three products saw gains in April and four are up through May. Key highlights:
- Hot-rolled coil imports continue to move erratically. Trade jumped 70% from February to March, then fell 59% in April to the lowest level seen in our limited 28-year data history. May figures are currently back up 106%.
- Cold-rolled coil imports jumped 54% in April to a nine-month high, while May figures are back down 10%.
- Galvanized imports increased 9% m/m in April and another 6% in May to a potential four-month high. Recall that galvanized imports fell to a 15-year low back in February, and May licenses are just 20,000 st above that low.
- Other-metallic coated (mostly Galvalume) imports surged 56% m/m in April and inched up another 2% in May to a potential 10-month high.
- Coiled plate imports slipped 50% m/m in April, just 11,000 st above the multi-year low seen in February. May licenses are currently back up 27%.
- Cut-to-length (CTL) plate imports fell 18% m/m in April and are currently down another 52% in May.