
Market Data

October 29, 2026
HR Futures: Basic story remains, but curve shifts
Written by Gaby Ain
In my last column, the HRC futures curve was pricing a sizable premium on near-term tightness while still pointing toward eventual normalization. Since then, that basic story has remained intact, but the shape of the curve has shifted meaningfully. Rather than simply moving higher and pushing the peak out by another month, as has largely been the pattern throughout this rally, the curve is now pricing a more pronounced and prolonged period of tightness, while the long end has remained relatively anchored, which previously had also been lifted with the rest of the curve.
CME Midwest HRC Futures Curve (10/29 in white, 10/22 in blue, 9/17 in orange)
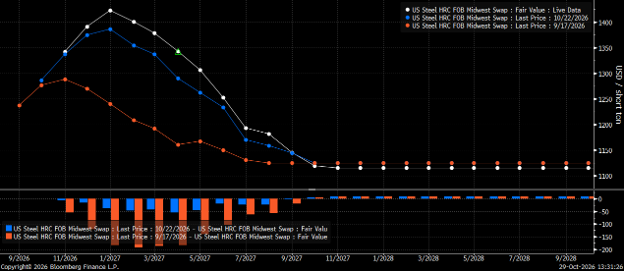
The progression of the curve tells the story. On Sept. 17 (orange), November 2026 marked the peak before prices declined fairly steadily toward the long-dated portion of the curve. By Oct. 22 (a week ago, blue), the hump had shifted outward, with January 2027 becoming the peak. Today’s curve (white) extends that move further, with January now above $1,400 per short ton (st) and much of the first half of 2027 trading materially above where it stood six weeks ago.
What is equally notable is what has not changed. The long end remains comparatively anchored near the low $1,100s. As a result, the spread between the January peak and deferred prices has widened to roughly $300/st.
The change in shape suggests the market has not materially altered its view of where HRC prices eventually normalize. Instead, it has both increased and extended the premium assigned to the first half of 2027. What was previously priced more like a late-2026 squeeze has evolved into an expectation of tighter conditions persisting well into next year. In other words, the magnitude and duration of the expected tightness have been repriced more than the ultimate destination.
CME HRC Money-Manager Positioning
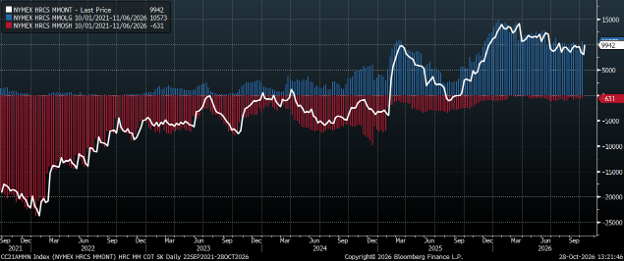
Money-manager positioning adds another dimension. At the time of my previous column, net positioning stood at 9,289 contracts. From there, net longs declined to 7,963 by Oct. 16 even as HRC futures continued to move higher. For several weeks, prices were rising while speculative positioning was being reduced. That pattern changed sharply in the latest week. Net longs jumped by nearly 2,000 contracts to 9,942, driven primarily by fresh long additions. Gross longs increased by 1,867, while shorts declined by just 112.
Stay tuned
That distinction is worth watching. In my prior column, I noted that with the short base already considerably smaller, another leg higher in HRC futures would increasingly require fresh long participation and continued fundamental support, and for the first time in several weeks, futures prices and positioning are moving higher together. Whether that continues may be important. One week of renewed buying does not necessarily establish a new trend, and net positioning remains below the highs reached earlier this year. But sustained long additions alongside higher prices would represent a shift.
And yet, there are still risks hanging over the market. Renewed trade negotiations with Canada are a potential source of volatility, particularly given how futures responded to similar headlines about two months ago. Improving import economics and domestic capacity additions expected next year could also provide additional supply overtime. Demand, meanwhile, continues to find support from data centers, infrastructure and utilizes, while broader end-user conditions may be more mixed.
The more interesting question, to me, remains to be what happens when one of those supply pressure release valves begins to open. How much incremental volume will actually be required to materially loosen physical market conditions? With inventories already lean and lead times extending above nine weeks, additional tons may initially be absorbed by the market rather than immediately relieving tightness. If so, the amount of new supply required to meaningfully change current conditions could prove larger than the initial futures market reaction to those developments might imply.
Disclaimer
The content of this article is for informational purposes only. The views in this article do not represent financial services or advice. Any opinion expressed by Flack Global Metals or Flack Capital Markets should not be treated as a specific inducement to make a particular investment or follow a particular strategy, but only as an expression of his or her opinion. Views and forecasts expressed are as of date indicated, are subject to change without notice, may not come to be and do not represent a recommendation or offer of any particular security, strategy or investment. Strategies mentioned may not be suitable for you. You must make an independent decision regarding investments or strategies mentioned in this article. It is recommended you consider your own particular circumstances and seek the advice of a financial professional before taking action in financial markets.