

Analysis
October 3, 2013
Non-Residential Construction: A Detailed Analysis
Written by Peter Wright
The Commerce Department data for construction expenditures in August should have been released on October 1st but due to the government shutdown is not available. We therefore decided to use our existing data and to take a more detailed look at non residential construction which is by far the largest sector of total construction expenditures.
Total construction expenditures in 2013 through July were $491,769 million. The first cut the Commerce Department makes to this number is to break it out into its funding source. Private, state + local and federal. This year privately financed construction has accounted for 70.5 percent of the total, state + locally funded has been 26.8 percent and federally funded only 2.7 percent. There are a huge number of sub categories in the private and state + local construction expenditure categories, not so many in federal where expenditures are minimal. At Steel Market Update we combine these sub categories in-order to make the data more understandable.
Drilling down further we find that 47.5 percent of total construction was non residential buildings most of which was privately financed. Of the total private expenditures, 66.2 percent year to date (YTD) was buildings of which 46.9 percent was non residential and 18.7 percent residential. The largest component of state and local expenditures was infrastructure at 55.3 percent and non residential construction at 9.1 percent. This is somewhat surprising given the number of toll roads that are springing up across the country; there is no category of highway construction in the private sector.
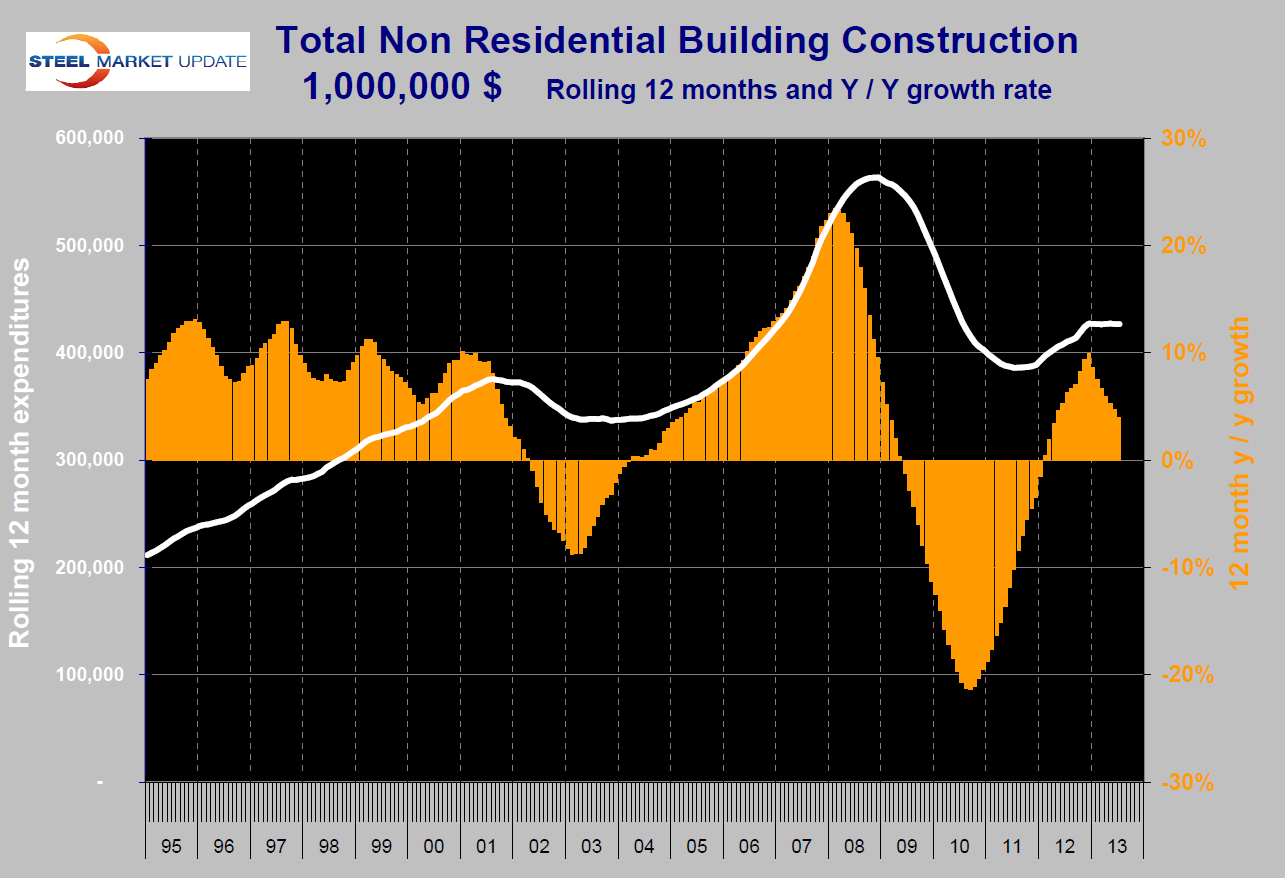 The first point to make in considering the performance of private and public non residential construction is that privately financed work is currently 69.8 percent of the total. This percentage is increasing and likely to do so for several years. In 12 months through July, total non residential construction was down by 24.3 percent from the peak of December 2008. In the 18 month period from mid 2011 through 2012 the trajectory of growth suggested a full recovery in early 2017. Unfortunately in the first seven months of 2013 that trajectory was lost and there is now no way to predict when a full recovery will be achieved (Figure 1).
There is still a 4.0 percent year over year growth rate but that has been declining for seven straight months.
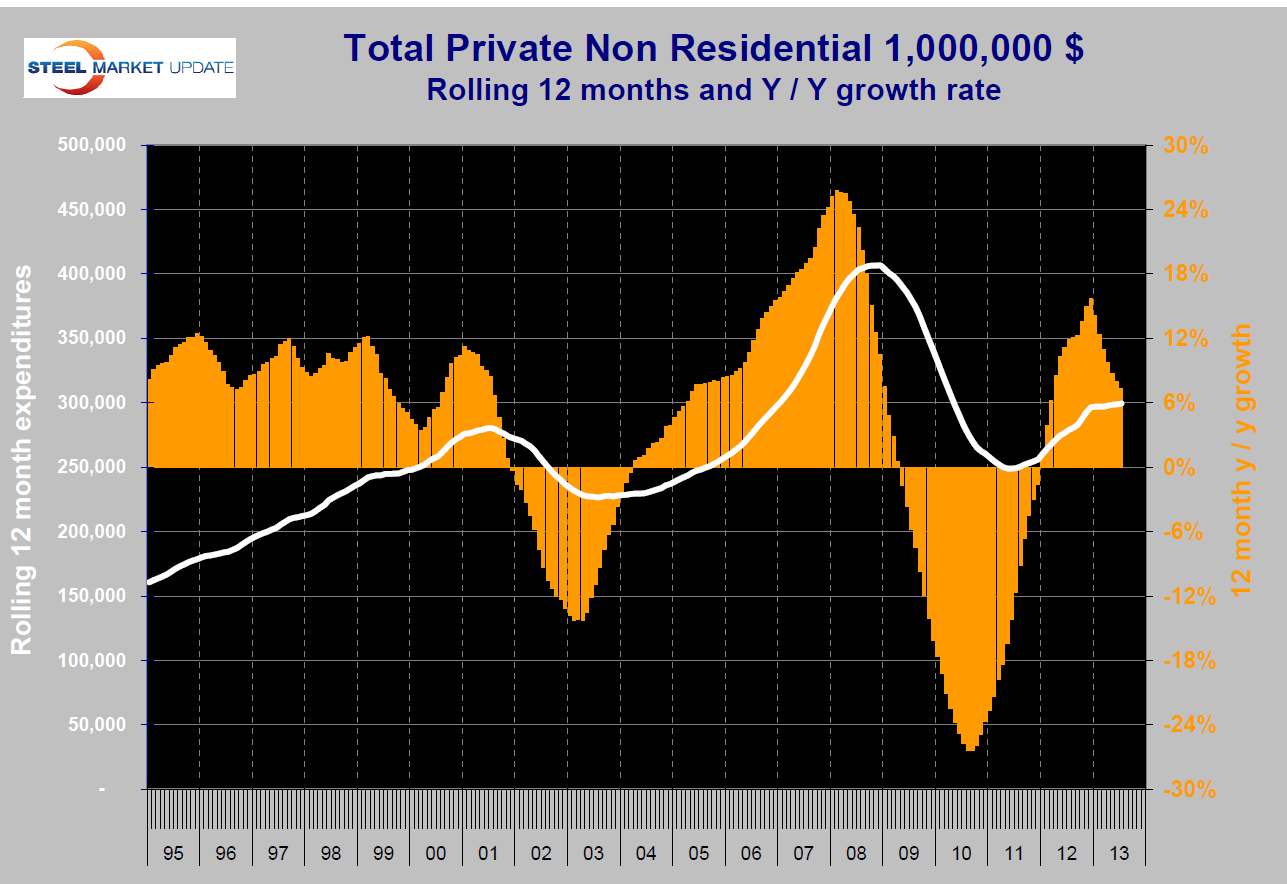 Private construction has been faring better than state and local but as with the total, the previous trajectory of private sector growth has been lost and the year over year growth rate has declined to 7.3 percent over the course of 2013 (Figure 2).
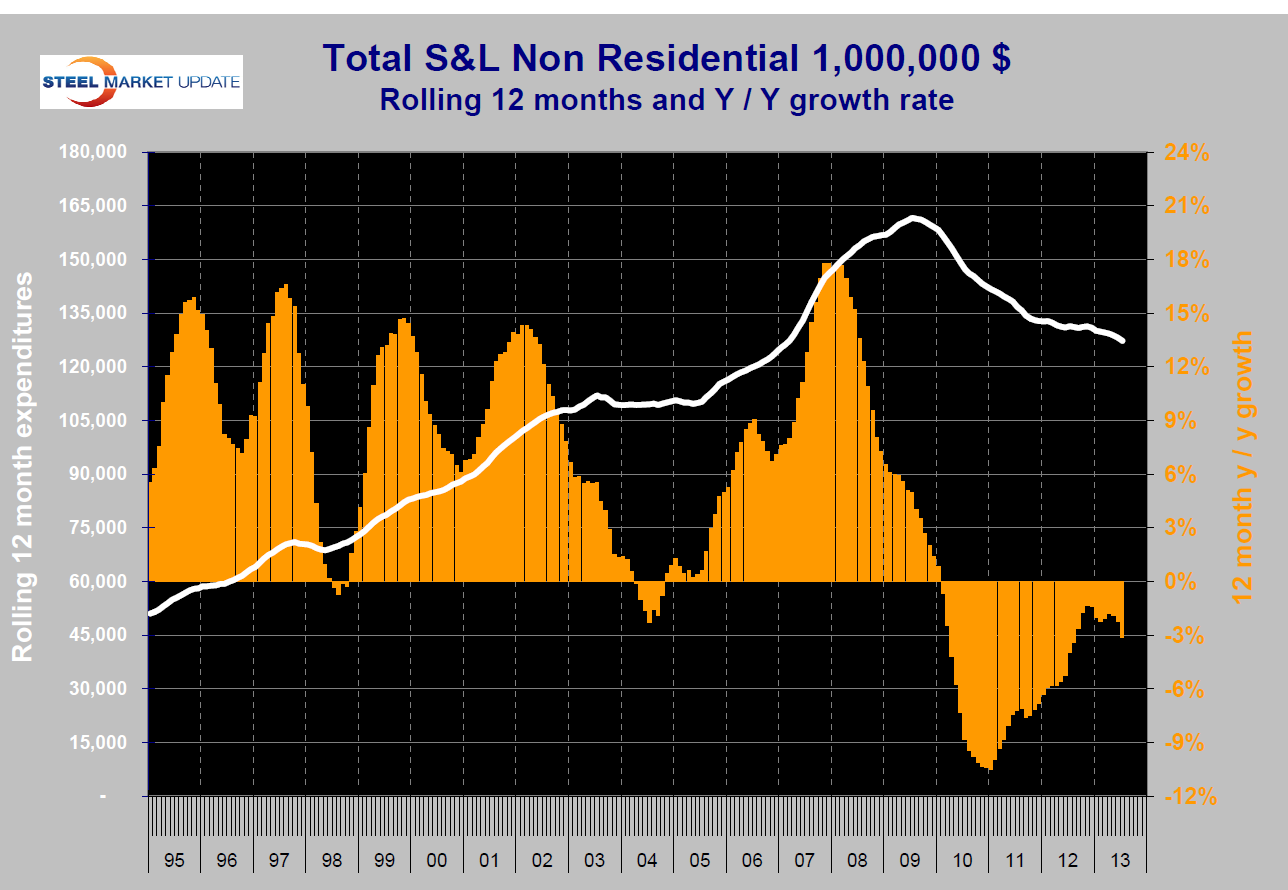 The greatest problem with non residential construction is in the public sector where growth has been negative for 43 months and the expenditure trajectory is still heading south (Figure 3). In 12 months through July the year over year growth rate was negative 3.1 percent. There is a growing concern on the part of local and state governments that the optimistic projections for financial return within their retirement funds may not be realized in which case these programs are underfunded by trillions of dollars nationwide. Detroit is a case in point. Discretionary non residential construction of schools, city halls, fire stations etc has suffered badly since the recession and no recovery is in sight. It had been hoped that the private sector would be the engine of the total non residential sector but that force has declined. From the point of view of steel consumption through 2014 it doesn’t look as though the construction critical products such as heavy structurals will fare well.


